
Comparative study of natural chemical for enhanced oil recovery:Focus on extraction and adsorption at quartz sand surface
2023-08-30 03:25AzzaHashimAasRamziAdAlsaheJaafarKamilAdullah
Petroleum 2023年1期
Azza Hashim Aas ,Ramzi A.Ad Alsahe ,Jaafar Kamil Adullah
a School of Mining and Geosciences,Nazarbayev University,Kazakhstan
b Al-khwarizmi College of Engineering,University of Baghdad,Iraq
c Basrah University College of Science and Technology,Iraq
Keywords:Natural surfactants Quartz Adsorption isotherm Salinity Fenugreek Sugar beet leaves Chickpeas
ABSTRACT In chemical enhanced oil recovery(CEOR),it is very important to utilize the excessive usage of chemicals.A great opportunity lies in adopting natural surfactants,since it is cheaper,ecosystem friendly,and less toxic than their counterpart synthetic surfactants.Despite the availability of natural surfactant sources,it is yet very early to decide on their applicability.Therefore,this research focuses on natural-saponin extracted from different raw materials available in the Middle East and their interaction with quartzsand.A special focus was given to the adsorption isotherm models to describe the interaction with the reservoir rocks.Three raw materials were investigated are fenugreek,sugar beet leaves and chickpeas.The main extraction method employed was the chemical extraction using the soxhelet.The study used Uv-vis spectrometer to investigate the micellization behaviour and the consequent adsorption on quartzsand.The presence of triterpenoid saponin is found dominant in all the sample,the intensity and purity differed according to the raw material source.Tthe critical micelle concentration(CMC)was at a close range of 4-5.5 wt%in all the samples.The highest adsorption was obtained by sugar beet leaves which is 192 g/kg.It is 25%and 37%higher than the Fenugreek and chickpeas,respectively.Increasing the salinity resulted in adsorption reduction between 2% and 56%.For the adsorption isotherms,it showed good agreement with the Langmuir model fitting.The remarkable finding is that the sugar beet leaves heterogeneous model seems to be valid by Frendluich and Halsey isotherms.
1.Introduction
During the last decade,the interest in converting the oil and gas sector toward a green setup became pivotal.As the next logical step towards the green industry,the R&D effort focused on reducing the excessive usage of chemicals.This effort led to trials of replacing petroleum-based chemicals with natural chemicals.The interest has included developing new chemicals from sustainable sources and waste materials [1-3].However,despite the appreciated endeavors,the efforts are still progressing slowly [4-6].Among the most critical chemical employment in the oil and gas sector is the chemical flooding to extract the trapped oil.The process is known as chemical enhanced oil recovery (CEOR),which is considerably utilized for brown reservoirs and requires large chemical quantities[7].Several chemicals could be employed,including alkalines,surfactants and polymers.Usually,these chemicals could be applied in combination or as suitable for the field specification.
When the surfactant was introduced to CEOR,the laboratory experiments were very promising for most of the targeted fields.The surfactant gained attention because of its oil solubilization advantage as it depends on the surfactant constituent.Surfactants have hydrophilic and hydrophobic parts;the polar part attracts water,while the nonpolar part can adsorb onto the oil.Thus,the surfactant can organize itself between the oil and water interface and reduce the interfacial tension (IFT),which improves the solubilization [8,9].However,despite the rigorous screening criteria of optimum surfactant selection,there is a complexity of attaining the laboratory results in the field.Technically,the used surfactant has to reduce the IFT between (10-3-10-4) mN/m and maintain stability under a wide range of salinities and temperatures.Often,In-field application requires large quantities of surfactants at a specific effective concentration.However,the surfactant concentration suffers from drastic losses on the rock due to the adsorption phenomenon[8].
Understanding the adsorption rate is an essential step in any liquid/solid interface.It is known that for simple liquid/solid,the adsorption behaviour is generally uncomplicated.This can be modelled and quantified accurately based on the liquid/solid interactions[10].However,because of the diversity of reservoir rock composition,the adsorption rate changes according to the fluid path in porous media,types of the available clay minerals,cation exchange capacity and interaction surface area [11-13].Several possible mechanisms lead to surfactant adsorption on solid surfaces,depending on the surfactant nature:polar group charge,the active groups,length of the hydrophobic chain,and the linkage between the hydrocarbon chain [14,15].Several researchers have discussed the role of anionic surfactant and their adsorption on sandstone reservoirs [16].
On the aspect of surfactant application in sandstone reservoirs,the anionic surfactants were favored.This is because the anionic surfactants have a lower affinity to adsorb on the negatively charged surfaces,which prohibit drastic losses.Despite this fact,the anionic surfactant adsorbs on negative surfaces by the hydrophobic interaction.The adsorption studies usually focus on understanding three main parameters to evaluate anionic surfactant adsorption behaviour: salinity,temperature and pH.The surfactants usually applied in a salinity match the reservoir condition,the anionic surfactant negative charge lessens,and so do the repulsive electrostatic forces [17,18].It is also known that at high temperatures,the anionic surfactants remain soluble and in active motion,which reduces their adsorption on sandstone surfaces;this has been explained by the exothermic nature of micellization and adsorption [19].The anionic surfactants exhibit a linear reduction in the adsorption at higher pH.Thus,it is usually to modify the surfactants with basic additives.The mechanism has been explained by the pH effect on the zeta potential of the rock and minerals.As a result,the rocks and minerals became more negatively charged or compressing the electrical double layer [20].
On a contemporary aspect,finding low-cost surfactants turned the attention to the natural surfactant utilization for CEOR.In recent years,studies of naturally derived surfactants expanded into petroleum.This is because the natural surfactants are ecosystem friendly and are less toxic than their counterpart synthetic surfactants [21].The additional advantage is the wide range of selective raw materials with good biodegradability,higher solubilization,and enhanced foaming ability.Finally,the availability of the raw material locally based in each region is an excellent asset for the large field application.However,despite the natural surfactant promising results,they are still in laboratory studies.
A thorough investigation of natural surfactants promoted plants that contain saponin.Saponin is a nonionic surfactant that can be found in flowers,fruits,seeds,roots and leaves.Saponins have a rigid skeleton of hydrocarbon rings that are attached to sugar.The saponin nature induces the solubility of water and oil.The aglycone has a lipid nature that forms a bond with hydrocarbons,while the sugar is soluble in water[22,23].Despite the general agreement on the expected IFT reduction mechanisms,technically,the saponin concentration differs based on the source and the method of extraction.The saponin extraction processes include physical and chemical concepts.The physical methods,namely,are ultrasoundassisted,microwave-assisted,and accelerated solvent extraction.In contrast,the chemical methods are more of conventional nature,including maceration,soxhlet and reflux extraction [22].The variation of the extraction processes,the raw source,and the saponin composition are what decides the surfactant efficiency.However,with the limited data,it is inconspicuous which natural surfactant is optimal.Tracking the feasibility studies for different naturalbased saponin confirmed a possible reduction of IFT at different oleic phases.For instance,Soapnut fruit pericarp shell samples were used as a source of saponin and successfully reduced IFT of high viscous crude (15 cp at 20°C)/water from 19 dyn/cm to 2.5 dyn/cm [24].Also,Matricaria chamomilla was examined for kerosene/water IFT and altered the IFT from 30.63 to 12.57 mN/m[25].Another study on Seidlitzia Rosmarinus was tested for IFT against kerosene and it was able to reduce the IFT from 32 mN/m to 8.9 mN/m.All the feasibility studies paved the road to more detailed studies on saponin efficiency.Interesting results have been reported about the saponin significant ability to reduce oil viscosity from 2375 cp to 900 cp[26].On different examinations,the Cedar Saponin was able to alter the wettability on calcite,dolomite and sandstone rocks [27].
Surfactant adsorption hinders the surfactant applicability,especially the nonionic type,because of the high adsorption rate.A previous study modeled the cedar saponin,and it found a significant adsorption load on shale sandstone [28].A comparison between nonionic surfactants and saponin showed that saponin adsorption had the highest adsorption rate.The study justified the observation by branch-like molecular structure and the existence of terminal functional groups to interact with carbonate[29].Another interesting research on natural surfactant showed that the maximum adsorption uptake for anionic natural surfactant was only 60.08 mg/g in sandstone and it supported the monolayer adsorption behavioiur by the Langmuir isotherm model [30].Afterward,the soap nut anionic natural surfactants adsorption study on quartz showed only 5 mg/g adsorption at the highest concentration of 12,000 ppm [31].On another aspect,a saponin based surfactant was studied for its adsorption on montmollonite and it showed that hydrophilic part has high affinity to adsorb on the mineral surface with high possability of developing hydrogen bonding between the hydroxyl groups of hydrophilic part and available siloxane surface [32].A published study on natural surfactant derived from Waste Vegetable Oil showed that the affinity of natural surfactants to adsorb on different rock material are less than the cationic surfactants.Also,it showed a range of adsorption varies between 0,5 mg/g to 2 mg/g at the critical concentration[33].In fact,the different arguments about the adsorption uptake by the natural derived surfactant made it challenging to conclude.Henceforth,there is a paucity of research evidence regarding the natural surfactant losses due to adsorption.
Therefore,the current study is centered on identifying the possibility of using saponins derived from natural sources particularly in the Middle East.The purpose of the study is twofold.The first objective is to extract saponin from different materials,while the second objective is to examine the saponin adsorption on quartz-sand.Applying the current research promises to demystify the adsorption isotherm and adsorption rate for different natural saponin extraction.This study aids the pursuit of new naturalbased chemicals that reduce our dependency on petroleum-based chemicals.The study is a proactive investigation that can accelerate the application of natural surfactants in oil fields for different purposes.
2.Methodology
2.1.Saponin extraction from plants
2.1.1.Saponin extraction from Fenugreek
Fenugreek (Trigonella foenum graecum L.) is an annual plant from the family of Leguminosae.It is usually found in mideternean countries.The seed believes to contain saponin-rich subfractions[34].Fenugreek seeds of 1000 g were obtained from a local shop in Baghdad,Iraq.They were ground in a commercial blender(Waring,New Hartford,CT,USA).The powder was passed through a sieve of 0.9 mm size.The powder was extracted with 50 ml of ethanol of 30% v/v at 26°C in the soxhlet.The Soxhlet extractor (Model: BST/SXM-1.Bionics from USA).The operation period took around 16 h.The final solution was filtered with a filter paper of 150 mm.Finally,the powder was cleaned three times by deionized water(DIW) before dried in the oven.The final yield was stored in the freezer at a temperature of -4°C.
2.1.2.Saponin extraction from sugar beet leaves
The fresh sugar beet leaves were brought from the local market in Baghdad,Iraq.Then,the leaves were cleaned by sodium hydroxide NaOH (pH of 11) and followed by hot water of 50°C for gentle washing.Afterward,the sugar leaves beet was dried in the oven at 70°C for 3 h.To ensure moisture removal,the dried sugar beet leaves were left in the sunlight for 24 h.The grounding process took place to convert the dried leaves to powder.
For the saponin extraction process,1000 g of the powder was added to 50%(v/v)methanol of 50 ml at a temperature of 50°C.The extraction time took 18 h.The precipitate containing saponins was separated by filtration and washed with DIW.The final yield was stored in the freezer at a temperature of -4°C.The extraction process is depicted in Fig.1.It worth stating,a similar procedure was used by Brezhneva et al.,2001 [35].

Fig.1.Material preparation (a) fenugreek (b) sugar beet leaves and (c) chickpeas.
2.1.3.Saponin extraction from chickpeas
1000 g of chickpeas was milled in a commercial blender (Waring,New Hartford,CT,USA)in a ratio of 1:2(w/w)ratio with dry ice.The dry flour was transferred into the soxhelet.A 50%(v/v)ethanol of 250 mL was added.The extraction period was 15 h at 70°C.The extracted crude was then filtered by 150 mm ashless paper to assure the removal of any additional methanol.The sample was left to dry for 24 h before use.The final yield was stored in the freezer at a temperature of -4°C.
2.2.Extraction characterization
2.2.1.FTIR
The apparatus used for measuring the FTIR spectra is the IRAffinity-1.Shimadzu,Japan.The extraction was tested in the range of 450-4000 cm-1.The operation was done by analyzing 4 mg of dried sample.
2.3.Solution preparation
The extracted powder was preserved in the fridge at a temperature of-4°C.Deionized water(DIW)was used to prepare a stock solution of the saponin.The solution was formulated in standard volumetric flasks (V=1000 ml) by adding 10 g of the saponin extraction and steered at 300 rpm for 15 min.The steering time was sufficient to allow a fully homogeneous solution.Furthermore,any surfactant concentration was prepared by the dilution process.
2.4.Critical micelle concentration determination by UV-vis spectrometer
The UV-Vis absorption spectroscopy method comprises a light that passes through any molecular sample then partially absorbs and reflects.The molecules'internal energy dictates the absorbance degree.Therefore any colloidal particle has a relative wavelength of light.When the surfactants form micelle,the absorbance changes can detect the critical micelle concentration (CMC) value.Thus,in order to determine the CMC,10 samples were prepared at different concentrations.The samples varied from the concentration of 0.5 wt% to 10 wt% for each extraction.A UV-1800 UV-vis from Shimadzu,Japan was used to take the samples reading.The samples were subjected to all wavelengths from 190 nm to 700 nm.The proper wavelength was selected,corresponding to the highest absorbance reading.At the highest wavelength,the samples’absorbance readings were recorded.The CMCs were determined at the intersection of the absorbance lines.All the readings were repeated three times.The repetition of the readings helps to sustain representative averaged values needed to obtain the calibration curve.Pinpointing that at each step,the cuvette and the lens were cleaned to remove any fingerprints.
2.5.Adsorption study
The adsorption was studied to understand the extraction applicability in the reservoir rock.The adsorption study was carried out using the static batch equilibrium.The adsorbent under the investigation was quartz sand.This is because quartz is the main constituent in sandstone reservoirs.Regarding the adsorbent used in the experiment,quartz sand is received from an outcrop in ALKarada district of Baghdad,Iraq.The sources' selection was because it resembles the Iraqi oil fields’ sandstone.The samples were triple-washed in DIW dried in the oven at a temperature of 105°C.Afterward,the samples were sieved and used the adsorbent selected between (100-150)μm.
So for each extracted saponin,the CMC concentration was detected.New solutions were prepared at the closest rounded value to the CMC's.At the selected concentrations,the absorbance reading was detected before placing the absorbent samples.This step was considered to check the validity of the reading against each extraction samples' calibration curve.
2.5.1.Saponin adsorption quantification
10 gm of the adsorbent was added to 100 ml of each saponin solution.The solutions were shaken for 8 h at a speed of 200 rpm using Rotary shaker (Innova 4080,New Brunswick,NJ,USA).Then the solutions were centrifuged to allow the adsorbent to settle.Afterward,the solutions were filtered using filter papers.The UV-visible spectrophotometer determined the resulted solution absorbance.Lastly,the new concentrations were determined using the calibration curves.The second part of the experiment was then repeated to evaluate the effect of salinity,particularly at the CMC.A monovalent ion sodium salt(NaCl)at concentrations of 3 wt%,6 wt%,9 wt%and 12 wt%was selected for the evaluation.Similar to salinity,the study was conducted at elevated temperatures of 35°C,45°C and 55°C at the CMC.It is worth mentioning that at the initial stage,the detection of the UV-vis light at a temperature higher than 55°C was fluctuating.This reveals that the natural surfactant is sensitive to temperature.The solution pH was at an average of 6 ±0.5.
q=Adsorption amount (g/Kg)
Ci=Initial concentration (g/L)
Cef=Effluent concentration (g/L)
Vsaponin=Volume of Lignin (ml)
Wadsorbent=(g)
2.6.Adsorption models
Equilibrium isotherm equations are used in this study to describe the experimental adsorption data of any system.Understanding the equation parameters can provide insightful information about the adsorption mechanism,surface properties and ion/affinity.Therefore,the prediction of the loading of adsorption matrix concentration can be made by a different method.The current study intends to fit the experimental data for all the studied samples [36].
2.6.1.Langmuir isotherm model
Langmuir theory assumed that sorption occurs at a specific homogenous site in the adsorbent.The adsorbate will be saturated at the sites till it fully covers that surface.For the Langmuir model,the adsorption rate is proportional to the mechanistic source and site area.Thus,stating that the main force is the adsorbate concentration.
Generally,the Langmuir equation relates solid-phase adsorbate concentration and the equilibrium concentration uptake at a fixed temperature[37,38].
The linear equation is given as:
whereq=amount adsorbed (g/kg);qmax=maximum amount adsorbed (g/kg);KL=Langmuir equilibrium constant (L/g);Ce=equilibrium aqueous concentration (g/L).
2.6.2.Freundlich isotherm model
Freundlich's model is based on the assumption that adsorbent has a heterogeneous surface.This implies that multiple adsorption sites.The model is taking into consideration that the surface uptakes are not constant for the adsorbate at different concentrations.The equilibrium concentration modeled this,Ce,is raised to the power 1/n[39].
The linear equation is as seen in eq.(3)
where,KFis the Freundlich constant related to the sorption capacity;1/nis the sorption intensity.From thelogqversuslog Ceplot,the intercept at a given exponential condition gives the value ofKF,while the slope gives the value for 1/n.
2.6.3.Halsey isotherm model
The Halsey's model assumes adsorption of multilayers.The adsorption occurs at a relatively large distance from the surface,which is considered a form of heterogeneity.The Halsey model can be expressed in the linear form in eq.(4).
whereKhandnhare the Halsey isotherm constants.
3.Results
3.1.Extraction evaluation
The saponin yield is an essential factor because it determines the raw material's required amount to get a sufficient quantity.Therefore,the yield is usually measured for each kilogram used in the preparation.As seen in Fig.2,the quantity of saponin extracted exhibits variation across the original raw material.Although all the raw materials are known to have saponin,they initially contain different saponin concentrations.Besides this fact,the extraction method and preparation affect the yield.In this sense,the quantitative analysis indicates the highest saponin yield in sugar beet leaves.The Fenugreek and chickpeas have relatively similar yields.

Fig.2.Saponin yield extracted from raw materials.
Technically,saponin yield is related to the quantity of sugar in the raw materials and their linkage.The presence of saponins in sugar beets(Beta vulgaris)has been known for over 100 years.It is known that extracting sugar from the sugar beet requires extracting saponin during the purification stage.It was noticed that different sugar beets have a different amount of saponin,which varies for environmental factors.In the current examination,the sugar beet leaves have a similar yield to what has been reported for the sugar leaves source[40,41].
Regarding fenugreek,to date,nearly 15 sapogenins and 50 saponins have been reported to exist in fenugreek with a yield between 1 and 50 g[23].The yield obtained from the fenugreek is at the low spectrum,which my attributes to the isolation process and the fenugreek source [23].Examining the chickpeas indicates a saponin content that is between 8 and 14.7 g.The current chickpeas showed a comparable result to the Turkish seed saponin extraction[42],which indicates that chickpeas originated in this region.
Since saponin has different types,identifying the functional groups can give insightful information on their chemical activities.Thus,FTIR spectroscopy is used to characterize the specific kind of bounds and the functional groups.The FTIR spectrum of the saponin yield has been examined for all three raw materials.For simplicity purposes,the saponin extracted will be referred to as their original raw material unless stated otherwise.All the three materials’peaks were similar but with a noticeable difference in the peak intensity,as seen in Fig.3.In general,the spectra of saponin demonstrated two main saponin signatures.Firstly,the triterpenoid saponin at 866-870 cm-1which indicates sapogenin attached with sugar moieties.The second signature is the general terpenoid saponin.Terpenoid is confirmed by hydroxyl group OH,which was observed between 3469 and 3473 cm-1,C=C at 1650-1670 cm-1and C=O=C at 1450-1510 cm-1.
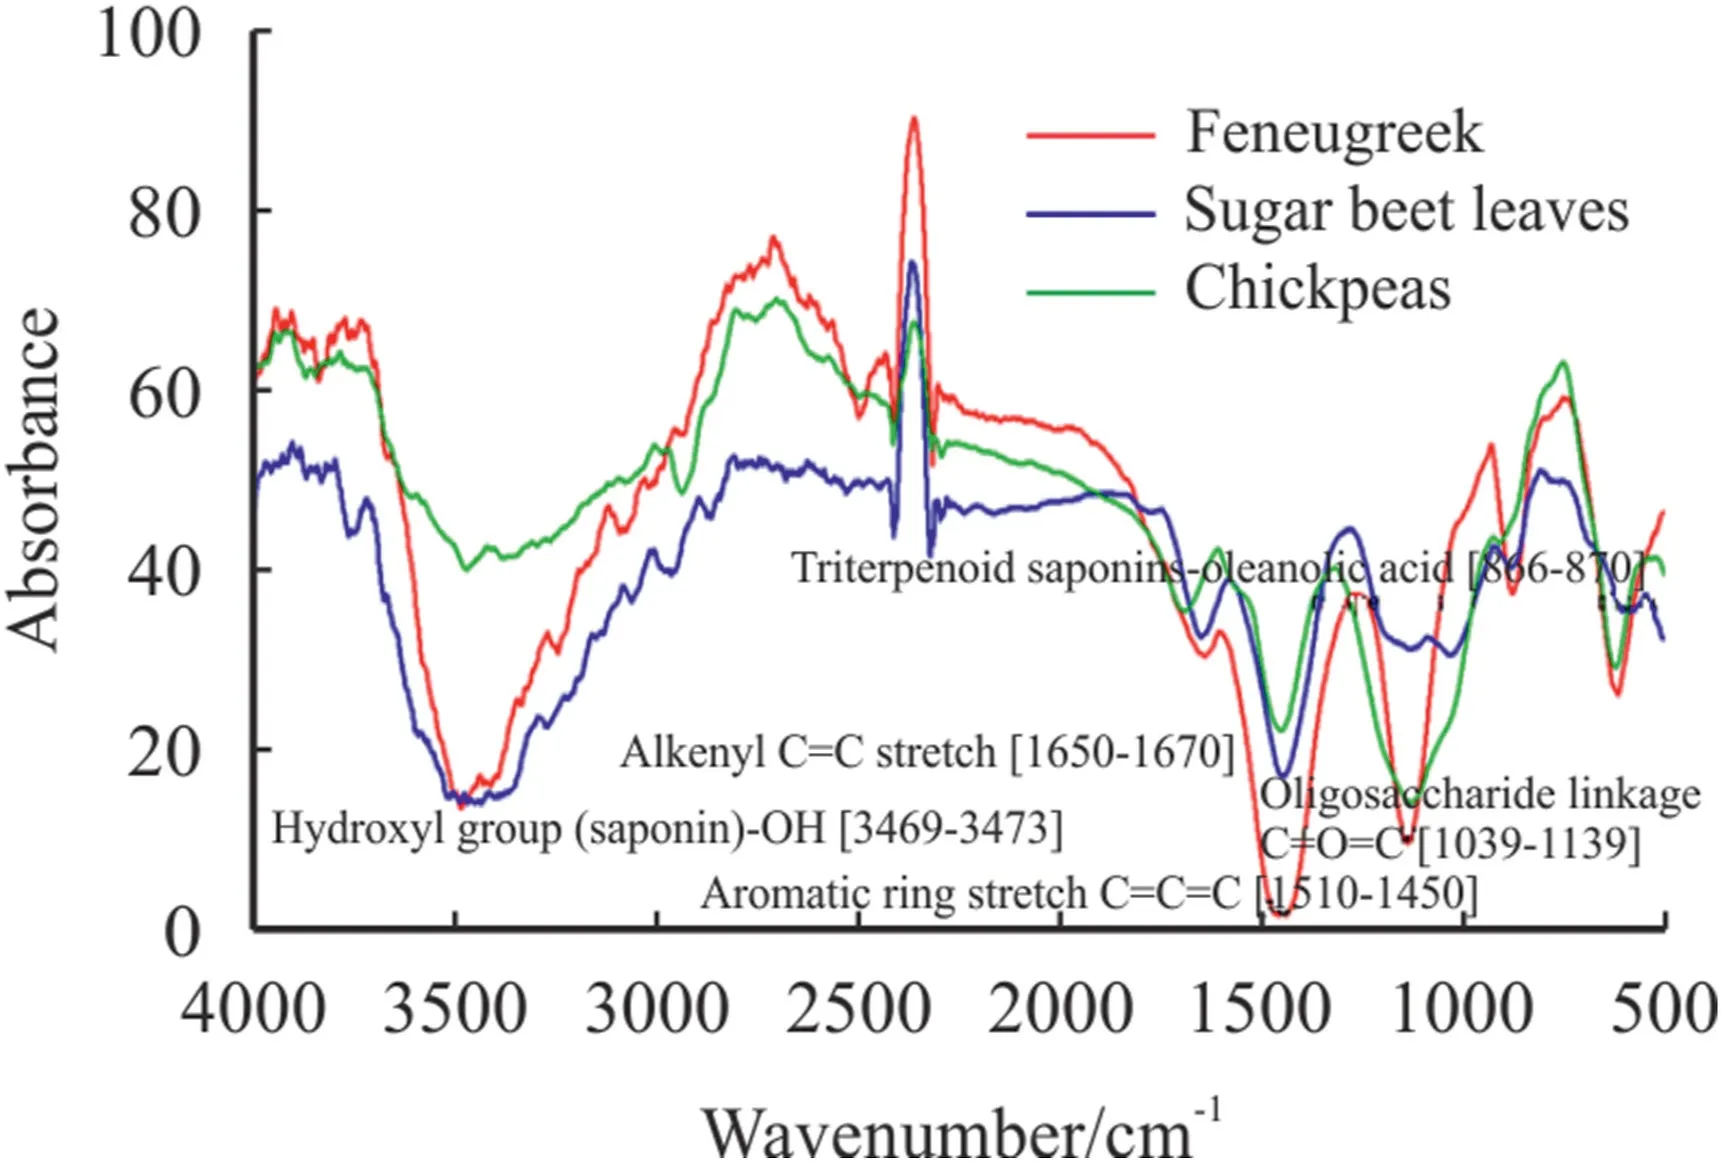
Fig.3.FTIR of extracted saponin from natural sources.
Interestingly,the infrared absorbance intensity from chickpeas saponins is much lower than that from the other two materials.This could be attributed to using ethanol which might strongly react to the sugar content during the extraction.Besides,the extraction time affects the yield of saponins,especially in high temperatures,which is the case in chickpeas.The observation in chickpeas suggests a decomposition of triterpenoid and terpenoid.This resulted in reducing the intensity of saponins and the associated polar compounds in the extract.
3.2.CMC detection
3.2.1.Uv-vis spectroscopy wavelength
The Uv-vis spectrometer has been used to detect the extracted saponin wavelength.The wavelength for all the material is between 200 nm and 300 nm,as seen in Fig.4.The wavelength results showed two major wavelengths detected for each sample.The presence of a secondary wavelength at the same region could be explained by the different functional groups in the samples or the two saponin types co-existing.Moreover,the location of wavelength confirms the presence of triterpenoid saponin.Numerous research reported different wavelengths for the saponin compounds.This shifting is according to the chemical extraction additives [43].
Moreover,by looking into the absorbance intensity,it can be noticed that the chickpeas sample has the lowest intensity.This weak intensity represents a lower concentration of saponin in the sample.Despite the variation,the first detected wavelength was used because it was high and can detect the lower concentration samples’changes,which allows building a proper calibration curve.
3.2.2.Saponin extraction critical micelle concentration
It is known that the absorbance across the samples changes as a function of the concentration.Using this useful behaviour can allow the identification of the micelle formation.At low concentrations,the intensity has low reading.This behaviour differs near the critical micelle concentration,where the intensity reading might reduce or remain semi-constant.The absorbance reading for each saponin at different concentrations is depicted in Fig.5.The intersection in Fig.5 is related to the micelle formation and defining the CMCs values.However,the critical step is the validity of the CMC estimated.This could be obtained if the sample is strictly following Beer Lambert's law.As the concentration absorbance reading displayed two fine structured lines with a good regression coefficient,it can explain the degree of confidence in the CMCs.The low concentration has a linear line with a regression coefficient of 0.94,0.96,0.99 for chickpeas,sugar beet leaves and fenugreek,respectively.However,at a concentration above 5 wt%,a noticeable curvature showed in shape.Despite the curvature,the regression coefficient was sufficient for high concentrations,ranging between 0.88 and 0.96.Since the linear regression coefficient for the low concentration was good,it significantly benefited calibration curve building.

Fig.5.Critical micelle concentration identification.
The CMC values obtained indicate concentration closely for all the samples.The lowest CMC was obtained for the sugar beet leaves,which confirms the FTIR analysis findings.The fenugreek has the highest CMC of 5.3 wt%,which could be attributed to the lower acidity of the fenugreek saponin at a low concentration than the other extractions.Several authors reported that despite the method used for obtaining the CMC of natural surfactants,the intersection was detected at the range of 4-5 wt% [44].Further confirmation proved that the source of natural surfactant had limited influence on the CMC value,and it is still likely to be close to 5 wt% [22,45].On another aspect,some natural surfactants were reported to have a CMC of 8-10 wt%-such as in the case of natural cationic surfactant ex.Seidlitzia Rosmarinu [46].Therefore,the current study finding is inclined to the trend of natural surfactant in the range of 5 wt%.As the CMC is believed to be the threshold concentration for the surfactant to work effectively in reducing the interfacial tension,having low CMC is crucial.Furthermore,the low CMC has two critical implications for field implementation.Firstly,the low CMC affects the amount of surfactant required to be handled in the field.Secondly,if the surfactant requires only a low concentration to operate effectively,it can reduce the total cost compared to similar high-priced surfactants.However,this utilization is challenging,and it is a source of high uncertainty in any chemical flooding project.Thus,the CMC findings of this extraction remarkably indicate the possible application of the natural surfactants.
3.3.Adsorption study
Any surfactant losses during the chemical flooding are reducing the flooding efficiency.Adsorption is one of the important features governing the economic viability of chemical flooding processes[47].The effect of experimental parameters such as the initial concentration and salinity is studied to demystify the different saponin extraction adsorption's on the quartz-sand.
The result of adsorption as a function of concentration in Fig.6 shows that the increasing extraction concentration increases the adsorption.The study found that the fenugreek and chickpeas adsorption quantities were higher than the sugar beet leaves at low concentrations.At the higher concentrations,the sugar beet leaves showed higher adsorption compared to the other samples.Several studies indicated that surfactant adsorption has a similar trend,but no unique curve was observed.Despite that,the adsorption rate of sugar beet leaves on quartz-sand surfaces has a higher rate at the endpoint.
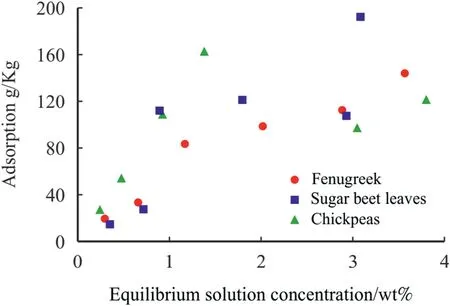
Fig.6.Extracted saponin adsorption on quartz-sand.
Traditionally surfactant is expected to spread over quartz surface and cover the surface.This is because of the van der Waals forces between the surfactant and quartz surface.Quartz surface is partially hydrophobic due to the presence of the siloxane group.Meanwhile,the primary adsorption mechanism of quartz is different from other metal oxides.Moreover few research indicates that the interaction between the uncharged polar group of nonionic surfactants can react to the quartz surface [8,48].The saponin extraction molecules oriented the sugar chain to the quartz surface and then accumulated side by side and covered the surface.The accumulation density increased further until a repulsive force between the impurities and phenolic content became at the threshold point.At this point,the adsorbed film reached its highest thickness and highest adsorption rate.Due to impurities,carboxyl group,and phenols,the behaviour of natural saponin aggregation can follow a similar pattern to the ionic surfactants [49].Moreover,some researchers reported a combination of the hydrogen bond and the hydrophobic.The hydrogen bond is a plausible answer because of the similarity of saponin to synthetic nonionic surfactants,which have been proved to establish hydrogen bonds with the silanol group which is also in quartz [50,51].
At 5 wt% concentration,the effect of salinity was obtained,as seen in Fig.7.Nonionic natural surfactant saponin,the trend showed a decline in adsorption with increasing salinity.The fenugreek sample had a reduction of 7%-37% over the tested range.At the same time,the reduction of the adsorption at sugar beet leaves is between 2%and 22%.The chickpeas sample adsorption decreased between 7%and 56%.This variation is governed by the purity of the extraction since the initial intensity of the hydroxyl group is different.It is known that increasing the salinity results in decreasing the stress of phenolic compounds of any substance.This was observed in different plant extraction on various occasions[49,52].Generally the mechanism of nonionic surfactant adsorption under salinity has been limited described in the literature compared to ionic surfactants.It is well known that nonionic surfactants are physically adsorbed rather than electrostatically or chemisorbed.However,nonionic surfactant adsorption in the presence of electrolytes goes through two scenarios.First,at low monovalent ion concentrations,the nonionic surfactants tend to decrease.This is because of the reduction of the available adsorption sites.However,this condition is only valid for a certain range of ionic strength.The ionic strength range where this case is valid depends on the nature of the dominant functional group in the surfactant and the length of the carbon chain.Therefore,it is very critical to evaluate each nonionic surfactant separately to obtain an accurate limit.On the other scenario aspect,it is clear that after a particular ionic strength-higher ionic strength-the solubility of the nonionic will increase because of the monovalent ions pairing with the active groups[53].In the case of nonionic surfactant adsorption on quartz,a study on Triton X-100 on three different types of quartz showed that with the addition of NaCl,the adsorption density of Triton X-100 on quartz decreased when the quartz was pure in comparison to quartz/clay mineral mixed samples.The binding affinity of Na+ions justified the observation with the hydroxyl groups of silica,which suppressed the adsorption density of the nonionic surfactant [54].

Fig.7.Effect of NaCl concentration at the adsorption at initial solution concentration of 5 wt%.
At 5 wt%,the effect of temperature was studied.The adsorption trend shoed noticeable reaction of the adsorption rate.Technically,Fig.8 depicted the difference in reduction between the samples.When the temperature reached 55°C,the adsorption was minimized by 76%,56%,and 59% for fenugreek,sugar beet leaves and chickpeas.The adsorption mechanism as function of temperature show that the process at lower temperature allowed the functional group to be attached and restricted to the surface while the opposite happened at higher temperature.Therefore,the reduction variation is attributed to the effect on temperature on the micelle size,shape and tendency to aggregation and the associated active functional group as confirmed earlier by the FTIR.Similarly,the literature reported this observation for saponin obtained from different sources and for the same source with different extraction procedures [55].

Fig.8.Effect of temperature at the adsorption at initial solution concentration of 5 wt%.

Table 1 Thermodynamic properties of natural surfactant adsorption onto quartz.
It is crucial to identify the adsorption process thermodynamic aspect since most chemicals injected into oil reservoirs are expected to change phase behaviour.Therefore,the Gibbs energy(ΔG°) was used as indication for adsorption stability and changes[56].ΔG°was calculated using Eq (6).
where R is the gas constant with a value of 8.314 J?mol-1?K-1,T is the absolute temperature in kelvins and Ka is the thermodynamic equilibrium constant.
The calculation of Gibbs free energy indicated a negative this indicates that the adsorption process is spontaneous and thermodynamically favorable.
For the changes in the enthalpy ΔH°and the changes in the entropy ΔS°of the system it can be obtained from plotting lnKa vs 1/T and applying Eq 7
The negative ΔH°indicates an exothermic adsorption process.The exothermic reaction is opposing the aggregation and forming the monolayer at elevated temperatures.The negative ΔS°value reflects the reduction of randomness at the solid-solution interface during adsorption.Since both of the signs were found negative,it confirms that the process is spontaneous at low temperatures.Several research on the adsorption of surfactants highlighted the possible interaction and degradation of the nonionic surfactant at higher temperatures[8,28,57].
3.4.Adsorption isotherm model
3.4.1.Langmuir adsorption
The Langmuir adsorption isotherm adopted in the study aims to describe the equilibrium between saponin extraction and quartzsand.The adsorption on the quartz sample could be fitted to Langmuir if the saponin is adsorbed as a monolayer.The extracted saponin fitted to the model,as seen in Fig.9 (see Table 1).

Fig.9.Langmuir isotherm.
From the finding,it is clear that all samples fitted decently to the Langmuir.All aqueous-solid systems have high adsorption capacity.The sugar beet leaves-saponin has the highest adsorption capacity,while the lowest is in the saponin-chickpeas.In general,the results are well fitted to Langmuir isotherm because the correlation coefficient (R2) and the adjusted correlation coefficient (adj-R2) aredescribing the data up to 90%,as seen in Table 2.The Langmuir KLconstant's values are related to the affinity of the ions to the adsorption sites.The high values ofKLimply a greater affinity of the ions studied towards the adsorbent.TheKLestimated has low values.This implies that the adsorbed layer is more to be caused by the long-chain attraction to the surface by the hydrophobic bond,which is,in this case,is the sugar.These beliefs to be typical for nonionic surfactants [51].However,the expected ion bonding on the quartz surface is weak and practically because of the silanol surface and the hydroxyl group[58-60].So,the samples'hydroxyl group alters the quartz surfaces and raises the ion-reactive adsorption sites,especially for silanols,which could be evident at the saponin-chickpeas.On the controversial side,a previous finding explained that the sorption of nonionic surfactant molecules on silica surfaces initially starts with hydrogen bonding of the hydrophilic moieties of the surfactant molecules and the silica surface.Despite the irregularity in explaining the nonionic surfactants'path,the natural nonionic surfactant is relatively complex due to the impurities and the compositional structure.
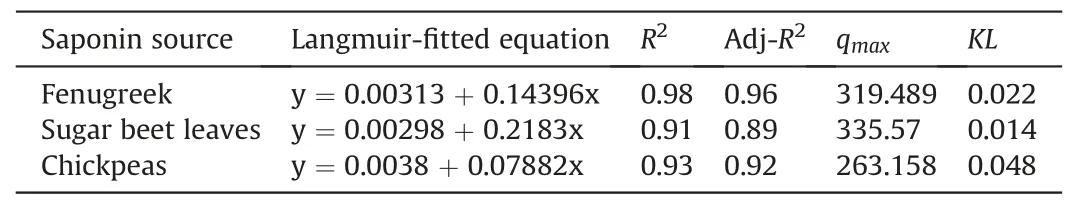
Table 2 Langmuir fitted equation.
3.4.2.Frendluich isotherm
Frendluich isotherm's approximation is describing the physicalchemical process that involves the adsorption in a heterogeneous surface that contains rough surface or micropores.The samples were fitted to the semiempirical Freundlich equation in the linear form and presented in Fig.10.The fitting equation constants is as described in Table 3.From the result,applying the Frendluich Isotherm is helpful in demystifying a different approach for the extraction.The results show that the regression coefficient is average for chickpeas and sugar beet leaves.The average correlation coefficient indicates that the adsorption is not taking place on a heterogeneous system.Interestingly,for the fenugreek,theR2is showing 90% adaptability to the equation.

Fig.10.Frendluich isotherm.
Despite the equation fitting,the Frendluich coefficient provides important information.Considering that the highestKfis in chickpeas samples which confirms that the adsorption capacity in the chickpeas is significant.The slope 1/nis a description for the chemosorption process that take place on heterogeneous surfaces.The1/nis only less than 0.5 at chickpeas saponin which means that the chemosorption process is most likely to occur on different sites on the quartz.This case is unlikely to be valid for the fenugreek orthe sugar beet leaves samples.The value 1/nsignifies that the adsorption was uniform at the quartz surface and more likely to be homogeneous.For nonionic surfactants,similar results were obtained by Ahmadi and Shadizadeh.The variation of the interaction between the quartz surface and the saponin can be explained by the role of hydrophilic tail length and internal linkage [61,62].
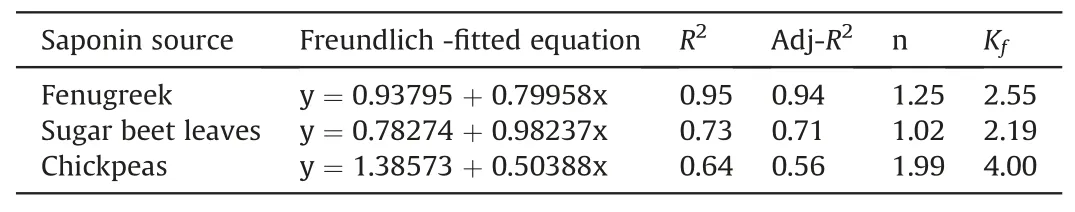
Table 3 Freundlich fitted Equation.
3.4.3.Halsey isotherm
Halsey isotherm deals with multilayer adsorption on heterogeneous surfaces.Therefore,the Halsey model was included to identify if the adsorption leans toward this multilayer heterogeneity system.The results are depicted in Fig.11 indicate that theequilibrium is relatively in good agreement.The linear fitting of the data is somehow has a high value of regression coefficient as seen in Table 4.

Fig.11.Halsey isotherm.
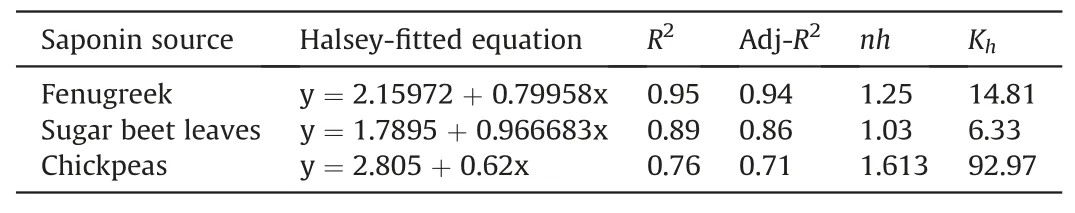
Table 4 Halsey fitted equation.
As the adsorption isotherms described the equilibrium relationship between the adsorbate and the adsorbent,the isotherms showed good agreement to the Langmuir fitting.The Langmuir isotherm linear regression is higher in describing the fenugreek samples than the sugar beet leaves and chickpeas.The remarkable finding is that for sugar beet leaves heterogeneous model seems to be significantly valid by Frendluich and Halsey isotherms.This,in fact,is related to the extensive extraction process.Applying the adsorption isotherm model confirms that the nonionic surfactant has a high affinity to adsorption on the quartz,affecting its application in a sandstone reservoir.The expected concentration losses will affect the solo injection of the natural product.
4.Conclusions
Focusing on finding cheap surfactants resulted in dragging the attention to the natural extracted chemicals and their utilization for CEOR.The evidence underpinning the plants containing saponin was sound.Thus,the study focused on the extraction process and the adsorption on the rocks.The investigation finding could encapsulate the following:
(1) This study shows that the raw material contains moderate levels of saponins,which can be used.
(2) The extracted saponin has different characteristics due to the extraction process,with solid evidence of triterpenoid domination in all the samples.
(3) The Uv-vis spectrometer is a useful technique for determining micellization.The aggregation formed depended on the extraction process.The critical micelle concentration was at a close range of 4-5.5 wt%.
(4) The adsorption quantity of the extraction on quartz and was significantly high.The highest adsorption was obtained by sugar beet leaves which is 192 g/kg.It is more than 25%and 37% of the Fenugreek and chickpeas respectively.
(5) The natural surfactant saponin adsorption in the presence of monovalent ion showed a decline in adsorption with increasing the salinity.This is because of the compact configuration of surfactant molecules in high salinity conditions and the compressing of the electrical double layer.
(6) The temperature reduced the adsorption and confirmed the exothermic nature of the process.The variation of adsorption reduction is functionally related to the different in the available active group in each extracted saponin.
(7) Langmuir isotherm suited the natural saponin extraction on the quartz surface for all the raw materials.
(8) The possibility of natural saponin extraction to fit the heterogeneous model is still highly valid,especially for sugar beet leaves.
- Petroleum的其它文章
- Super gas wet and gas wet rock surface: State of the art evaluation through contact angle analysis
- Petroleum system analysis-conjoined 3D-static reservoir modeling in a 3-way and 4-way dip closure setting: Insights into petroleum geology of fluvio-marine deposits at BED-2 Field (Western Desert,Egypt)
- Development and performance evaluation of a high temperature resistant,internal rigid,and external flexible plugging agent for waterbased drilling fluids
- Anti-drilling ability of Ziliujing conglomerate formation in Western Sichuan Basin of China
- Production optimization under waterflooding with long short-term memory and metaheuristic algorithm
- Investigation of replacing tracer flooding analysis by capacitance resistance model to estimate interwell connectivity