
Genomic prediction of yield performance among single-cross maize hybrids using a partial diallel cross design
2023-12-25 09:51PinLuoHouwnWnZhiyonNiRuisiYnFiWnHonjunYonLinZhnZhiqinZhouWiSonMinshunLiJiYnJinnWnZhoonMnDuiZhnJinnHnYonChnRunzZhnLiwiWnMnZhoWnwiGoXioyuChnWnjiLiZhunnHoJunjiFuXuiZhnXinhiLi
The Crop Journal 2023年6期
Pin Luo, Houwn Wn, Zhiyon Ni, Ruisi Yn, Fi Wn, Honjun Yon, Lin Zhn,Zhiqin Zhou, Wi Son, Minshun Li, Ji Yn, Jinn Wn, Zhoon Mn, Dui Zhn,Jinn Hn, Yon Chn, Runz Zhn, Liwi Wn, Mn Zho, Wnwi Go, Xioyu Chn,Wnji Li, Zhunn Ho,*, Junji Fu,*, Xui Zhn*, Xinhi Li,*
a State Key Laboratory of Crop Gene Resources and Breeding, Institute of Crop Sciences, Chinese Academy of Agricultural Sciences, Beijing 100081, China
b International Maize and Wheat Improvement Center (CIMMYT), Texcoco 56237, Mexico
c College of Agronomy, Xinjiang Agricultural University, Urumqi 830091, Xinjiang, China
d College of Agronomy, Northeast Agricultural University, Harbin 150030, Heilongjiang, China
e Institute of Cereal and Oil Crops, Hebei Academy of Agriculture and Forestry Sciences, Shijiazhuang 050035, Hebei, China
f Food Crops Research Institute, Xinjiang Academy of Agricultural Science, Urumqi 830091, Xinjiang, China
g Maize Research Institute of Shandong Academy of Agricultural Sciences, Jinan 250100, Shandong, China
Keywords:Maize Genomic prediction Prediction model Genetic effects Hybrid performance
ABSTRACT Genomic prediction (GP) in plant breeding has the potential to predict and identify the best-performing hybrids based on the genotypes of their parental lines.In a GP experiment, 34 elite inbred lines were selected to make 285 single-cross hybrids in a partial-diallel cross design.These lines represented a mini-core collection of Chinese maize germplasm and comprised 18 inbred lines from the Stiff Stalk heterotic group and 16 inbred lines from the Non-Stiff Stalk heterotic group.The parents were genotyped by sequencing and the 285 hybrids were phenotyped for nine yield and yield-related traits at two locations in the summer sowing area(SUS)and three locations in the spring sowing area(SPS)in the main maizeproducing regions of China.Multiple GP models were employed to assess the accuracy of trait prediction in the hybrids.By ten-fold cross-validation,the prediction accuracies of yield performance of the hybrids estimated by the genomic best linear unbiased prediction (GBLUP) model in SUS and SPS were 0.51 and 0.46, respectively.The prediction accuracies of the remaining yield-related traits estimated with GBLUP ranged from 0.49 to 0.86 and from 0.53 to 0.89 in SUS and SPS,respectively.When additive,dominance,epistasis effects,genotype-by-environment interaction,and multi-trait effects were incorporated into the prediction model, the prediction accuracy of hybrid yield performance was improved.The ratio of training to testing population and size of training population optimal for yield prediction were determined.Multiple prediction models can improve prediction accuracy in hybrid breeding.
1.Introduction
To keep up with population increase,the output of staple cereals including maize (Zea mays L.), rice (Oryza sativa L.), and wheat(Triticum aestivum L.) must double over the next two decades [1].Maize provides food and feedstocks wordwide[2].Maize breeding aims to identify hybrids with high yield potential in multiple environments.Such trials employ partial-diallel designs featuring cross-mating between heterotic groups, to identify the best hybrids among a few elite breeding lines.They also permit accurately estimating the general and specific combining abilities(GCA and SCA) of the parental lines.Owing to time and resource constraints, only few lines can be evaluated in such studies.
Genomic prediction (GP) permits increasing the efficiency of multiple-location studies.In GP, the effects of all markers are estimated simultaneously from a training population that has been both phenotyped and genotyped, and then the genomic breeding values of the untested genotyped lines are estimated as the sum of all marker effects [3].Genomic prediction permits early selection before phenotypes of traits are collected.Because the genotypes of hybrids are inferred from the genotypes of their parents rather than being determined by sequencing,GP lowers the cost of hybrid breeding [4,5].In maize, GP has been implemented to predict and select target traits in breeding lines[6,7]and to predict the performance of hybrids [8,9].
The most common maize cultivar is a hybrid, and prediction of its performance is essential [10–12].Hybrid performance is influenced by both additive and non-additive effects, including dominance and all types of epistatic interactions [5,13–15].In hybrid breeding experiments, prediction models incorporating nonadditive effects have been employed extensively [16].Modeling non-additive effects in genomic hybrid prediction presents both advantages [17–21] and drawbacks [5,16,22–25].Adding nonadditive effects into a genomic best linear unbiased prediction(GBLUP)model did not improve plant height in a maize F2:3population, but did increase yield [21].For predicting traits with low heritability, such as yield, prediction accuracy can be improved by joint modeling.Its advantage is that genotype × environment interactions and correlations among traits are appropriately accounted for.This feature increases statistical power and parameter estimate precision, increasing prediction accuracy and reducing the bias of genomic selection[26–29].The best GP models must be identified for each trait and population.
We wished to identify GP models suitable for diverse growing regions based on the two major maize producing regions in China:The Yellow–Huai Valley(summer sowing area,SUS)and Northeast China(spring sowing area,SPS).The objectives of the present study were to: (1) assess the prediction accuracy of GBLUP models for maize hybrid yield and yield-related traits in SUS and SPS;(2)evaluate the prediction accuracy of maize hybrids using various genetic-effects models, genotype × environment interaction model, and multi-trait effects model; and (3) evaluate the prediction accuracy of yield under several ratios of training to testing population (TRN: TST) and population sizes.
2.Materials and methods
2.1.Plant materials, experimental design, and phenotypic data collection
Thirty-four elite inbred lines, representing a mini-core collection of Chinese maize germplasm, were selected to make singlecross hybrids.Among the 34,18 belonged to the Stiff Stalk(SS)heterotic group and the other 16 belonged to the Non-Stiff Stalk(NSS,Sipingtou/Iodent) group.A partial-diallel cross design was applied to generate 285 single-cross hybrids using parental lines from differing groups.Three hybrids: HS06 × HS27, HS12 × HS23, and HS17×HS33,were not made,owing to the differences in flowering times of the parents.
All hybrids were planted in trials during the spring and summer of 2022 in five locations.In each location,all hybrids were planted in two-row plots using an incomplete block design with two replications.The row length was 4.0 m and the row spacing was 0.6 m.Field managements followed best local practices.The two SUS trials were planted in Hebei(HB)and Henan(HN),and the three SPS trials in Heilongjiang (HLJ), Jilin (JL), and Liaoning (LN) (Table S1).In each location, measurements of nine agronomic traits were recorded(Table S2):grain yield(GY),ear weight(EarW),ear length(EarL), ear diameter (EarD), tip length (TipL), kernel row number(RowN), kernel number (KerN), 100-kernel weight (100KW), and shelling percentage (SP).
2.2.Phenotypic data analysis
The lme4 package in R[30]was used to fit a linear mixed model to the nine traits over all trials to provide the following best linear unbiased predictor (BLUP) value:
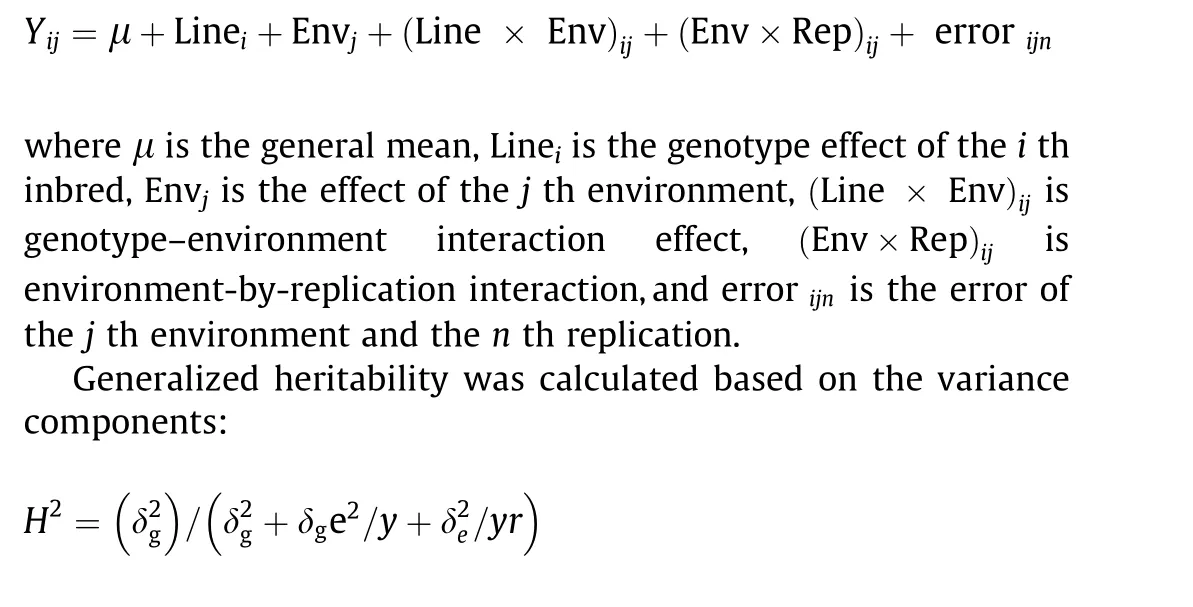
where y and r represent the numbers of growing environments and the number of field replicates per environment,respectively;δ2grepresents genetic variance; δge2represents genotype-by- environment interaction variance; and δ2eis residual variance [31].Correlations and analyses of variance(ANOVA)for phenotypic data were calculated using the cor and aov R functions, respectively.
2.3.Genotyping and genotypic data analysis
The Illumina single-nucleotide polymorphism(SNP) chip(GenoBaits Maize 45K Panel) from Beijing Boruidi Biotechnology was used to genotype the maize inbred lines [32].SNPs that did not meet the following requirements were removed from further analysis:(i)fewer than 10%missing values;(ii)minor-allele frequency(MAF) larger than 5%; and (iii) no more than three heterozygous genotypes.After this filter, 23,692 SNPs remained.Chromosomal locations of SNPs were established using the B73 reference genome(B73 RefGen_v4).Using TASSEL [33] version 5, the genetic distances among the 34 parental lines were calculated as 1 minus the identity-by-state similarity.Using the prcomp function in R,principal component analysis(PCA)was performed on the parental lines.
2.4.Genomic prediction of the maize hybrid performance
2.4.1.Genomic best linear unbiased prediction (GBLUP)
In a genomic prediction where b includes the genomic relationship matrix, the GBLUP model is the GP model most frequently employed in plant breeding[34].A linear mixed model was fitted:
The fixed-effects design matrix X =1n,the vector of length n corresponds to the general mean β = β0, b = (b1, b2,..., bJ)Tcontains the genotypic effects of J lines,and Z is the incidence matrix design for the random line effects (ZL), where b ~NJ(0,σ2gG), and R =σ2In.
2.4.2.Additive and the non-additive model
Hybrid phenotypes were predicted by estimating the BLUPs for general combining abilities(GCAs)in males and females(GCAfemaleand GCAmale) and specific combining abilities (SCAs) of crosses along with their variance components (σ2u1,σ2u2, and σ2us).This can be expressed with the same model used in the diallel experiment:
y=Xβ+Z1u1+Z2u2+Z3us+ε
The mixed-model equations for this model are:
where β is the vector of fixed effects; u1, u2, and usare the respective BLUPs for GCAfemale, GCAmale, and SCA effects; X and Z s are incidence matrices for fixed and random effects, respectively; R is a matrix of residuals (here Iσ2e); and G-11, G-12, and G-13are the inverses of the variance–covariance matrices of random effects.The models were tested considering additive (A) (u1, u2, genomic relationship matrix as additive effects) and non-additive (us, this kinship matrix simulates dominance (D) + epistatic (E) effects),which were implemented using the R package sommer [35].
2.4.3.Genotype × environment interaction (G × E) model
The G×E model is an expansion of the GBLUP model that incorporates environmental effects, genotypic effects, and genotype × environment interaction effects:

When genomic prediction was performed using the G × E model method, two parameters of TRN:TST ratio and population size, were set at nine and seven levels, respectively.In scenario 1, TRN: TST ratio was set to 1:9, 1:7, 1:5, 1:3, 1:1, 3:1, 5:1, 7:1,or 9:1.In scenario 2, the population size was set to 20, 60, 100,140, 180, 220, or 285.
2.4.4.Bayesian genomic multi-trait linear regression model (multitrait model)
For the multi-trait (MT) model, a multivariate Bayesian Gaussian model with an unstructured variance–covariance matrix was employed [36].The MT model was

2.5.Cross-validation scheme and evaluation metrics
2.5.1.Cross-validation scheme
A 10-fold cross-validation scheme was implemented and repeated 100 times to compare prediction performances.The dataset was divided into ten disjoint genotype subsets, one of which was left out for validation and the other nine of which served as the training population for estimating model parameters and predicting the genotypes in the validation population.
2.5.2.Evaluation metrics
To evaluate the prediction accuracy of the G × E model, four evaluation indicators were added to the Pearson’s correlation coefficient: the Kendall rank correlation coefficient (KCC), Spearman rank correlation coefficient(SCC),squared R coefficient of determination (R2), and mean squared error (MSE).
Pearson’s correlation coefficient (PCC, r, R):

3.Results
3.1.Phenotypic data
All nine traits showed broad phenotypic variation among environments (Fig.1).GY was significantly higher in SPS than in SUS,especially in LN, the location with the highest GY of 6.27 kg per plot, and in HN with the lowest GY of 2.95 kg per plot.The ear traits in SPS were significantly different from those in SUS,but TipL was not significant in the five locations.
The heritabilities across the nine traits ranged from 0.46 to 0.86 in SUS and from 0.53 to 0.82 in SPS (Table 1).The heritabilities of yield in SUS and SPS were 0.64 and 0.53, respectively.Of the nine traits, EarL, EarD, TipL, RowN, and 100KW showed moderate to high heritabilities.The heritabilities of SP(0.46 and 0.56)were relatively low.
For all traits, genotype variance was greater than genotype × environment interaction variance.By combining phenotypic data from all environments in SUS and SPS, the Pearson’s correlations between traits were calculated using the BLUP values(Fig.2).GY and EarW were significantly correlated in SUS and SPS(r=0.96 and 0.94,respectively).GY and RowN were not correlated(r=-0.01 and-0.09,respectively).RowN and 100KW were significantly negatively correlated (r = -0.52) in both SUS and SPS.Correlations between the same traits in differing environments were all positive, with a range of coefficients from 0.09 to 0.67(Fig.S1).These results confirm the high stability of these phenotypic data, reflecting the accuracy of phenotypes collected.
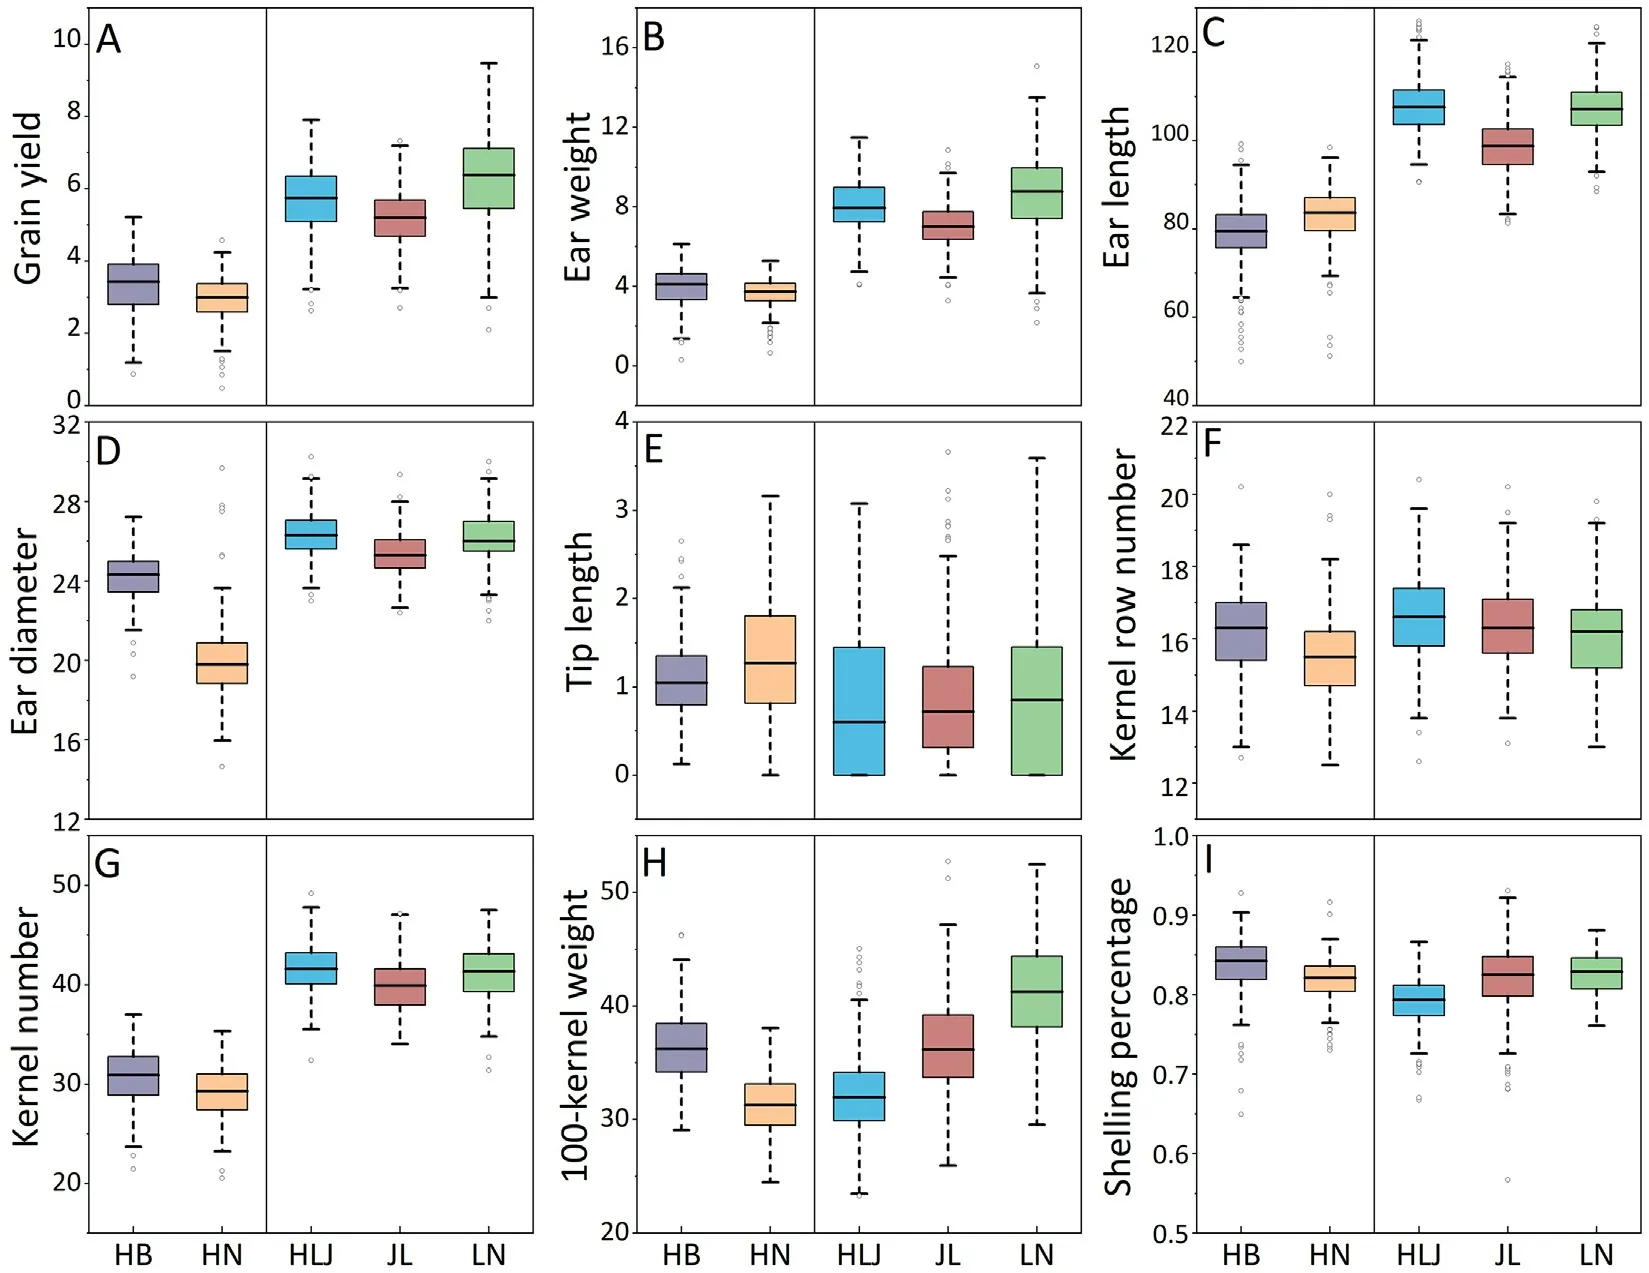
Fig.1.Phenotypic distributions of the nine traits (A-I) evaluated in five locations.For each box, the upper and lower boundaries represent the 25th and 75th percentiles,respectively.The middle horizontal lines represent the median.Whiskers represent 1.5×the interquartile range.The dots beyond the whiskers represent outliers.HB,Hebei;HN, Henan; HLJ, Heilongjiang; JL, Jilin; LN, Liaoning.

Table 1 Analysis of variance (ANOVA) and estimated heritabilities of nine traits in SUS and SPS.
3.2.SNP marker data and genetic relationships
The distribution map of SNP density in each chromosome is shown in Fig.3A.The number of SNPs per chromosome ranged from 1744 on chromosome 10 to 3551 on chromosome 1.The mean heterozygosity rate after filtering across all SNPs was 2.24%and the mean missing rate was 1.32%.The mean heterozygosity rate across all the inbred lines in the SS group was 2.22% and that in the NSS group was 2.26%.The mean heterozygosity rate across all the hybrids formed between the SS and NSS inbred lines was 55.48%.The mean MAF after filtering across all SNPs was 0.19.The mean genetic distance across all the inbred lines calculated using these SNPs was 0.38.
Genetic relationships between the genotyped materials are illustrated in Fig.3.The values of the first two principal components were 16.2%and 12.2%.Two groups appeared in the PCA plot,and lines from the same heterotic group were clustered,suggesting that the lines adequately represented the genetic diversity of their heterotic groups.
3.3.Prediction accuracy of nine traits using the GBLUP model

Fig.2.Scatter plot matrix with Pearson correlations traits using best linear unbiased predictions (BLUPs) and combining the summer maize area, SUS (A), and the spring maize area, SPS(B).GY,grain yield;EarW,ear weight;EarL,ear length;EarD,ear diameter;TipL,tip length;RowN,ear row number;KerN,kernel rows;100KW,100-kernel weight; SP, shelling percentage.

Fig.3.SNP density distribution map using 23,692 SNPs (A) of 34 parental inbred lines, and heat map of the kinship matrix (B), and genetic relationships illustrated with a principal components analysis (PCA) plot (C).
Prediction accuracies of the traits are shown in Fig.4.The prediction accuracies of GY using the GBLUP model were 0.51 and 0.46 in SUS and SPS,respectively.For the remaining yield-related traits,the GBLUP prediction accuracies ranged from 0.49 to 0.86 and from 0.53 to 0.89 in SUS and SPS.The prediction accuracies of all target traits were consistent with their heritabilities.The prediction accuracies of seven traits were higher in SPS than in SUS,but prediction accuracies of GY and 100KW in SUS were slightly higher than those in SPS.The prediction accuracies by environment are presented in Table S3.The prediction accuracy obtained using the phenotypes of a single environment was significantly lower than that from fitting multiple environments.
3.4.Prediction accuracies estimated from the prediction model considering multiple genetic effects
The accuracies of nine traits from the GP model considering additive effects (A) in the 10-fold cross-validation scheme was showed in Fig.4C.The mean prediction accuracies across all nine traits ranged from 0.49 to 0.87.Compared to GBLUP,the prediction accuracy based on the A model was improved for each trait.The accuracy of the GBLUP model predicting SPS-GY was 0.46,whereas the prediction accuracy of SPS-GY based on the A model was 0.50.However, the prediction accuracies of traits with high heritability did not change significantly.
The model was extended based on the A model to include nonadditive effects, ADE (additive + dominant + epistatic effects), the accuracies of nine traits from the ADE model in the 10-fold cross-validation scheme were showed in Fig.4D.The prediction accuracy of SUS-GY from the ADE model was 0.63, which was 0.17 and 0.12 higher than that from the GBLUP and A model,respectively.The prediction accuracy of SPS-GY from the ADE model was 0.42.The accuracies for the other traits based on the ADE model (0.49–0.91) were not significantly improved.Geneticeffect models differed only marginally from GBLUP with respect to the predictive accuracy for the traits with high heritabilities.The prediction accuracy of the genetic-effect model in a single environment was generally comparable to that of the GBLUP model(Table S3).
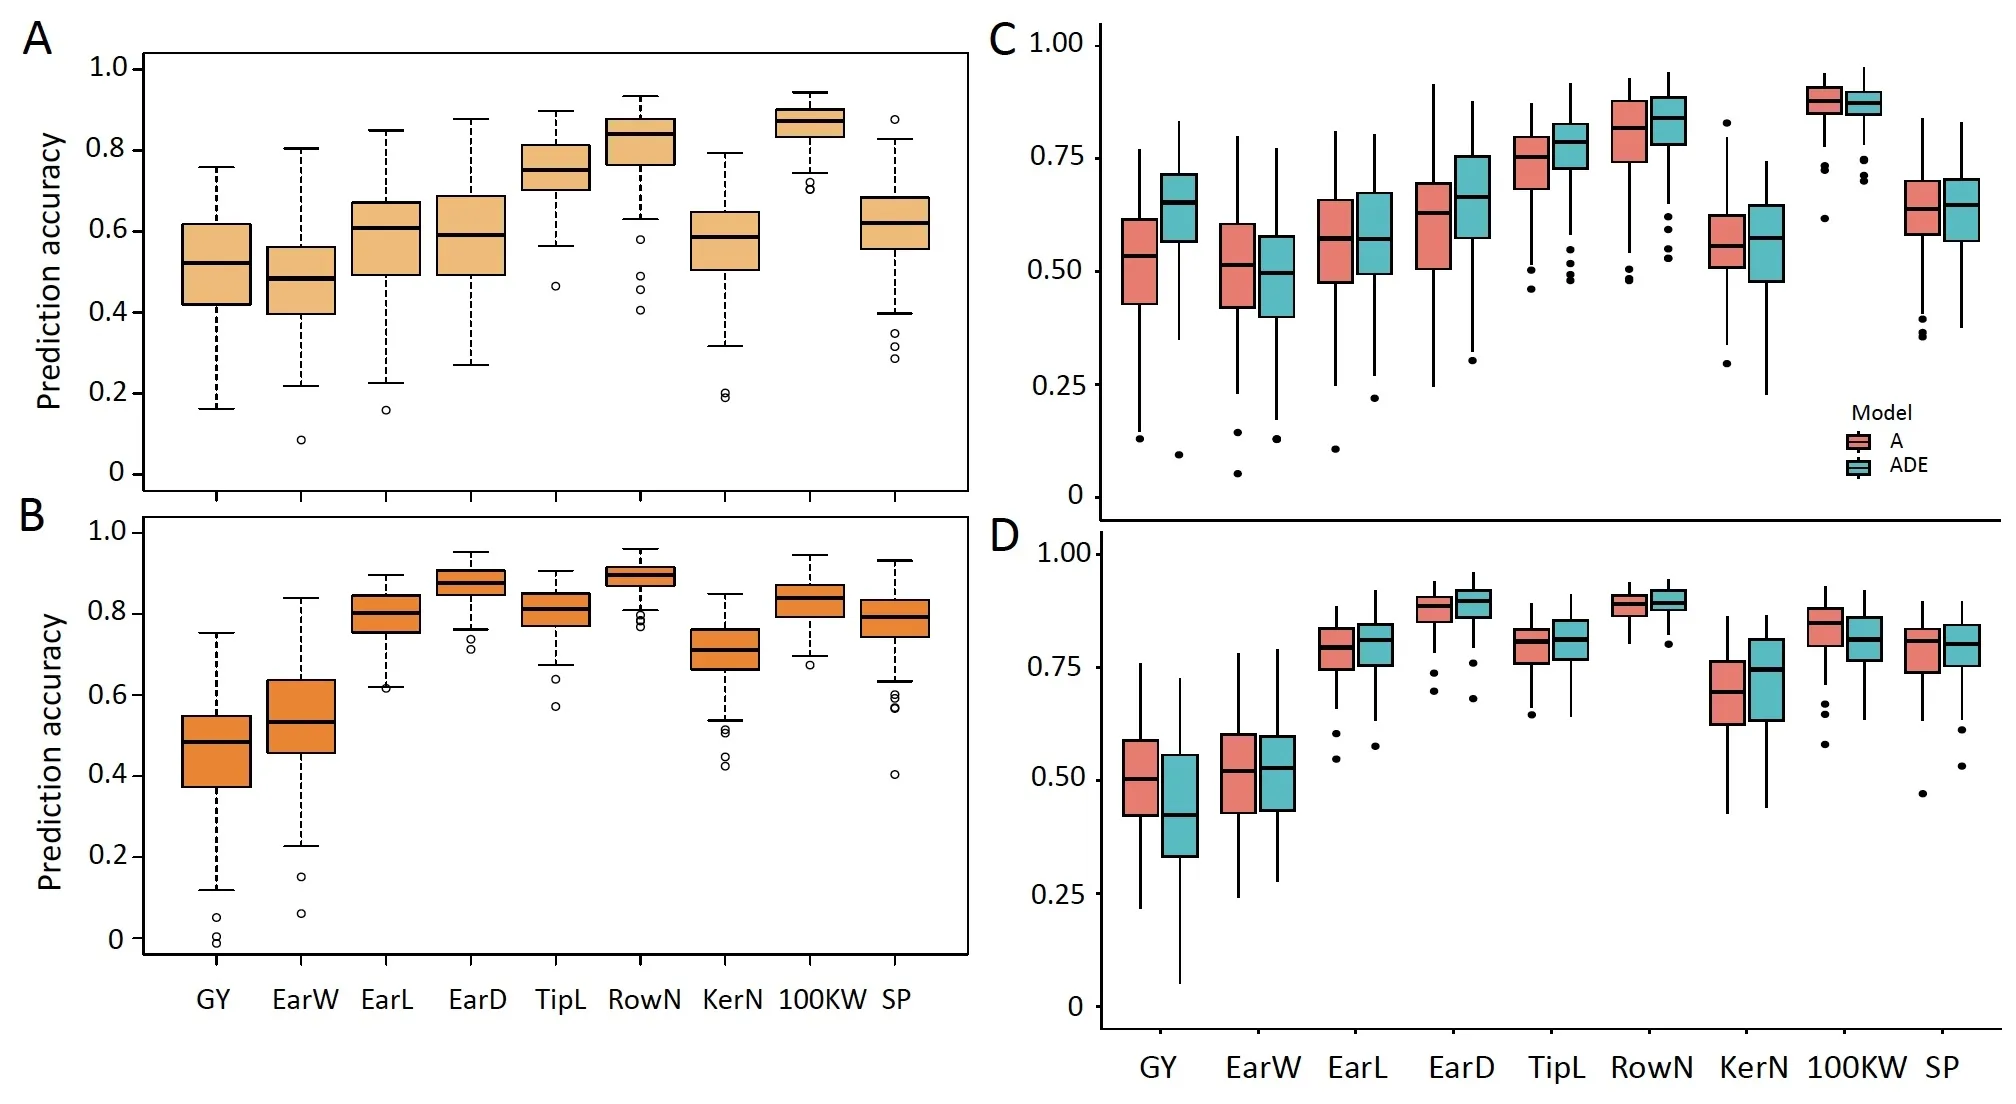
Fig.4.Prediction accuracies of nine traits of the hybrids,estimated with the GBLUP model and prediction models considering multiple genetic effects(A,ADE)in SUS(A and C) and SPS (B and D).
3.5.G × E and multi-trait prediction models in the hybrid population
To exploit correlation information available from other environments and traits, the prediction accuracy of hybrids using the interaction effect model of genotype and environments was considered, and the multi-trait prediction model was used to predict the hybrid performance of nine traits (Fig.5A, B).In the G × E model, the prediction accuracies of across all nine traits in SUS and SPS ranged from 0.52 to 0.83 and 0.48 to 0.83, respectively.The prediction accuracies of GY in SUS and SPS were 0.57 and 0.55, respectively, which were greater than those estimated from the GBLUP and genetic effect models(A,ADE).The prediction accuracies of two traits with high heritabilities, KerN and TipL,decreased in the G × E model, and the prediction accuracies of these two traits in the G × E model were respectively only 0.55–0.57 and 0.63–0.73.
Above results also appeared in the multi-trait model,which did improve the prediction accuracy of other traits(Fig.5A,B).The prediction accuracy of GY in the multi-trait model was higher than that from the GBLUP (0.53) and A models (0.54).The G × E model outperformed the other four models for the prediction accuracy of GY(Figs.4,5).The multi-trait model was also used to evaluate the prediction accuracy of nine traits in a single environment.The prediction accuracy was similar to those of the GBLUP, A, and ADE models (Table S3).
3.6.Effect of TRN:TST ratio and population size on prediction accuracy
Based on the superiority of the G×E model in predicting yield,the accuracy of yield prediction under varying TRN:TST ratios and population sizes were evaluated.In scenario 1(Fig.5C,D),population size was constant and the TRN population size increased from 28 to 257 over nine ratios of TRN and TST samples.The ratio 1:1 appeared to be a turning point at which the precision and stability of both methods began to increase, indicating that the optimum size of TRN was 50% of the total number of populations used.In scenario 2(Fig.5E,F),TRN:TST of 1:1 was constant and population size decreased from 285 to 20.With the decrease in population size, the prediction accuracy dropped from 0.37 to 0.08 (SUS) and from 0.38 to -0.11 (SPS) on average, suggesting that a large TRN population size is required for GP of maize hybrid yield.
3.7.Analysis of evaluation metrics
In scenario 1 (Table 2), TRN:TST of 1:1 seemed to be a turning point for the evaluation of the four indicators PCC, KCC, SCC, and R2, after which a large change occurred.In scenario 2, when the population size was 220, these four indicators were stable.Given that the MSE index is an evaluation of the applicability of the model, this index does not change much under changing conditions.However, the MSE showed that the G × E model was more suitable for the prediction in SUS (Fig.5A, B).
4.Discussion
4.1.Implications of GP for hybrid maize breeding based on two divergent heterotic groups, SS and NSS
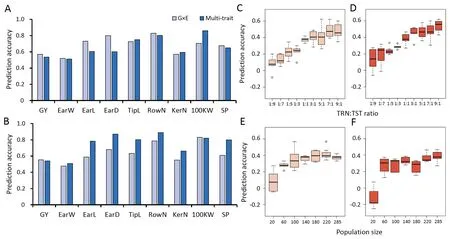
Fig.5.Prediction accuracies of nine traits of the hybrids estimated with the model of G×E and multiple traits and prediction accuracy of yield using G×E model in multiple scenarios in SUS and SPS.Prediction accuracies of nine traits of the hybrids estimated with the model of G×E and multiple traits in SUS(A)and SPS(B).The population size was 285, the prediction accuracy of the G × E model was compared for nine settings of TRN:TST ratio in SUS (C) and SPS (D).The TRN:TST ratio was 1:1, the prediction accuracy of the G × E model was compared for six settings of population size in SUS (E) and SPS (F).
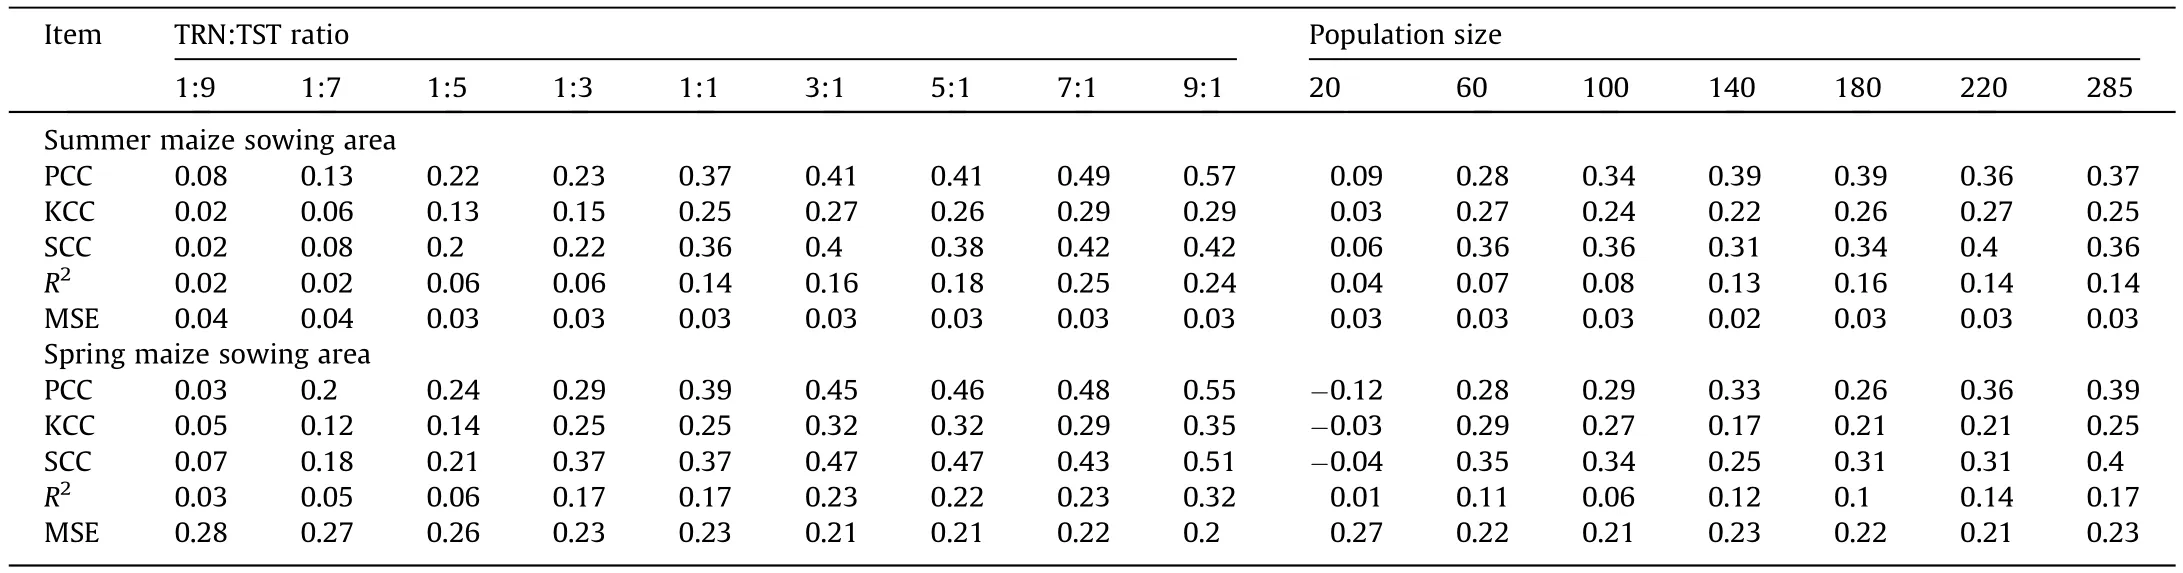
Table 2 Comparison of evaluation metrics for prediction accuracy of nine TRN:TST ratio designs and seven population sizes.
Genomic selection(GS)has been shown to be a promising genomic tool in various fields, since Meuwissen [3] proposed the concept in 2001.In recent years, GP has been intensively evaluated in maize breeding programs[37–41].The adoption of GS breeding,however, faces challenges in increasing the predictive power of complex traits.Theorical and empirical findings[42,43]imply that the accuracy of GP depends mostly on two factors:the accuracy of estimates of SNP effects and the amount of genetic variance at causal variants explained by SNPs in linkage disequilibrium (LD) with these causal variants.Hybrid maize breeding benefits from genetically distinct and complementary heterotic groups [44,45].This has been shown based on quantitative genetic theory[46]but also empirically[47].Our study was based on two genetically divergent heterotic groups,SS and NSS (Fig.3C),which were used for hybrid maize breeding in SUS and SPS.We evaluated the potential and limits of GP of the hybrid performance for this heterotic pattern in a partial diallel cross design based on genotypic and phenotypic data.
The potential of GP for hybrid maize breeding was previously demonstrated in predicting F1hybrids between recombinant inbred lines [48] or doubled haploid lines [49] produced from biparental populations.A recent study [50] demonstrated the ability of GP to identify superior single-cross combinations between two heterotic populations.Our results were similar to these and substantiated the ability of GP to identify excellent single-cross combinations.The prediction accuracy of hybrid yield in the partial-diallel hybrid design was higher than in a previous study [51].Our findings will serve as a basis for continuing to increase training population size and can accumulate years and multiple partial design breeding data to predict the performance of untested hybrid combinations, saving costs, shortening the cycle, and increasing the efficiency of breeding.
4.2.Variance of phenotypic data influences prediction accuracy
GBLUP constructs the kinship G matrix using DNA marker information and calculates the breeding value of GBLUP, one of the commonly used prediction models, for individuals [52].The prediction accuracy of GBLUP for traits with high heritability was as expected, but the prediction accuracy of traits with low heritability, such as GY and SP, was not satisfactory.When GBLUP was used to predict the same trait in SUS and SPS, the prediction accuracy varied with conditions.Combined with our phenotypic ANOVA results, the prediction accuracy varied with the variance of the trait.The phenotypic variance of SUS was generally smaller than that of SPS,and under the GBLUP model,the prediction accuracy of SPS was higher than that of SUS.The findings that the prediction accuracy of SUS-GY was higher than that of SPS-GY and that the phenotypic variance of SUS-GY was higher than that of SPS-GY show the extent to which the variance affects prediction accuracy.The prediction accuracy of SPS-TipL using the GBLUP model was 0.81, while the prediction accuracy of SPS-TipL based on the G × E model was 0.63.The interaction variance of 0.09 between genotype and environment in SPS-TipL indicates that G × E interaction variance also affects the prediction accuracy of the G × E model.
4.3.Modeling of non-additive effects improves predictive accuracy of traits
Previous studies [53,54] have shown that simulating genetic effects in maize prediction, such as dominance and epistasis, may improve prediction accuracy, reducing breeding costs and achieving genetic gains.We found that non-additive effect models increased prediction accuracy, except for SUS-EW, SPS-GY, and SPS-100KW.Studies in hybrid wheat[17],rapeseed(Brassica napus L.)[20],and maize[16,48]also showed that the non-additive effect model improved prediction accuracy,in contrast to the findings[5]for GP in rice hybrid performance.The prediction accuracies of the non-additive model for SUS-EW, SPS-GY, and SPS-100KW were lower than those of the additive model.This disparity may be due to the limited information provided by the non-additive variance, and increased noise of the prediction models, leading to decreased prediction accuracy.Thus, prediction accuracy can be improved by inclusion of non-additive effects in the model.
4.4.Value of extending the prediction model
Multi-trait models could be useful in establishing better genomic selection strategies when the objective is to anticipate challenging or expensive qualities that are connected with cheaply evaluated secondary traits.A multi-trait model could improve the prediction performance for low-heritability characters when there is some correlation between them and high-heritability traits[55–57].Adding the interaction effect of genotype and environment can also improve prediction accuracy.Our prediction accuracy was improved, especially for yield by expanding the model and adding multiple traits and G × E effects.Although the multitrait approach has evident advantages,larger data sets and greater computational power are needed because there are more factors that need to be estimated (such as genetic and error covariances),which could reduce the precision of genomic prediction [53,58].When these techniques are used to increase the accuracy of genomic prediction, additional elements such as genetic correlation,heritability, training population composition, and quantity of data sets should be taken into account.Some of our results have similar problems.The prediction accuracy of SPS-EarL and SPS-TipL using the G× E model was lower than that of GBLUP.However, the prediction accuracy of low-heritability traits was improved by expanding the model.
CRediT authorship contribution statement
Ping Luo:Methodology, Software, Investigation, Writingoriginal draft preparation, Writing-review and editing.Xinhai Li:Conceptualization, Methodology, Writing-review and editing, Project administration.Zhuanfang Hao:Conceptualization, Methodology, Writing-review and editing, Project administration.Xuecai Zhang:Conceptualization, Methodology, Writing-original draft preparation,Writing-review and editing.Junjie Fu:Conceptualization, Methodology, Writing-original draft preparation, Writingreview and editing, Software.Houwen Wang:Investigation,Methodology, Writing-original draft preparation.Zhiyong Ni:Writing-original draft preparation, Methodology.Ruisi Yang, Fei Wang,Hongjun Yong,Lin Zhang,Wei Song,Jie Yang,Yong Chen,Liwei Wang, Runze Zhang, Xiaoyu Chen, Meng Zhao, Wenwei Gao and Wenjie Li:Investigation.Mingshun Li, Jianfeng Weng,Zhiqiang Zhou, Degui Zhang, Jienan Han, Zhaodong Meng:Methodology, Writing-review and editing.All authors have read and agreed to the published version of the manuscript.
Declaration of competing interest
The authors declare that they have no known competing financial interests or personal relationships that could have appeared to influence the work reported in this paper.
Acknowledgments
This work was supported by the National Natural Science Foundation of China (32272049, 32261143757), Sustainable Development International Cooperation Program from Bill & Melinda Gates Foundation (2022YFAG1002), the National Key Research and Development Program of China (2020YFE0202300), the Agricultural Science & Technology Innovation Program (CAASZDRW202109), and the China Scholarship Council.The funding agencies were not involved in the design of the study; the collection, analysis, and interpretation of the data; or preparation of the manuscript.
Appendix A.Supplementary data
Supplementary data for this article can be found online at https://doi.org/10.1016/j.cj.2023.09.009.

- The Crop Journal的其它文章
- OsSPL10 controls trichome development by interacting with OsWOX3B at both transcription and protein levels in rice (Oryza sativa L.)
- Ectopic expression of OsNF-YA8, an endosperm-specific nuclear factor Y transcription-factor gene, causes vegetative and reproductive development defects in rice
- Mechanisms of autophagy function and regulation in plant growth,development, and response to abiotic stress
- ZmDRR206 functions in maintaining cell wall integrity during maize seedling growth and defense response to external stresses
- The plasmodesmata-associated β-1,3-glucanase gene GhPdBG regulates fiber development in cotton
- The MabHLH11 transcription factor interacting with MaMYB4 acts additively in increasing plant scopolin biosynthesis