
Spatial and spectral measurement of laser-driven protons through radioactivation
2024-01-10 10:53YinRenShouXueZhiWuGwangEunAhnSeungYeonKimSeongHoonKim
Nuclear Science and Techniques 2023年12期
Yin-Ren Shou · Xue-Zhi Wu,2 · Gwang-Eun Ahn · Seung Yeon Kim · Seong Hoon Kim ·
Hwang Woon Lee1 · Jin Woo Yoon1,3 · Jae Hee Sung1,3 · Seong Ku Lee1,3 · Xue-Qing Yan2 · Il Woo Choi1,3 ·Chang Hee Nam1,4
Abstract The simultaneous measurement of the spatial profile and spectrum of laser-accelerated protons is important for further optimization of the beam qualities and applications.We report a detailed study regarding the underlying physics and regular procedure of such a measurement through the radioactivation of a stack composed of aluminum, copper, and CR-39 plates as well as radiochromic films (RCFs).After being radioactivated, the copper plates are placed on imaging plates (IPs) to detect the positrons emitted by the reaction products through contact imaging.The spectrum and energy-dependent spatial profile of the protons are then obtained from the IPs and confirmed by the measured ones from the RCFs and CR-39 plates.We also discuss the detection range, influence of electrons, radiation safety, and spatial resolution of this measurement.Finally,insights regarding the extension of the current method to online measurements and dynamic proton imaging are also provided.
Keywords Laser-driven proton acceleration · Proton-induced nuclear reaction · Radioactivation measurement · Contact imaging
1 Introduction
Laser-accelerated proton beams, with the advantages of having a picosecond-scale duration, ultrahigh brightness,and micrometer source size [1], are promising for various applications [2] including transient dynamics detection [3],bi-modal radiographic imaging [4], and FLASH radiotherapy [5, 6].For instance, laser-accelerated protons have been directly applied in FLASH irradiation on cells with an ultrahigh dose rate of 109Gy/s [7].In addition, manipulation of the proton beam using a tunable active plasma lens [8] or a pulsed two-solenoid beamline [9] has been demonstrated,indicating the feasibility of delivering tailored dose distributions.A more accurate control of protons with an imagerelaying beam line has been reported as well, demonstrating a stable production of proton beams with a tunable energy and energy spread <1% [10].Understanding the underlying physics of laser-driven proton acceleration and realizing a better manipulation of accelerated protons according to requirements entail the spatial and spectral measurement of laser-accelerated protons.This is challenging for conventional diagnostic tools [11] owing to the ultrashort beam duration, simultaneous generation of multi-species ions [12]and X-rays [13–15] as well as hostile environments such as the occurrence of intense electromagnetic pulses during laser-driven proton acceleration [16, 17].
Several types of detectors have been used to characterize laser-accelerated protons, the most common being the Thomson parabola spectrometer (TPS), which has a high energy resolution and can be utilized online if a microchannel plate (MCP) [18, 19] or a scintillator [20] is applied to record the ion trajectories.However, TPS, as well as another type of real-time detector using the time-of-flight technique [21], cannot obtain the spatial information of protons owing to their significantly small detection angle.A modified design of TPS using a multi-pinhole array instead of a single pinhole can extend the spatial resolution to several different directions [22–24].Additionally, an angular spectrometer using only a magnetic field and replacing the pinhole with a narrow slit [25, 26] or a two-dimensional(2D) pinhole array [27] has been utilized to obtain the 1D or 2D profile of ions, although the capability of distinguishing different ion species is significantly limited.A stack spectrometer has been widely applied to obtain an accurate 2D profile of laser-accelerated protons; however, this is at the expense of the energy resolution.These stacks can consist of scintillator, imaging plate (IP), radiochromic film (RCF),nuclear track detector, and absorption layer.Among these,only the scintillator-based stack can be utilized online with the help of cameras [28].To resolve the proton spectrum from the scintillation signals, various solutions have been demonstrated, including placing absorbers with different thicknesses before a scintillator [29–32], imaging the layer edge of each scintillator in the stack for a 1D spatial measurement [33], and distinguishing the signals from different layers of scintillators through their varying relative angles[34] or central wavelengths [35].The main disadvantage of a scintillator is its relatively low sensitivity and spatial resolution.While IP [36] and RCF [37] can provide a higher resolution, both are sensitive to electrons that intrinsically exist during laser-driven proton acceleration and can induce significant noise.A nuclear track detector, such as the Columbia Resin #39 (CR-39) [38], is insensitive to electrons and has the highest spatial resolution.Hence, the use of CR-39 is regarded as the most robust measurement method, although its low saturation fluence and complex etching process limit its widespread application [39].Another robust method is the radioactivation measurement based on proton-induced nuclear activation in the absorption layers with an activation material, which was also applied in previous experiments[40, 41].
In practice, the radioactivation measurement usually involves two steps.First, nuclei in the absorption layers capture energetic protons and produce isotopes (mainlyβ+emitters); second, the activity of each absorption layer is measured by coincidence detection, gamma-ray spectrometry, or contact imaging.Among these, coincidence detection was first introduced in the field of laser-driven proton acceleration [42, 43].The activity is measured by counting the 511-keV annihilation gamma rays using coincidence detectors; radioactive isotopes are identified by measuring the half-life [44, 45].Improved isotope identification can be achieved by gamma-ray spectrometry, in which nuclides and corresponding reactions are distinguished by the emitted characteristic gamma rays [46].Following the activity measurement, the proton spectrum can be derived considering the cross-section of the activation and the Bragg peak energy of each absorption layer.To further obtain the spatial information of protons, contact imaging (autoradiography) was developed by exposing the activated layers onto IPs [47] and has been demonstrated in several experiments with the spatial and spectral reconstruction of the protons[48, 49].However, in these studies, the signals on the IPs were attributed to gamma rays from the activated layers;a comprehensive study regarding contact imaging has not been reported thus far, which limits its wide application in laser-accelerated proton characterization.
In this study, we provide a detailed discussion regarding the underlying physics and regular procedure of contact imaging for the spatial and spectral measurement of laserdriven protons through radioactivation.A stack composed of aluminum, copper, and CR-39 plates as well as RCFs was designed and radioactivated by protons with a cutoffenergy exceeding 50 MeV driven by a petawatt laser.After being radioactivated, the copper plates were placed on IPs for contact imaging.The energy-dependent spatial profiles of the protons were then directly obtained from the IPs and validated by the measured ones with the RCFs and CR-39 plates.The proton spectrum was also derived based on the nuclear reaction possibility and average response of each copper plate calculated from the Monte Carlo (MC) code FLUKA [50], which sufficiently matched the results measured using RCF and CR-39.The MC simulation indicated that the signals of the IPs were mainly from the positrons,instead of the gamma rays, in activated layers.Furthermore,the detectable proton fluence, the influence of electrons, and the spatial resolution were also discussed, demonstrating the advantage and robustness of this method.Finally, insights regarding the extension of the current method to online measurements and dynamic proton imaging are presented.
2 Experiments
The petawatt laser at the Center for Relativistic Laser Science (CoReLS) was utilized to accelerate the protons and demonstrate a spatial and spectral measurement through radioactivation.A simple schematic of the experimental layout is displayed in Fig.1.A linearly polarized laser pulse was focused onto a 52-nm-thick polymer (F8BT,C35H42N2S ) target at an incident angle of 33?using an f/3.6 off-axis parabolic mirror (OAP).A double plasma mirror system was applied to ensure that the laser contrast was sufficiently high for such ultrathin targets [51].The duration,on-target energy, spot-size in full width at half maximum(FWHM), and energy concentration in FWHM area of the laser were 26 fs, 20 J, 3.2 μm, and 30%, respectively, corresponding to a peak intensity of 3×10²¹W/cm2.Ultrashort protons with an exponentially decaying spectrum and a cutoffenergy exceeding 50 MeV can be accelerated from the rear surface of the target.
A stack was designed as listed in Table 1 and applied in the experiment to measure the spatial profile and spectrum of the accelerated protons.All layers had the same transverse size of 5 cm × 5 cm.The first 0.5-mm-thick aluminum plate was assembled to block visible light and carbon ions below 190 MeV [52]; behind it, ten pieces of RCFs (Gafchromic)were utilized with a 5-MeV energy gap between the Bragg peaks of protons, as shown in the curves of deposited energy in Fig.2.The first four RCFs were HD-V2 type (dynamic range 10–1000 Gy), whereas the last six were EBT-3 type(dynamic range 0.1–20 Gy) considering the relatively low number of the high-energy protons [53].The radioactivation measurement was achieved by four copper plates, of which the last two had a larger thickness owing to the lower proton number in the high energy region.We also inserted five pieces of CR-39 (Track Analysis Systems Ltd.) in the stack to validate the results from the radioactivation measurement.
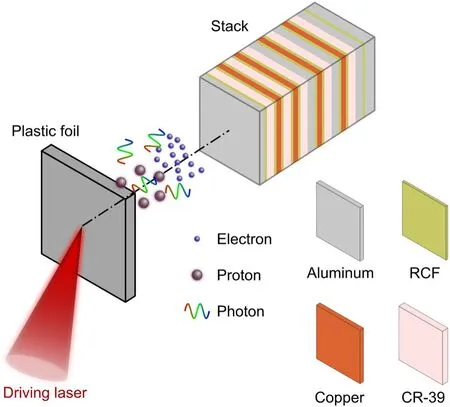
Fig.1 (Color online) Schematic of the experimental layout

Table 1 Composition of the stack used in this study.HD and EBT refer to HD-V2 and EBT3 type RCFs, respectively
During the experiment, an online TPS was first utilized to determine the optimal conditions of the laser and target.Subsequently, the prepared stack, which was installed on a linear stage, was moved in and placed 15 mm from the rear surface of the target to the first layer.After one laser shot, the stack was moved into a small chamber for a quick exchange[54]; the copper plates in the stack were then placed on the surface of a BAS-MS imaging plate (Fujifilm) for exposure.The use of an exchange chamber can reduce the time interval between the end of laser shot and the start of exposure to only 18 min, which is important for the detection of62Cu as this product has a short half-life of 9.672 min.After a 20-min exposure, the IP was quickly sent to a scanner (Amersham Typhoon).During this process, the IP was shielded with an aluminum foil to avoid the influence of visible light.The scan parameters included a resolution of 100 μm, dynamic range ofL=5 , and sensitivity ofS=4000.

Fig.2 (Color online) Deposited energy of each layer in the stack depending on the initial incident proton energy on the stack.A scale factor of 0.05 was applied for the data of the copper plates (solid lines)
To validate the spatial profile and spectrum of protons obtained from the radioactivation method, we also processed the RCF and CR-39 in the stack.After waiting longer than 24 h to ensure the stabilization of the irradiated RCF, we scanned it using a 48-bit color scanner (Epson Perfection V750 Pro) in transmission mode at a resolution of 300 dots per inch (dpi) with no color correction [55].Unexposed RCFs and a black aluminum foil were scanned with the same setting as the reference and the background, respectively.The CR-39 was first etched in a 6.25 N NaOH solution at a constant temperature of 70?C for 4 h to visualize the latent track [56].After etching, the CR-39 was cleaned and scanned using an upright microscope (Olympus BX53M)under a magnification of 25× to record the pits on the front and rear surfaces.Owing to the limit that each frame of the microscope had an imaging area of only 251 μm × 141 μm,thousands of frames were recorded and automatically joined to count the pits.
3 Results
The spatial profile of the laser-accelerated protons, which can provide a better understanding of the acceleration mechanism, can be directly obtained from the scanned IPs after contact imaging by the radioactivated copper plates.Figure 3e–h displays the source data of the IPs corresponding to the four copper plates with Bragg peak energies of approximately 20, 30, 40 and 50 MeV, as shown in Fig.2.The center of the proton beam deflects only several degrees from the normal direction of the target toward the laser propagation direction, and the beam divergence decreases as the proton energyEpincreases whenEp>0.2Ec, whereEcis the cutoffenergy, indicating that the protons were mainly accelerated by target normal sheath acceleration (TNSA) rather than by radiation pressure acceleration (RPA) [11].The spatial profile measured through radioactivation was validated by the results from each RCF placed just behind the copper plate in the stack, as depicted in Fig.3a–d.Apparent noise from the electrons, as shown in the left part of Fig.3b in comparison with Fig.3f, and a structure of protons in the central part reveal the robustness and high dynamic range of the radioactivation method.
The spatial profile from CR-39 sufficiently agrees with that from the radioactivation measurement and RCF, as shown in Fig.3d, h, and i.Here, only the last CR-39 was processed because the others were significantly overexposed owing to the low saturation fluence of approximately 107protons/cm2[39].For a quantitative analysis, an ImageJ [57]script was developed to count the diameters of the etched pits on the front and rear surfaces of CR-39.Corresponding to different etching stages, these pits can be divided into conical (dark circle) and spherical (dark donut with a brighter center) phases [58] according to their profiles.The incident energy of a proton can be deduced from the phases and diameters of the pits after considering the etching temperature and time.Here, we utilized the calibrated relationships between the pit diameter and proton energy for the front [59, 60] and rear surfaces [61] of CR-39.In Fig.3i, the distribution of the pits caused by protons with initial incident energies of approximately 50 MeV is displayed, where both the size and slope of the spatial profile are consistent with those from the IP and RCF at a similar proton energy.

Fig.3 (Color online) Energy-dependent spatial profiles of protons measured through RCF (a–d), radioactivation (e–h), and CR-39 (i).The cross in (a) indicates the normal direction to the rear surface of the target, while the dashed circle corresponds to the full divergence angle of 25?.In the inset of (i), the sketch of a typical proton pit in the spherical phase [58] on the front surface of CR-39 is provided.Only pits with a circularity of larger than 0.92, and inner diameter d between 0.85 μm and 4.90 μm are counted in (i), corresponding to protons whose energies are below 0.7 MeV when reaching the front surface of the last CR-39 [59]
In addition to the energy-dependent spatial profiles, the proton spectrum can be simultaneously generated from the radioactivation measurement.For each copper plate, we can assume a spectral intensitySiat its Bragg peak energyEi; the logarithmic proton spectrum log[S(E)] can be simply obtained by the linear interpolation of log(Si) accompanied with linear extrapolation.Then, the supposed yield of each nuclear reaction productjin theith copper plate is ∫S(E)Pij(E)dE, wherePij(E) is the energy-dependent possibility of the nuclear reaction productjin theith plate.Table 2 lists the main channels of the proton-induced nuclear reactions in copper; the correspondingPijof these products were calculated by FLUKA simulations [50, 62] using the same setup of the proton beam and stack configuration as in the experiment.Considering the cross-section of the reaction and the half-life of the product, the main products are62Cu and63Zn, whosePijare depicted in Fig.4c.Subsequently,we performed another FLUKA simulation by simply placing an activated copper plate on an IP to calculate the mean deposited energy of one decaying nucleus, and further the mean photo-stimulated luminescence (PSL) valueRijusing the calibrated relationship of 0.75 ± 0.11 mPSL/keV [63,64], as displayed in Fig.4b.As a result, the assumed PSL value in theith copper plate is as follows:
Here,ts(te) indicates the time interval between the start (end)of the exposure and the radioactivation, andtjis related to the half-life of the productjastj=T1∕2∕ln 2.Finally, a differential evolution algorithm based on the Python package scikit-opt [65] is utilized to generate the measured proton spectrumS(E) by fitting each assumed PSL value to the measured one through iterations of the values ofSi.
In practice, to obtain the measured PSL value of each plate, we first convert the count value in the source file using the following relationship:
where the spatial resolution inμm unit isRμm= 100, the dynamic range isL=5 , and the sensitivity isS=4000 [66,67].Subsequently, the measured PSLiis obtained, as shown in Fig.4a, by summing all the PSL values in a copper plate,considering the corrections for the background noise and the time fading effect according to previous calibrations [66].For the calculation of the fitted PSLi, it should be noted that the responsesRijof the main products62Cu and63Zn strongly depend on the thickness of the copper plate.Figure 4d shows the final proton spectrum obtained from a least-square fit of PSLito that of the measured one, as displayed in Fig.4a.Here, a comprehensive uncertainty of 30% is used, which is determined by the fluctuation of the scanner sensitivity [67]and the uncertainty in the calibration of IPs [64].
We also calculated the proton spectrum from the ten RCFs using a similar procedure to validate the result from the radioactivation measurement.Here, the total deposited energy TDEiin each RCF is utilized instead of the PSL value.The calculated TDEiis also obtained from anassumed spectrumS(E) based on the spectral intensitySiand the deposited energy curveDias:

Table 2 Main proton-induced nuclear reactions in copper [71].Eth and σm indicate the threshold proton energy and maximum cross-section of the reaction, respectively.T1∕2 is the half-life of the product

Fig.4 (Color online) Proton spectrum unfolded from the radioactivation measurement.(a) Integral PSL value of each exposed IP.The vertical error bars represent the uncertainty of the scanner sensitivity.(b)Response Rij as well as the fluence of the positrons and photons versus the copper plate thickness.(c) Normalized product yield Pij(E) as a function of the initial incident proton energy into the stack.(d) Proton spectra measured with the radioactivation on copper plates,RCF, and CR-39, respectively.The uncertainty of the spectra is indicated by the filled area
whereDi(E) is plotted in Fig.2.For the measured TDEi, we first converted the pixel value (PV) in the red channel of the scanned RCF to the optical density (OD) as follows:
Here, PVunand PVirare the PVs before and after the irradiation of the proton beam, respectively, while PVbgis the background of the scanner generated through scanning a black aluminum plate with the same size as the RCF [55].Then, the measured TDEican be generated from the sum of the deposited energy in each pixel as follows:
wheremris the mass of the sensitive layer with the size of one pixel, which is determined by the scan resolution, andf(OD) is the function between dose and OD value.Considering the scanner model, we utilized thef(OD) of the HD-V2 and EBT-3 from previous calibration studies, [68] and [69,70], respectively.By fitting the calculated TDEito that of the measured one, the proton spectrum was derived as indicated by the dashed line displayed in Fig.4d.The spectra generated from both the radioactivation and RCF sufficiently agree, and the spectrum from the RCF has a finer shape because more pieces of RCFs were used.
The last CR-39 was also processed, and both of the spectral intensities dN∕dEfrom the front and rear surfaces were plotted, as shown in Fig.4d, demonstrating a good consistency with the RCF spectrum.Here, we used the front surface as an example.First, the pits induced by the protons whose energies are below 0.7 MeV when they reach the front surface are counted.The total number is ΔN=2.6×10⁴as shown in Fig.3i.Then, the possibility distributionP(E) of these protons, which is a function of the initial incident proton energyEinto the stack, is calculated by FLUKA simulations.Finally the spectral intensity is dN∕dE=ΔN∕∫P(E)dE.
4 Discussion
To accurately unfold the spectrum of laser-accelerated protons through the radioactivation measurement, the average response of productjin theith copper plateRijis important,which has not been clearly discussed in previous studies[47–49].As indicated in the aforementioned sections, the main contributions during contact imaging on the IP are from the decay of63Zn and62Cu in the radioactivated plate.Both have a 100%β+decay branch [71], which indicates that the sensitive layer in the IP is exposed by the emitted positrons (broad spectrum, 0 -2.2 MeV from63Zn and 0 -2.9 MeV from62Cu), characteristic gamma rays (main lines of 670 keV and 962 keV from63Zn and of 1.17 MeV from62Cu), and gamma rays from the annihilation of positrons (511 keV).Considering that the thickness of the sensitive layer in the BAS-MS IP is only 115 μm [63], the energy deposited by a positron is approximately two orders of magnitude greater than that by a gamma-ray photon [72].Hence,Rijis mainly determined by the number of positrons reaching the sensitive layer.As the copper thickness increases, a larger fraction of positrons is annihilated inside the copper plate, leading to an increase of the photon fluence, as shown in Fig.4b, while theRijdecreases owing to the reduction of the positron fluence for thicker plates.
In our experiment, both the spatial profile and spectrum of protons measured through the radioactivation, RCF, and CR-39 sufficiently agree with one another.Compared to other methods, the radioactivation measurement mainly has the advantages of a high detection range (proton spectral intensity of 107-1012MeV-1) and good robustness to electron noise.CR-39 has a significantly low saturation fluence,rendering it only suitable for measuring the high-energy part of laser-driven protons, as displayed in Fig.4d.For each specific type of RCF, its dose range is less than three orders of magnitude [53] owing to the nonlinear relationship between the OD value and dose [70].Regarding the radioactivation measurement, the IP has a linear response of five orders of magnitude.The dynamic range can be further extended by a repeat of the scan [36], ensuring its ability to simultaneously image the center and edge parts of laseraccelerated proton beams.In the meantime, this imaging is accurate because the radioactivation method is less sensitive to electrons, which are accelerated along with the protons by the laser.These electrons usually propagate along the laser direction with a maximum energy of tens of MeV,which is sufficiently energetic to penetrate a 10-cm depth in water [73].Hence, they can reach the last RCF in the stack and introduce significant noise, as shown in the left part of Fig.5a.The electron noise has a similar strength compared to the proton signal, as depicted in Fig.5c, strongly influencing the measurement of the proton beam profile, which can be worse for a normal incident laser in which the electron and proton overlap.In the result obtained through radioactivation, as displayed in Fig.5b and c, there is no apparent noise from the electrons owing to the small cross-sections of the electron-induced nuclear reactions in the copper plate.Bremsstrahlung gamma rays induced by the electrons may trigger photonuclear reactions, such as63Cu(γ,n)62Cu [74],and cause additional noise, which can be suppressed only by using low-Z materials in the stack because the crosssection of the Bremsstrahlung is proportional toZ2[75].The cascaded nuclear reactions, such as65Cu(p,n)65Zn and63Cu(n,2n)62Cu , will also influence the radioactivation measurement; these effects have been included in the calculation ofPijin the FLUKA simulations.

Fig.5 (Color online) Noise from the electrons and spatial resolution of the radioactivation method.(a) and (b) Distributions of the OD value in EBT-5 and the PSL value in IP-4, respectively, whose central lineouts are plotted in (c).(d) Simulated edge profile on the IP exposed by a 0.3-mm-thick copper plate in FLUKA.A rectangle of size 1 mm × 1.6 mm on the copper plate is radioactivated, while its sharp edge spreads in contact imaging on the IP owing to the scattering of positrons.(e) Corresponding modulation transfer function(MTF) obtained from the Fourier transform of the line spread function, which is calculated by the derivative of the edge profile in (d)[77].The dashed line corresponds to the MTF value of 0.1, while the intersection is marked by a triangle, whose abscissa represents the maximum distinguishable spatial frequency.(f) Simulated spatial resolution versus the thickness of the copper plate
Despite the aforementioned advantages, there are also several concerns regarding the radioactivation measurement,one of which is radiation safety as this method is based on nuclear reaction.Based on the proton spectrum shown in Fig.4d, the yields of63Zn and62Cu in the first copper plate are calculated as 4.6×10⁶and 3.9×10⁶, respectively.By eliminating the short-lived products, we can estimate the corresponding radioactivity 10 min after the laser shot is 3×10³Bq, that is, 0.1 μCi.This radioactivity is lower than that indicated by the standard of Categories-5 radioactive source [76], ensuring the safety of this method.Another concern is its spatial resolution, which is influenced by the scattering of positrons inside the copper plate.We performed a simple FLUKA simulation to investigate how a sharp edge on the copper plate spreads in contact imaging on the IP, as shown in Fig.5d.A quantitative spatial resolution of 2.4 lp/mm, as displayed in Fig.5e, can be calculated from the spread profile by using the edge method [77] for a 0.3-mmthick copper plate.Figure 5f indicates a decrease in the resolution as the plate thickness increases, because a stronger positron scattering occurs in the thicker copper plate.The use of a thinner plate can improve its responseRijand spatial resolution; however, it will reduce the yields of the nuclear reaction products.Hence, we utilized 0.3-mm copper plates for the measurement of the low-energy protons and 0.5-mm plates for the high-energy protons.
Based on the successful demonstration of the spatial and spectral measurements using copper plates in this study, two extensions of the radioactivation method were also investigated, one of which is an online measurement through radioactivation.The current method uses IPs for contact imaging, which must be read by a scanner; this limits the repetition frequency.Real-time imaging can be achieved if a state-of-the-art hybrid semiconductor pixel detector, such as Timepix3 [78] or Mimosa-28 [79] with a spatial resolution of approximately 50 μm, is applied instead of the IP.Simultaneously, the material of the plate should be replaced by elements whose proton-induced reaction product has a halflife of approximately 10 s, because after exposure the plate can be quickly moved to the pixel detector by a linear stage in the vacuum.Aluminum is a promising candidate, whose product from the main reaction channel27Al(p,n)27Si has a half-life of 4.15 s.Another extension is the achievement of dynamic proton imaging through radioactivation.The principle is to use materials with a narrow peak in the curve of the cross-section depending on the proton energy, such as7Li and19F.Hence, the image of each plate corresponds to the signal of the protons in a specific energy range.If a timevarying sample is placed between the proton source and the stack, protons with a higher energy will arrive at the sample ahead of the low-energy protons [80], subsequently triggering nuclear reactions in a deeper layer of the stack.Thus, the variation of images from different layers can reflect the evolution of the sample in a picosecond time scale.Considering material availability and the half-life of the product, Teflon( C2F4) is a suitable candidate, with the main product19Ne having a half-life of 17.26 s from the reaction19F(p,n)19Ne.
5 Conclusion
We demonstrated the simultaneous measurement of the spatial profile and spectrum of laser-accelerated protons through the radioactivation of copper plates, the results of which were sufficiently validated by other methods using RCF and CR-39.The role of positrons, the detection range, influence of electrons, radiation safety, and spatial resolution of this measurement were discussed, revealing the advantages of this method including a high dynamic range and good robustness to electron noise.Two extensions, including an online measurement and dynamic proton imaging, were also proposed to further improve the radioactivation method.
Acknowledgements The authors would like to thank Dr.M.A.Mahmood for the help in unfolding the proton spectrum from the RCF measurement, and Dr.D.Wu for the discussion regarding the protoninduced nuclear reaction.
Author contributions All authors contributed to the study conception and design.Material preparation, data collection and analysis were performed by Yin-Ren Shou, Xue-Zhi Wu and Il Woo Choi.The first draft of the manuscript was written by Yin-Ren Shou.After implementing their comments, all authors approved the final manuscript.
Data availability The data that support the findings of this study are openly available in Science Data Bank at https:// doi.org/ 10.57760/ scien cedb.08641 and https:// cstr.cn/ 31253.11.scien cedb.08641.
Conflict of interest The authors declare that they have no competing interests.
 Nuclear Science and Techniques2023年12期
- Nuclear Science and Techniques的其它文章
- A machine learning approach to TCAD model calibration for MOSFET
- BL02U1: the relocated macromolecular crystallography beamline at the Shanghai Synchrotron Radiation Facility
- Coin-structured tunable beam shaping assembly design for accelerator-based boron neutron capture therapy for tumors at different depths and sizes
- Simulation study of BESIII with stitched CMOS pixel detector using ACTS
- Advances in nuclear detection and readout techniques
- Enhancing betavoltaic nuclear battery performance with 3D P+PNN+multi-groove structure via carrier evolution