
Identifying eco-functional zones on the Chinese Loess Plateau using ecosystem service bundles
2024-01-11 13:05WUFnLIANGYoujiLIULijunYINZhngciHUANGJiejun
區域可持續發展(英文) 2023年4期
WU Fn, LIANG Youji, , LIU Lijun, YIN Zhngci, HUANG Jiejun
a School of Resources and Environmental Engineering, Wuhan University of Technology, Wuhan, 430070, China
b College of Resources and Environment, Yangtze University, Wuhan, 430100, China
Keywords:Ecosystem services Trade-offs Synergy Land use/land cover Climate change Principal component analysis (PCA)Chinese Loess Plateau
ABSTRACT: Optimizing the function of ecosystem services (ESs) is vital for implementing regional ecological management strategies.In this study, we used multi-source data and integrated modelling methods to assess the spatiotemporal variations in eight typical ESs on the Chinese Loess Plateau from 2000 to 2015, including grain production, raw material provision, water conservation, carbon storage service, soil conservation, oxygen production, recreation, and net primary productivity (NPP) services.Then, we divided the ecosystem service bundles(ESBs) according to relationships among the eight ESs, obtaining four types of eco-functional areas at the county (city or banner or district) level based on the spatial clustering of similarities in different ES types.We also identified and assessed the contributions of influencing factors to these eco-functional areas using principal component analysis (PCA) across spatiotemporal scales.We found that the spatiotemporal variations in different ESs were noticeable, with an overall increase in grain production and soil conservation services, no significant change in carbon storage service, and overall decreases in raw material provision, water conservation, oxygen production, recreation, and NPP services.From 2000 to 2015, the number of significant synergistic ES pairs decreased, while that of significant trade-off pairs increased.To the changes of ESBs in the eco-functional areas, the results indicated that the indirect loss of these ESs from forest and grassland due to urban expansion should be reduced in ecological development area (ESB 2) and multi ecological functional area (ESB 3).Meanwhile, crop planting structures and planting densities should be adjusted to reduce ES trade-offs associated with water conservation service in grain-producing area (ESB 4).Lastly, ESB-based ecofunctional zoning can be used to improve ecological restoration management strategies and optimize ecological compensation schemes in ecologically fragile area (ESB 1).
1.Introduction
The benefits that human societies obtain from ecosystems are known as ecosystem services (ESs) (Millennium Ecosystem Assessment, 2005), which characterize the interconnectedness of complex social-ecological systems(Bennett et al., 2015).Changes in ESs can affect regional ecosystem management and progress towards meeting sustainable development goals (SDGs) (Yang et al., 2020; Liang et al., 2021; Wang et al., 2022c).Rapid economic development has led to the serious ecological degradation of some ecologically fragile regions in China (Wang et al.,2021; Liu et al., 2022a).Therefore, balancing economic development with ecological conservation is vital for achieving SDGs in ecologically fragile regions.In response, several national eco-restoration policies have been implemented by the Chinese government.These policies (e.g., the Grain for Green Project) apply top-level scientific planning, design to improve ecosystem functions and integrate the synergistic development of social-ecological systems during the critical period of eco-civilization construction in China (Jiang et al., 2019; Wang et al., 2020).However, effectively implementing regional social-ecological management by regulating trade-off relationships between ESs remains unclear and requires further interdisciplinary research.
Trade-offs between specific ES pairs are influenced by complex socio-ecological processes (Bennett et al., 2009;Li et al., 2021), resulting in simultaneous non-optimal ES supplies (Mashizi and Sharafatmandrad, 2021).Therefore,mitigating ES trade-offs is the theoretical basis for optimizing regional ecosystem service function (Costanza et al.,2017; Liu et al., 2019).Traditional ES trade-off/synergy studies have mainly involved heterogeneous service provision simulations, socio-ecological impact mechanism analysis, and ecosystem management (Vallet et al., 2018; Shen et al., 2020; Zhang et al., 2020; Ma et al., 2022; Wu et al., 2022).Although previous studies have determined the connectivity between pattern and function of ESs (Choi et al., 2021; Jafarzadeh et al., 2021), insight into the underlying interaction mechanism between ecosystem service bundles (ESBs) and ecosystem management remains limited.
Combinations of ESs that are associated consistently across various spatiotemporal scales are known as ESBs(Raudsepp-Hearne et al., 2010), which can be used to identify the determinant ecological functions of different ES supply zones, and ESB identification has been applied in fields such as multi ecological functional landscape planning and regional ecological management (Lin et al., 2018; Liu et al., 2019).The effects of climate change and land use pattern on ESB have also been an important research focus (Mouchet et al., 2017; Guevara-Ochoa et al., 2020).For example, changes in precipitation and temperature can directly affect ES supplies and cause fluctuations in ESBs(Chen et al., 2020; Li et al., 2022).Land use can also affect ES supplies by changing the physical properties of ground surface (Liu et al., 2022b).In addition, elevation changes can result in gradient variations in sunshine, soil, and vegetation cover, thereby affecting the spatiotemporal distributions of ESBs (Jiang et al., 2022).
The Chinese Loess Plateau is a typical ecologically fragile region that has complex spatial and temporal trade-offs in its supply of ESs.Therefore, determining the ESB changes and its various influencing factors can provide theoretical and methodological support for local ecological restoration and adaptive management policies of ecofunctional zones.Thus, ecological functional zoning based on ESBs can aid decision-makers to carry out adaptive ecological management strategies.
The role of ES spatial trade-off characteristics has been emphasized at a landscape scale in the identification of ESBs on the Chinese Loess Plateau (Li et al., 2019; Wang et al., 2022c).However, the existing ES assessment from these studies was relatively homogeneous, and few studies have used ESBs to address cross-scale ecological functional zoning and its influencing factors (Yang et al., 2019).Therefore, this study aimed to assess the impacts of ESB changes on ecological functional zoning on the Chinese Loess Plateau, considering the disturbance of complex socio-ecological factors.The primary research objectives were to: (1) simulate changes in the spatial distributions of eight typical ESs using spatially explicit models; (2) quantify the trade-off/synergistic relationships of different ESs using correlation analysis; (3) identify ESBs and delineate ecological functional zones using K-means clustering algorithm; and (4) explore the contributions of factors that influence ESBs using principal component analysis (PCA).
2.Materials and methods
2.1.Study area
The Chinese Loess Plateau (33°43′–41°16′N, 100°54′–114°33′E) spans seven provinces and autonomous regions,including Henan Province, Shanxi Province, Shaanxi Province, Gansu Province, Qinghai Province, Ningxia Hui Autonomous Region, and Inner Mongolia Autonomous Region, totaling 292 counties, cities, banners and districts(Fig.1).The major area has a temperate continental climate, almost 60.0%–80.0% of annual precipitation (447.2 mm,1961?2015) is concentrated in summer (Li et al., 2017).The study area contains a wide range of landform types,including mountains, hills, terraces, and river valley plains.Over the past decades, several ecological restoration and protection policies have been implemented in this area for mitigating ecological degradation.For example, the Grain for Green Project has led to complex landscape changes through revegetating cropland (Wang et al., 2022a) and substantial changes in ES functions on the Chinese Loess Plateau.
2.2.Data sources
We collected a multi-source dataset (Table 1) for assessing changes in ESs in the study area from 2000 to 2015.Considering the geo-environmental conditions of the study area, the acquired land use/land cover (LULC) data were reclassified into six types including cropland, forest, grassland, water body, urban land, and unused land.In addition,we used Kriging interpolation method (Yin et al., 2019) to generate the spatial maps of temperature, sunshine duration,and precipitation with aggregated yearly-scale data, and these climate data were originally obtained from the national meteorological stations (Fig.1).Specially, monthly total solar radiation was calculated using the monthly sunshine duration.For all raster data, we performed standard data pre-processing procedures including uniform projection,cropping, and re-sampling (1 km×1 km) (Wu et al., 2022).
2.3.Evaluation of ecosystem services (ESs)
Ecological restoration projects have effectively improved land use patterns and processes on the Chinese Loess Plateau, with considerable impacts on ES (Liang et al., 2021; Wang et al., 2022b).We selected eight ES indicators according to the standard classification of ES functions (including provisioning, regulating, cultural, and supporting services) that are closely related to water management and ecological restoration (Table 2).The evaluation methods of the eight indicators are described below.

Fig.1.Topography of the Chinese Loess Plateau and the locations of meteorological stations adopted in this study.

Table 1Data sources for the integrated assessment of ecosystem services (ESs) on the Chinese Loess Plateau from 2000 to 2015.

Table 2Indicators of ES selected in this study.
Grain production has a significant linear relationship with the normalized difference vegetation index (NDVI) (Xu et al., 2018; Peng et al., 2019).Thus, the NDVI data with agricultural statistics were used to simulate grain production service (Eq.1).We calculated the economic value raw material provision service (Eq.2) based on the net primary productivity (NPP) and the standard coal price(PSC) (Song et al., 2015; Wu et al., 2022).
whereGPiis the grain yield of pixeliin study area (t/km2);GPsumis the grain yield of each county (city or banner or district) in the study area (t/km2); NDVIiis the value of NDVI of pixeli; NDVIsumis the sum of NDVI value in each county (city or banner or district);VRMis the economic value of raw material provision service (CNY/km2); NPPiis the value of NPP of pixeli(g C/m2); andPSCis the price of standard coal in 2000 (CNY/km2).
Water conservation service was simulated using a water assessment method validated by Sun et al.(2022).Carbon storage service was calculated using the Integrated Valuation of Ecosystem Services and Trade-offs (InVEST) model(Eq.3), combined with the LULC maps and local carbon density parameters (Liang et al., 2021).Soil conservation service was calculated with the modified universal soil loss equation (Eq.4).We calculated oxygen production service based on the NPP and the principle of “1.2 g of O2released per 1 g of dry matter produced” (Wang et al., 2019).
whereCtis the total carbon storage in the study area (Mg);Amis the area of land use typem(km2);Cm,a,Cm,b,Cm,s,andCm,dare the aboveground biomass (Mg/km2), belowground biomass (Mg/km2), soil organic carbon (Mg/km2),and dead organic matter (Mg/km2) of land use typem, respectively;SCis the soil conservation (t/(hm2?a));Ris the rainfall erosivity factor (MJ?mm/(hm2?h?a)), obtained by the Wischmeier formula (Wischmeier and Smith, 1978);Kis the soil erodibility factor (t?h/(MJ?mm)), calculated using the classical erosion productivity equation (Williams et al., 1984);LSis the slope length and steepness factor, calculated using the method introduced by Liu et al.(2000);Cis the vegetation cover factor, calculated by an empirical formula (Cai et al., 2000); andPis the soil conservation practice, obtained from existing studies (Zhao et al., 2007; Sun et al., 2014).
We adopted a factor correction method (Eq.5) to calculate the recreation service of Chinese Loess Plateau, which estimates the value equivalents of terrestrial ESs in China based on regional grain yield, NPP, and vegetation coverage(Zhang et al., 2018).
whereVRSis the economic value of recreation service (CNY/km2);Qmis the recreation value of land use typemin the Chinese Terrestrial Ecosystem Service Value Equivalent Table (CNY/km2) (Xie et al., 2017); GPLis the grain yield of the Chinese Loess Plateau (t/km2); GPCis the grain yield of China (t/km2);fiis the percentage of vegetation coverage of pixeli(%);fmeanis the mean percentage of vegetation coverage of land use typem(%); and NPPmeanis the mean value of NPP of land use typem(g C/m2).
As shown in Table 2, NPP service plays the supporting service function of ecosystem.In this study, we estimated NPP service using the improved Carnegie Ames Stanford Approach (Zhu et al., 2007), combined with the maximum and minimum NDVI values, as well as the maximum light energy utilization of different vegetation types (Zhu et al.,2006).
where NPP(i,t) is the NPP value of pixeliat timet(g C/m2);APAR(i,t) is the photosynthetically available radiation absorbed by pixeliat timet(MJ/m2); andε(i,t) is the actual light energy utilization rate of pixeliat timet(g C/MJ).Finally, the estimated values of each ES for each study year were then normalized to 0–1 to generate the spatial ES maps.
2.4.Trade-off/synergy relationship between ESs and spatial clustering of ESs
To investigate the correlation relationships among the eight ESs, we used the Pearson correlation coefficient method(Eq.7) by SPSS 25 (International Business Machines Corporation (IBM), Armonk, New York, the USA).Further, to show the correlation relationships among the eight ESs visually, we plotted spatial heat maps by Origin 2022b(OriginLab, Hampton, Massachusetts, the USA).
whereris the correlation coefficient;nis the number of pixels;xiandyidenote the values ofxtype ES andytype ES in theithpixel, respectively; andxandyare the average values ofxtype ES andytype ES in all pixels, respectively.The correlation coefficient (r) is divided into three categories: positively correlated (r>0), indicating the existence of a synergistic relationship betweenxandy; negatively correlated (r<0), indicating the existence of a trade-off relationship; and not correlated (r=0).
Spatial clustering of ESs was conducted by utilizing the K-means clustering algorithm (Saidi and Spray, 2018) in SPSS 25 to identify the ESBs on the Chinese Loess Plateau.To improve the reliability of spatial clustering, we combined the Elbow method and Silhouette Coefficient to obtain the optimal number of clusters (Sun et al., 2020).Then, the spatial maps of eco-functional zone at the county (city or banner or district) level were generated with the optimal number of clusters.
2.5.Analysis of the influencing factors of ecosystem service bundles (ESBs)
Considering the fragile ecological environment of the Chinese Loess Plateau and the implementation of ecological restoration projects, 11 indicators were selected due to their abilities of reflecting the spatiotemporal influences of land use, socioeconomic, and climate dimensions on ESBs (Li et al., 2019; Chen et al., 2020).These indicators include the proportion of agricultural land, proportion of urban land, proportion of ecological land (including two land use types: forest and grassland), digital elevation model (DEM), slope, sunshine duration, gross domestic product (GDP),population, precipitation, temperature, and potential evapotranspiration.We explored the impacts of these factors on ESBs by PCA (Li et al., 2021) and estimated the weight of each influencing factor.
whereEabis the linear combination coefficient matrix;Labis the factor loading of each principal component (PC);ais the potential influencing factor (a=1, 2, ..., 11);bis the PC (b=1, 2, ...,b);eigenbis the eigenvalue of each PC;Sais the composite score coefficient of each influencing factor;Fbis the variance of each PC; andWais the weight of each influencing factor.All the data inputs in Equations 8–10 were provided as aggregated statistical averages at the county (city or banner or district) level.Figure 2 shows the flowchart of this study.
3.Results
3.1.Changes of land use/land cover (LULC)
The LULC on the Chinese Loess Plateau showed a relatively consistent change from 2000 to 2015 (Fig.3).According to Figure 3, we can find that the areas of cropland and grassland accounted for the largest land types on the Chinese Loess Plateau.Due to the implementation of eco-restoration policies, 6825 km2of cropland was converted to grassland during 2000–2015, which is evident in the northwestern part of the study area and central Shanxi Province(Figs.4 and 5).And also, 5985 km2of unused land was converted to grassland, mainly in Yinchuan City of Ningxia Hui Autonomous Region and Ordos City of Inner Mongolia Autonomous Region; but along with the acceleration of urbanization process, 5177 km2of cropland was converted to urban land during 2000–2015, which is apparent in Xi’an City of Shaanxi Province and Luoyang City of Henan Province.The area of cropland encroached by urban expansion was compensated by the efforts of the implementation of revegetation policies, leading to indirect occupation of forests and grasslands.

Fig.2.Flowchart of this study.

Fig.3.Distribution of land use/land cover (LULC) on the Chinese Loess Plateau in 2000 (a), 2005 (b), 2010 (c), and 2015 (d).

Fig.4.Spatial distribution of LULC change on the Chinese Loess Plateau from 2000 to 2015.(a), 2000–2005; (b),2005–2010; (c), 2010–2015.It should be noted that this figure only shows the main LULC changes occurring on the Chinese Loess Plateau from 2000 to 2015, while the minor LULC changes are represented aggregately by “Others”with black block.
3.2.Changes in the value of ESs
The changes in ESs varied significantly from 2000 to 2015 (Fig.6).Grain production service showed a decreasing trend from the southeast to northwest part of Chinese Loess Plateau, with high production areas located mainly on the Guanzhong Plain, Shaanxi Province and in Yinchuan City, Ningxia Hui Autonomous Region (Fig.6a and i).Grain production service in Bayannur City and Baotou City, Inner Mongolia Autonomous Region, which are located in the north of Chinese Loess Plateau, increased from 2000 to 2015 (Fig.6a and i).Raw material provision (Fig.6b and j),carbon storage (Fig.6d and l), oxygen production (Fig.6f and n), and NPP (Fig.6h and 6) services exhibited similar spatial distributions, with higher values in the southeastern forest region.Water conservation service benefit areas were in the Guanzhong Plain, Shaanxi Province, with an increasing trend observed in Ordos City, Inner Mongolia Autonomous Region (Fig.6c and k).The spatial distribution of soil conservation service was essentially stable in low values, with a slight increase trend from the northwest to southeast part of Chinese Loess Plateau (Fig.6e and m).Recreation service exhibited high values in the Fenwei Basin, with substantial increases in the eastern and central parts of Shanxi Province (Fig.6g and o).
From the perspective of land use type, the highest total ES values were provided by forest (Figs.3 and 6), while the other land types exhibited extremely minor differences.From the perspective of administrative region, the east part of Shanxi Province and the Guanzhong Plain exhibited significant decrease in the value total ESs, while the north part of Shaanxi Province and Ningxia Hui Autonomous Region exhibited increase.
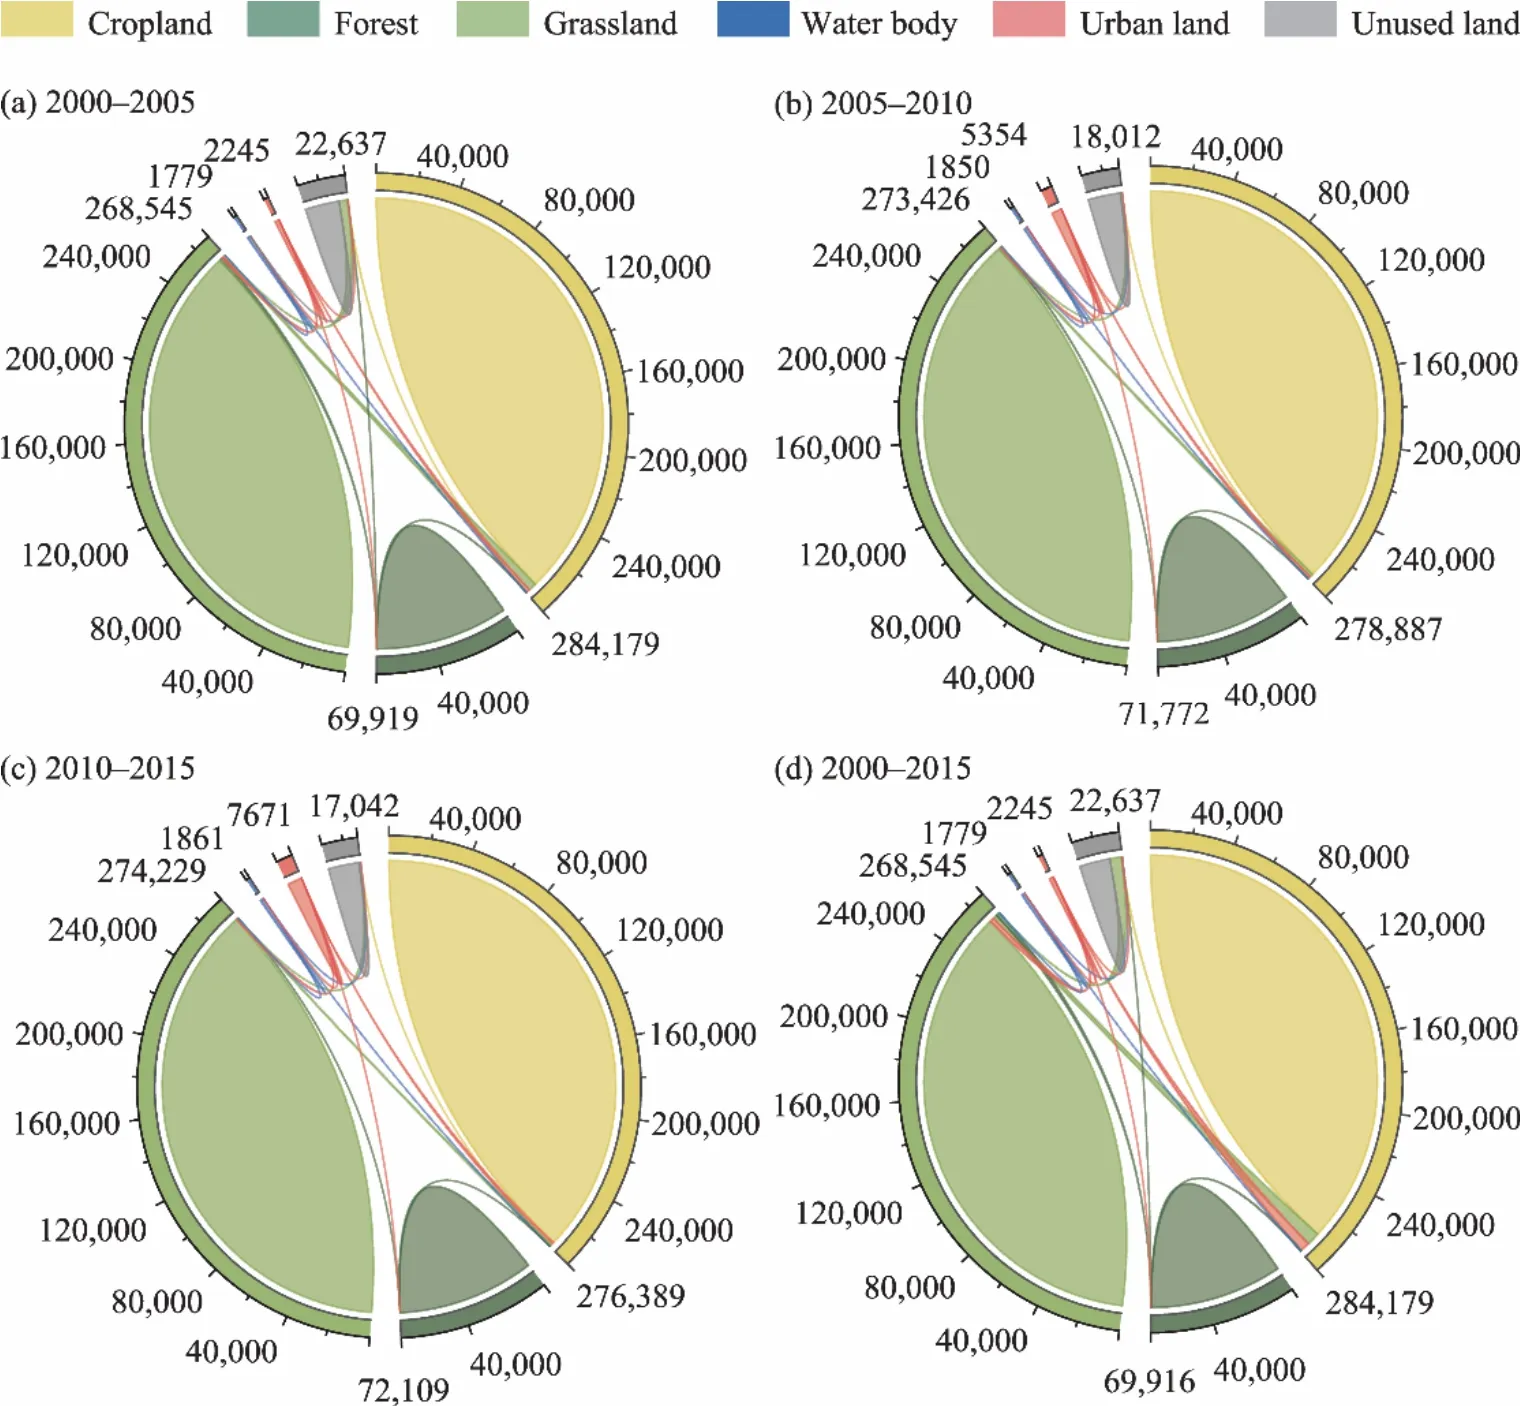
Fig.5.Changes in the areas of six land use types on the Chinese Loess Plateau from 2000 to 2015.(a), 2000–2005;(b), 2005–2010; (c), 2010–2015; (d), 2015–2020.The unit in this figure is km2.
The normalized mean value of each ES on the Chinese Loess Plateau exhibited fluctuation changes from 2000 to 2015 (Figs.7 and 8).For example, the normalized mean values of grain production and soil conservation services increased 0.011 and 0.002, respectively, from 2000 to 2015.Meanwhile, the normalized mean values of NPP, raw material provision, oxygen production, water conservation, and recreation services decreased –0.038, –0.031, –0.031,–0.005, and –0.001, respectively, from 2000 to 2015.No considerable change was observed in carbon storage service.
3.3.Relationship between ESs
As shown in Figure 9, no matter in 2000 or 2015, the number of synergistic relationship between ESs was apparently more the trade-off relationship on the Chinese Loess Plateau.However, the trade-off relationship between ESs was enhanced in 2015 than in 2000.For example, in 2000, a significant trade-off relationship was only observed between water conservation and carbon storage services on the Chinese Loess Plateau (r= –0.20,P≤0.001), and the trade-off relationships among water conservation and oxygen production, raw material provision, soil conservation,and NPP services were insignificant (r= –0.10,P>0.01).In 2015, the numbers of trade-offs related to water conservation service increased obviously, and all of the four services were significantly conflicted with water conservation service (P≤0.001).The correlation coefficient between water conservation and carbon storage services changed from –0.20 (in 2000) to –0.26 (in 2015), implying that the conflict between water conservation and carbon sink functions was expended.
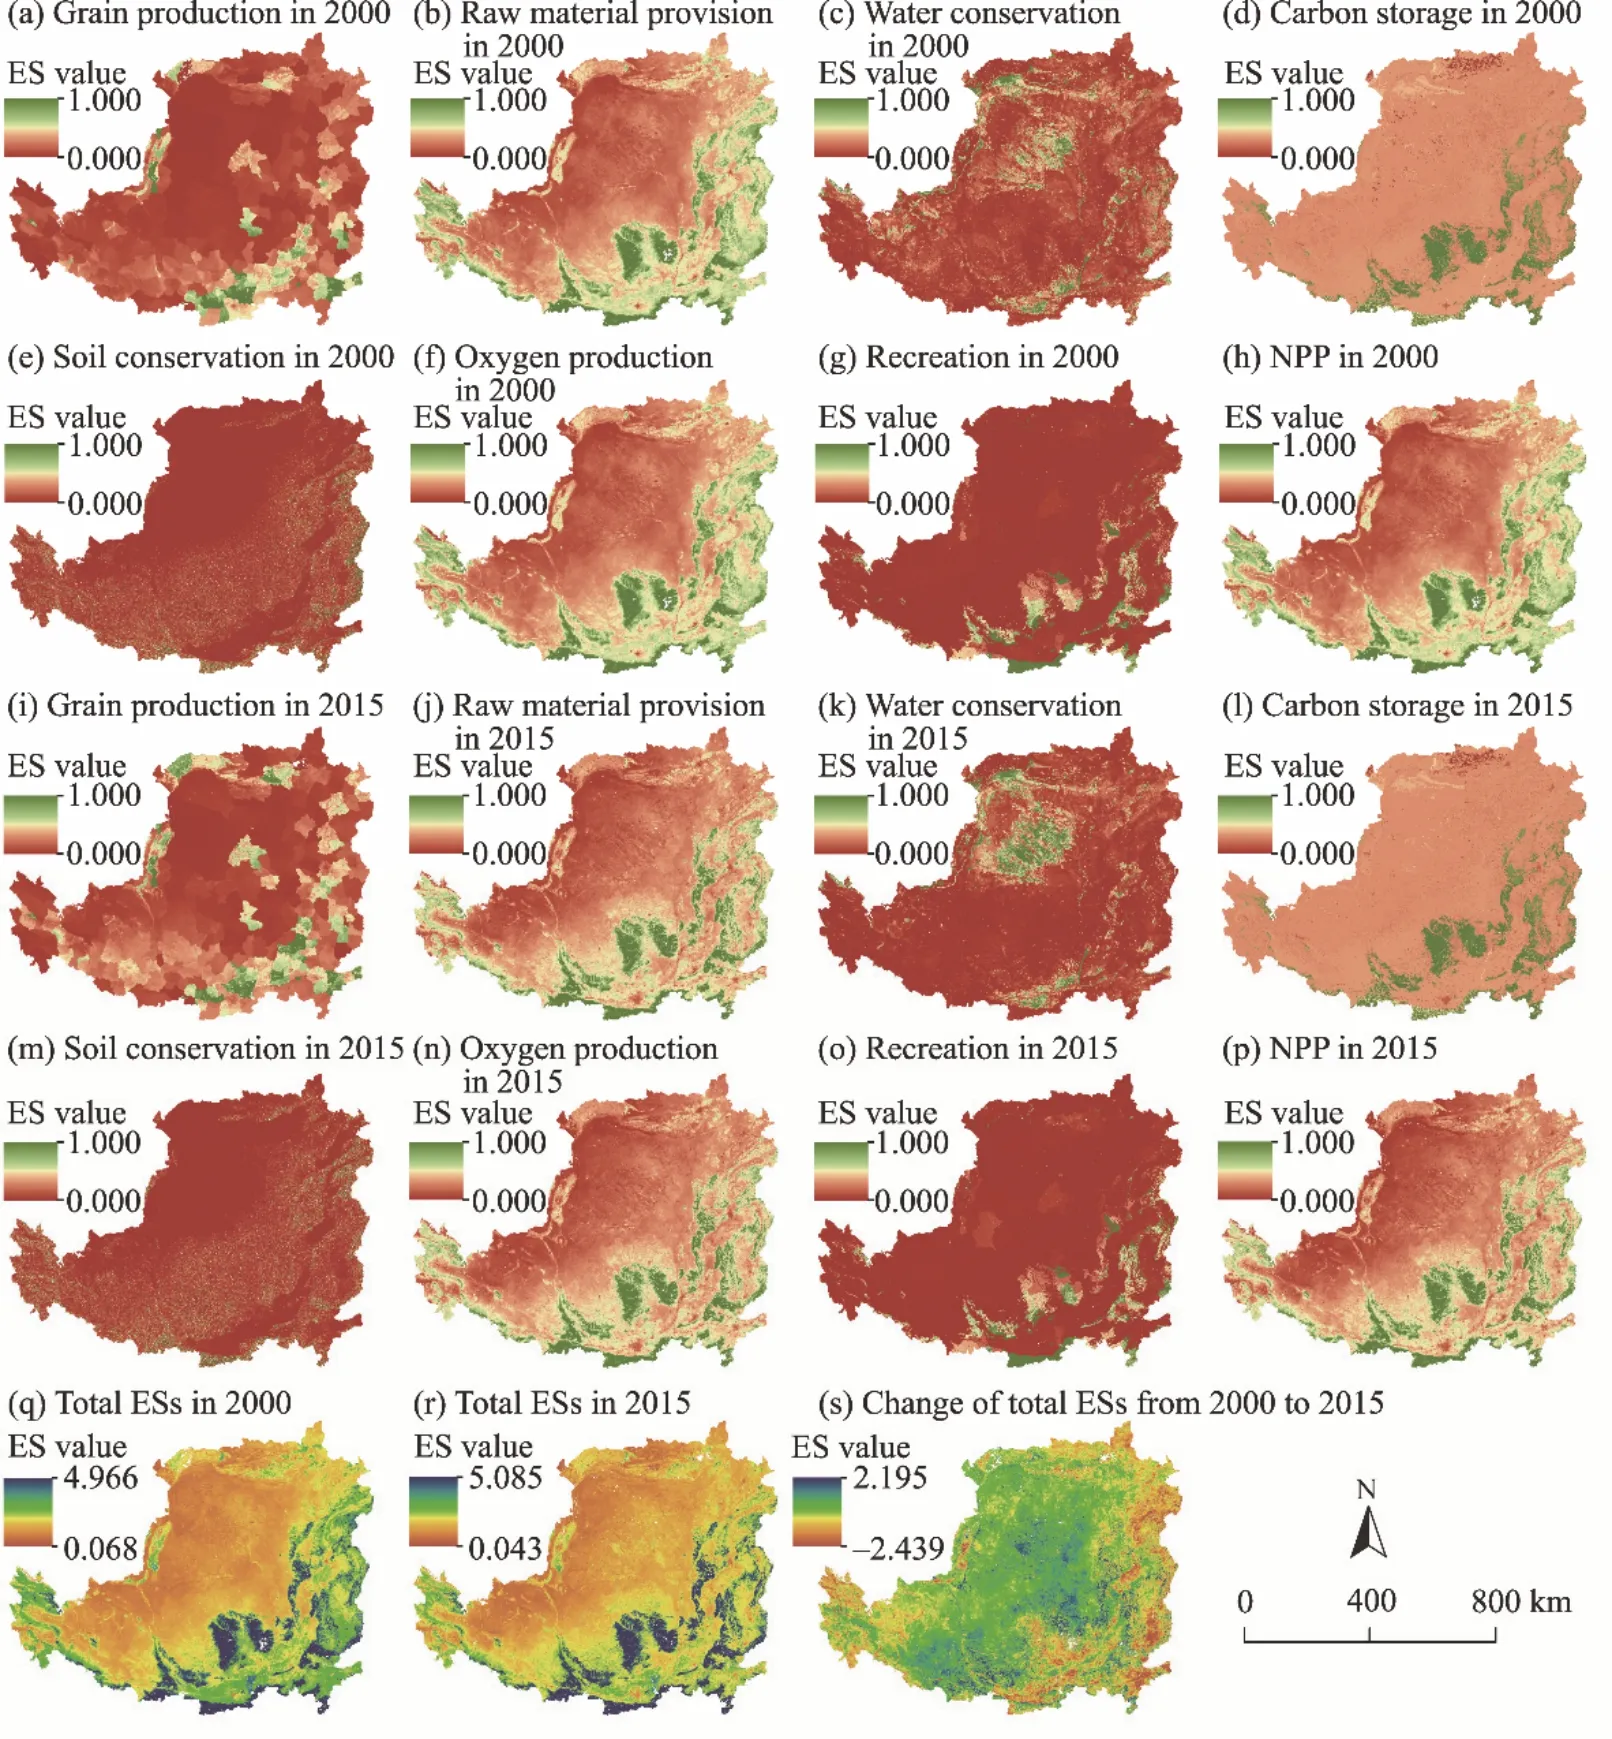
Fig.6.Spatial distribution of each ES and total ESs on the Chinese Loess Plateau in 2000 and 2015 and the change of total ESs from 2000 to 2015.(a), grain production service in 2000; (b), raw material provision service in 2000; (c),water conservation service in 2000; (d), carbon storage service in 2000; (e), soil conservation service in 2000; (f),oxygen production service in 2000; (g), recreation service in 2000; (h), NPP service in 2015; (i), grain production service in 2015; (j), raw material provision service in 2015; (k), water conservation service in 2015; (l), carbon storage service in 2015; (m), soil conservation service in 2015; (n), oxygen production service in 2015; (o), recreation service in 2015; (p), NPP service in 2015; (q), total ESs in 2000; (r), total ESs in 2015; (s), change of total ESs from 2000 to 2015.
3.4.Identification of ESBs
Four ESBs were clustered to generate eco-functional zones on the Chinese Loess Plateau (P<0.01), of which ESB 1 is ecologically fragile area, ESB 2 is ecological development area, ESB 3 is multi ecosystem functional area, and ESB 4 is grain-producing area.Both the spatial distributions of ESBs in 2000 and 2015 exhibited obvious clustering characteristics (Fig.10).The number of counties (cities, banners, and districts) covered by ESB 1 increased from 98 to 112 from 2000 to 2015, whereas the number of counties (cities, banners, and districts) in ESBs 2, 3, and 4 decreased from 134, 58, and 2 to 127, 52, and 1, respectively.
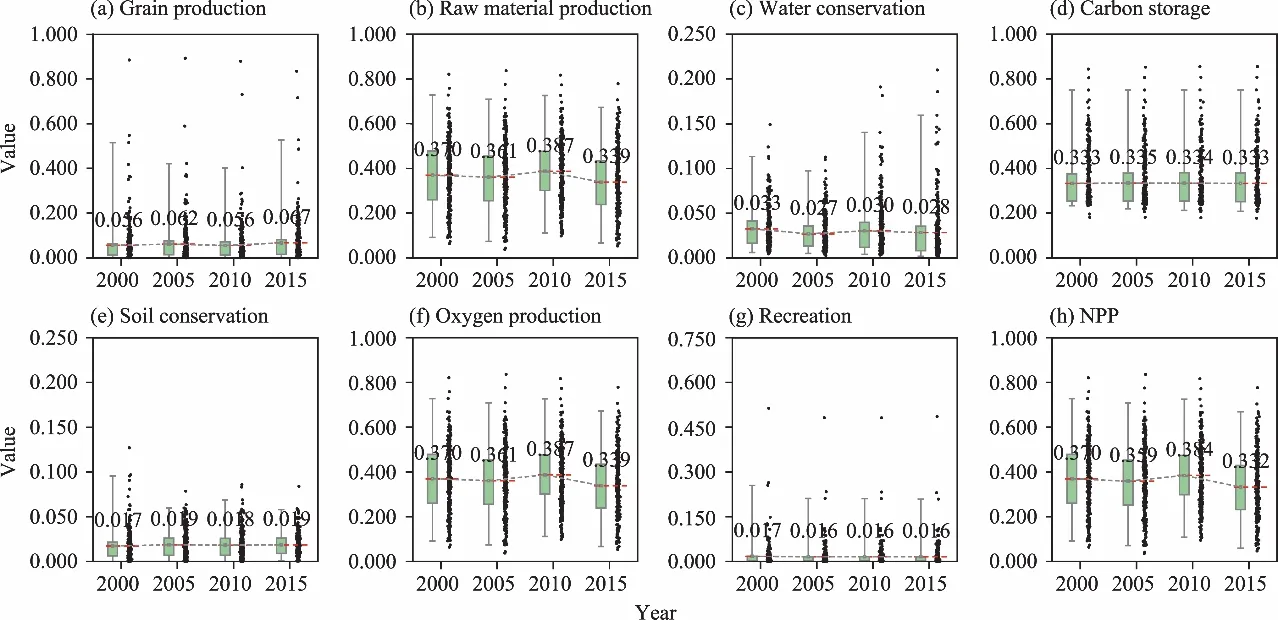
Fig.7.Mean value of each ES on the Chinese Loess Plateau in 2000, 2005, 2010, and 2015.(a), grain production service; (b), raw material provision service; (c), water conservation service; (d), carbon storage service; (e), soil conservation service; (f), oxygen production service; (g), recreation service; (h), NPP service.The red dashed line indicates the trend of variation, the black point represents the mean value of ES of each city (county or banner or district) on the Chinese Loess Plateau.The upper line of green box is the three-quarter quantile, representing 25.0%of data are above this value; while the lower line is the quarter quantile line, representing 25.0% of data are below this value.

Fig.8.Variation tendency of each ES and total ESs of different land use types on the Chinese Loess Plateau from 2000 to 2015.(a), grain production service; (b), raw material provision service; (c), water conservation service; (d),carbon storage service; (e), soil conservation service; (f), oxygen production service; (g), recreation service; (h), NPP service; (i), total ESs.

Fig.9.Correlation coefficients between ESs on the Chinese Loess Plateau in 2000 (a) and 2015 (b).GP, grain production service; RMP, raw material provision service; WC, water conservation service; CS, carbon storage service;SC, soil conservation service; OP, oxygen production service; REC, recreation service.* represents significance at the P≤0.01 level and ** represents significance at the P≤0.001 level.Blue circle represents synergistic relationship, while orange circle represents trade-off relationship.The size of the circle represents the degree of trade-off or synergy; the larger the circle, the greater the degree.

Fig.10.Spatial distribution and area percentage of each ESB on the Chinese Loess Plateau in 2000 (a and c) and 2015 (b and d).ESB 1, ecologically fragile area; ESB 2, ecological development area; ESB 3, multi ecosystem functional area; ESB 4, grain-producing area.
The area of ESB 1 was concentrated in the northwest part of the Chinese Loess Plateau, and its area percentage increased from 52.9% in 2000 to 54.1% in 2015 (Fig.10).The area of cropland exhibited opposing change (decreasing from 35.9% in 2000 to 33.7% in 2015) from grassland (increasing from 56.8% in 2000 to 59.7% in 2015) in ESB 1 area (Fig.11).The values of oxygen production, raw material provision, and NPP services in ESB 1 were lower than the other bundles (Fig.12).ESB 2 was distributed in the southwestern and eastern parts of the Chinese Loess Plateau,and its area percentage increased from 29.7% in 2000 to 30.1% in 2015 (Fig.10).Both the variation trends of the areas of cropland (slightly increasing from 57.8% in 2000 to 57.9% in 2015) and grassland (decreasing from 31.4%in 2000 to 28.9% in 2015) in ESB 2 were opposite with those in ESB 1 (Fig.11).All the ES values in ESB 2 were higher than those in ESB 1 (Fig.12).ESB 3, mainly located in the southeastern part of the Chinese Loess Plateau,was suburban and important vegetation restoration area of the plateau, and its area percentage decreased from 17.1%in 2000 to 15.7% in 2015.In ESB 3, the area proportion of cropland decreased from 43.6% in 2000 to 42.1% in 2015 and the area proportion of forest increased from 44.6% in 2000 to 48.2% in 2015.The values of raw material provision,carbon storage, NPP, and oxygen production services increased in ESB 3 from 2000 to 2015 (Fig.12).ESB 4 was in the Weinan–Baoji area and dominated by cropland and forest, and its area percentage decreased from 0.3% in 2000 to 0.1% in 2015 (Fig.8).Comparing to other ESB areas, ESB 4 had apparent good performance on the grain production, raw material provision, and recreation services.From 2000 to 2015, the area percentage of cropland sharply decreased from 75.0% to 23.0%, and the area percentage of forest evidently increased from 21.6% to 60.6%;also, the area percentage of urban land increased from 2.4% to 15.8% in ESB 4 (Fig.11).

Fig.11.Area percentage of each land use type in each ESB on the Chinese Loess Plateau in 2000 (a, b, c, and d) and 2015 (e, f, g, and h).

Fig.12.Mean value of each ES in each ESB on the Chinese Loess Plateau in 2000 (a, b, c, and d) and 2015 (e, f, g,and h).
3.5.Contribution of influencing factors of ESBs
Three PCs explained 84.1% of the variance (Fig.13), of which PC1 accounting for 41.8%, PC2 for 24.0%, and PC3 for 18.3%.Analysis of the factor loadings of the three PCs indicated that the factors associated with PC1 included DEM (factor loading of 0.895), temperature (–0.893), proportion of cropland (–0.717), and proportion of ecological land (0.690) (Table 3).PC2 was mainly related to evapotranspiration (0.941), precipitation (0.838), sunshine duration(–0.754), and slope (0.686).PC3 was correlated with GDP (0.961), proportion of urban land (0.958), and population density (0.912).In addition, 11 influencing factors were aggregated into 4 categories: topography (DEM and slope),climate (sunshine duration, temperature, precipitation, and potential evapotranspiration), land use (proportion of cropland, proportion of ecological land, and proportion of urban land), and socioeconomic factors (GDP and population).The impacts of topography, climate, land use, and socioeconomic factors on the changes of ESBs were 31.6%, 26.4%, 25.8%, and 16.2%, respectively (Table 4).For the topographic factors, slope (10.7%) had the highest contribution to the changes of ESBs, followed by DEM (9.9%).For the climate factors, sunshine duration (11.0%),temperature (10.3%), and precipitation (9.2%) were the main influencing factors for the changes of ESBs, and potential evapotranspiration showed the lowest contribution (6.9%).The proportion of ecological land (10.8%)contributed most to ESB changes among the land use factors, followed by proportion of cropland (8.9%), while the contribution of proportion of urban land only accounted for 6.1%.Lastly, in terms of socioeconomic factors,population (8.9%) had a greater impact on ESB changes than GDP (7.3%).
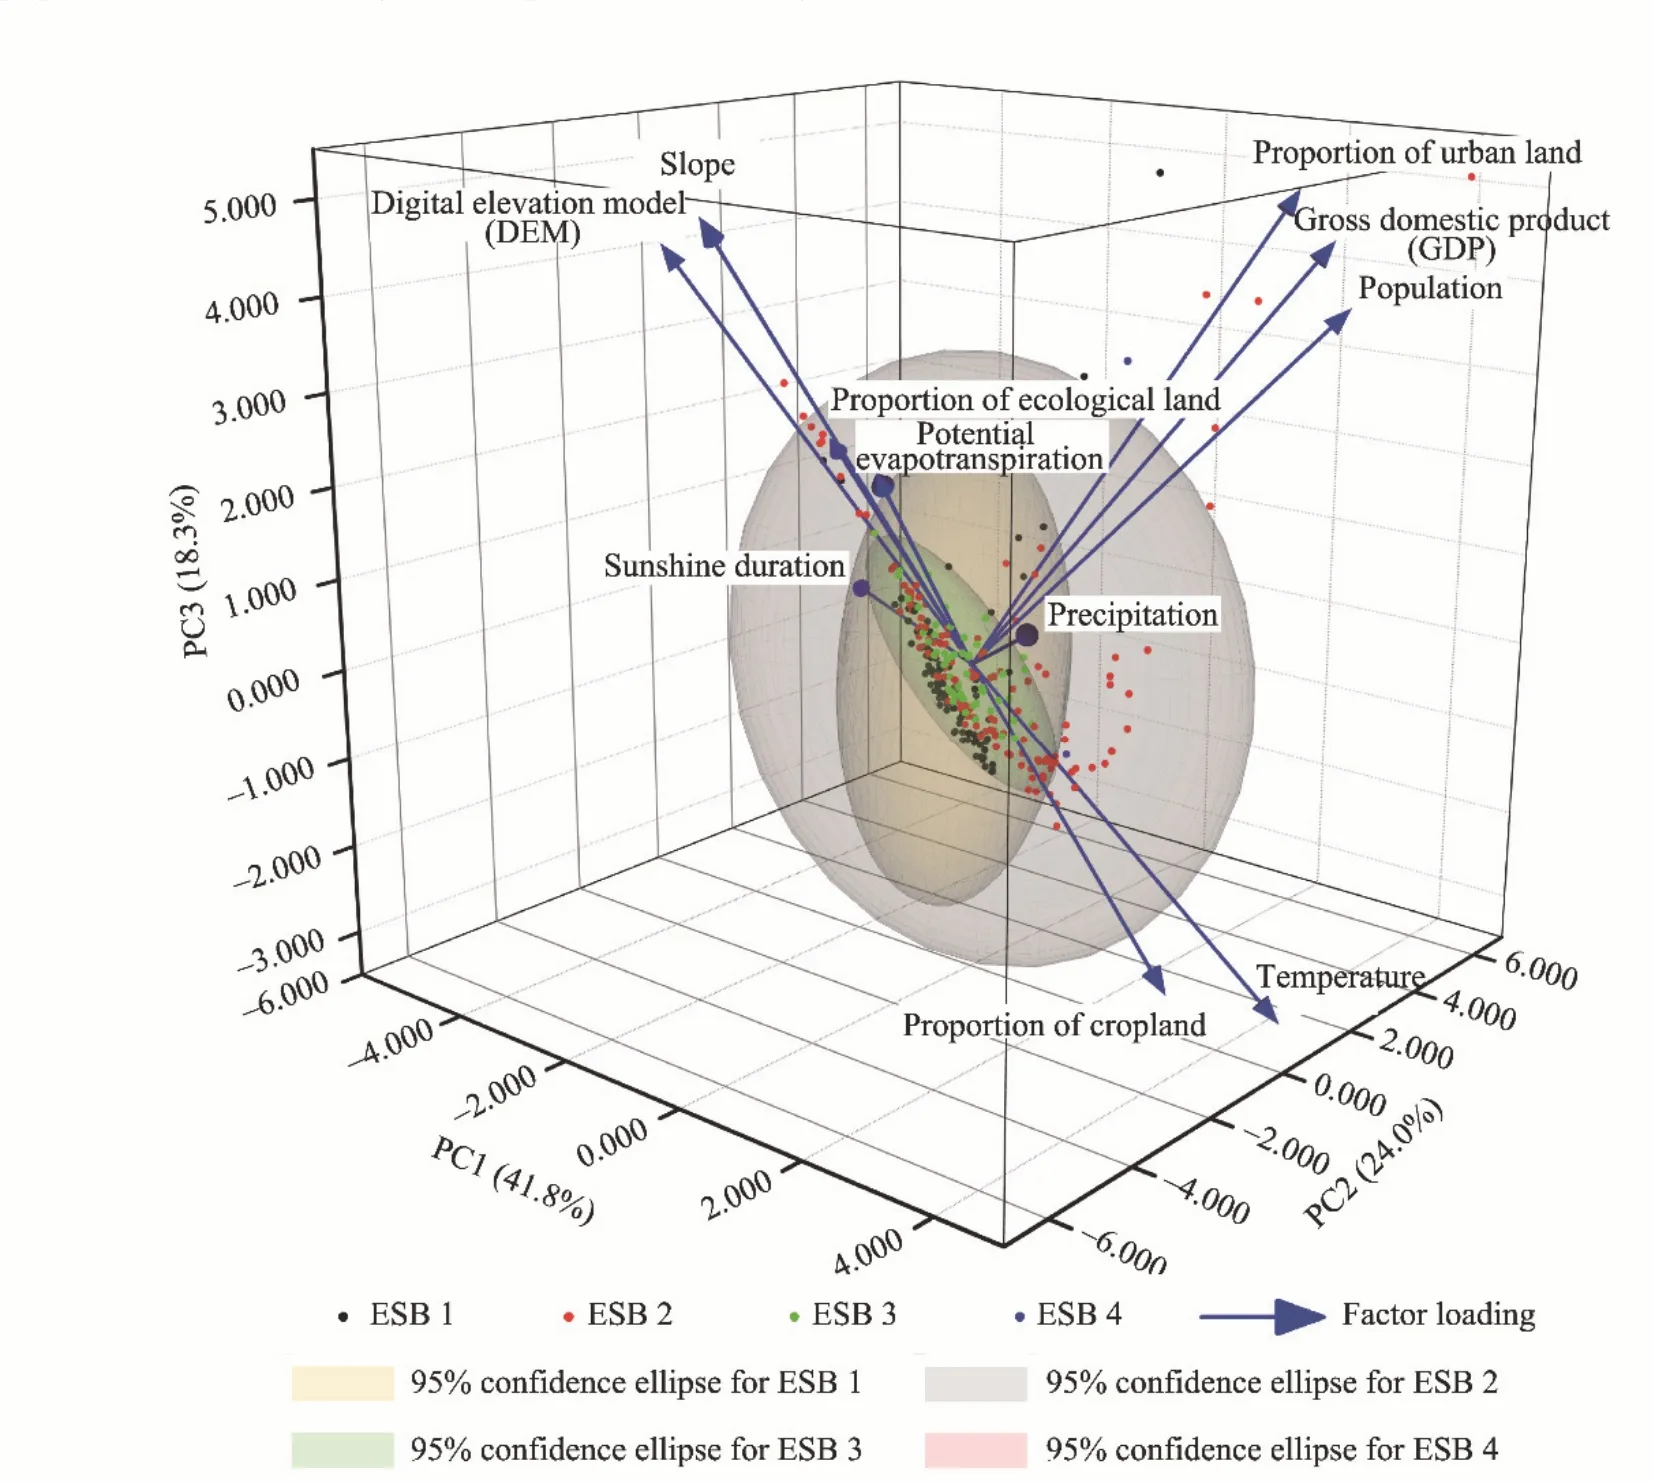
Fig.13.Result of principal component analysis (PCA) on the influencing factors of ESBs.The direction of arrow indicates the orientation of principal component (PC), representing the direction in which the data exhibit the greatest variation.The length of arrow represents the weight or importance of the PC.A longer arrow signifies a stronger explanatory power of the PC.
4.Discussion
4.1.Nexus of land use type and ESs
The implementation of ecological restoration projects and urbanization have continuously increased the ecological and urban land areas on the Chinese Loess Plateau.For example, from 2000 to 2015, 6825 and 5180 km2of croplands were converted to grassland and urban land, respectively.Furthermore, during the initial stage of the Grain for Green Project (2000–2005), 4530 km2of cropland was transformed into ecological land.The total ESs provided by forest were higher than those of other land use types; the total ESs provided by cropland, grassland, water body, and urban land were relatively similar; and the total ESs provided by unused land were much lower than those of other land use types.Except for urban land, the total ESs increased from 2000 to 2010 (particularly regulating service).After 2010,the slow growth of the area of forest and the accelerated urban expansion, have led to the decrease in the total ESs of forest.Although the area of cropland decreased during the study period, advances in agricultural technology andimproved fertilization and irrigation efficiencies may have contributed to enhancing grain production service (Kou et al., 2021).Higher grain production supply and grain output per unit area indicated that the regional food security of the Chinese Loess Plateau is guaranteed (Wang et al., 2022a).In 2000, only a significant trade-off was observed between water conservation and carbon storage services.In 2015, the number of regional ES trade-off pairs increased,with water conservation having trade-off relationships with raw material provision, NPP, oxygen production, and soil conservation services.It should be noticed that substantial increases in the areas of forest and grassland were observed,which improved the supply capacities of carbon storage, soil conservation, oxygen production, and NPP services;however, the amount of water required for vegetation growth gradually exceeded the water resource load, resulting in less surface runoff (Qiu et al., 2021) and low water conservation capacity of vegetated area.The observed increase in the total ESs supported the perception that ecological restoration projects can improve regional ES supplies.However, the intensified trade-off relationships between ESs also demonstrated that the implementation of ecological restoration projects should be carefully considered to avoid undue impacts on local water resource and other natural resources.Overall, these results indicated that the previous round of the Grain for Green Project promoted the level of ESs on the Chinese Loess Plateau and improved the ecological conditions of this region.

Table 3Results of principal component analysis (PCA) for the influencing factors of ecosystem service bundles (ESBs).
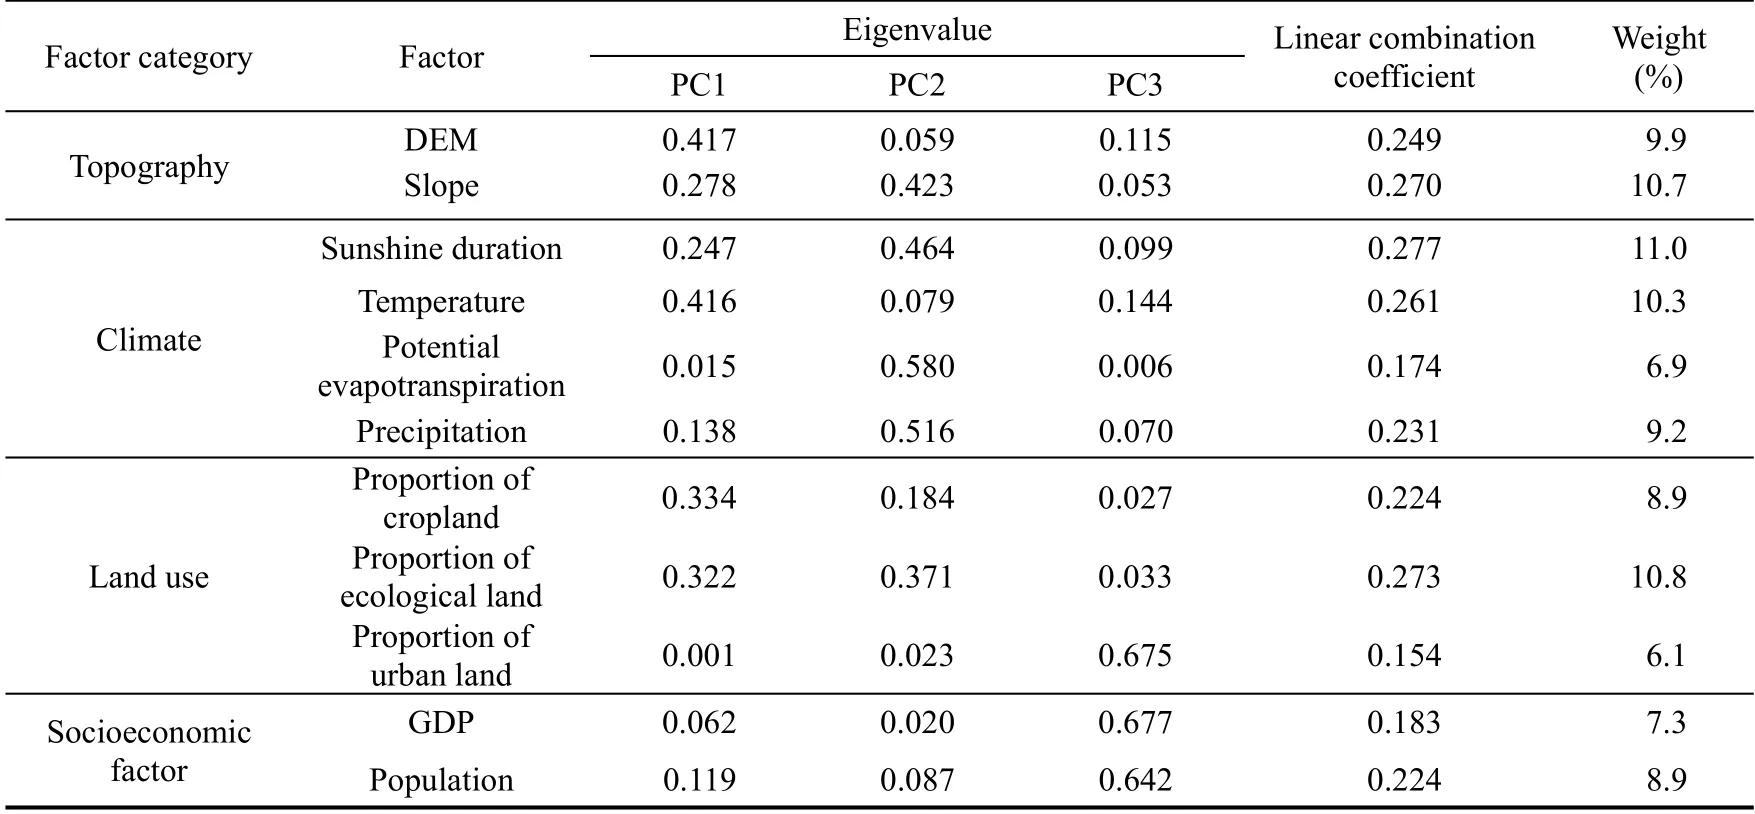
Table 4Linear combination coefficients and weights of ESB influencing factors.
4.2.Adaptive management strategies for ecological functional zones
The levels of ES supplies in the ecologically fragile area (ESB 1) were low, restricting by lagging socioeconomic development and fragile ecosystem conditions in the northwestern part of the Chinese Loess Plateau.Thus, we suggested that local governments focus on accelerating rural industrialisation to vigorously promote the development of secondary industries and stabilize regional economic growth.In addition, local governments should actively seek special funding support for national ecological protection projects to mitigate local ecosystem vulnerability.The ecological development(ESB 2) and multi ecological functional (ESB 3) areas were alternately located.The levels of ES supplies in the ecological development area were low.From 2000 to 2015, the area of grassland in ESB 2 region decreased, while the area of urban land increased.We recommended that local governments located in ESB 2 formulate reasonable land use planning strategies to avoid urban growth encroaching on grassland, which indirectly causes the loss of ecological land.The multi ecological functional area had low level of water conservation service, but the rest of its ESs were high and the main land use types were cropland and forest.Forest expansion leads to higher water consumption and low surface runoff (Wang et al., 2017; Wu et al., 2018).Therefore, we suggested that the governments located in the multi ecological functional area should balance the areas of restored forest and grassland through vegetation restoration projects, and improve the ES supplies of grassland in arid and semi-arid areas.Green infrastructure for coping with extreme weather disasters should also be strengthened.Except for carbon storage and water conservation services, ES supplies were at their highest levels in the main grain-producing area (ESB 4), and cropland and forest were the major land use types in ESB 4; thus,the risk of excessive water depletion triggered by high vegetation cover should be considered.We therefore recommended that local governments should maintain the ES abundances in the main grain-producing areas and consider the integrated effects of species diversity, planting structure, and density of restored vegetation.
5.Conclusions
In this study, we comprehensively evaluated the changes of eight typical ESs and their trade-off/synergistic relationships, and identified and delineated the ecological functional zones on the Chinese Loess Plateau from 2000 to 2015.We found that unused land and cropland were rapidly transformed into grassland and some cropland was transformed into urban land.The values of grain production and soil conservation services increased, whereas the values of raw material provision, water conservation, oxygen production, recreation, and NPP services decreased, and carbon storage service did not change significantly on the Chinese Loess Plateau from 2000 to 2015.The synergistic relationships between ESs weakened, while the trade-off relationships strengthened, and the number of trade-off pairs increased significantly from 2000 to 2015.Such changes were mainly concentrated in ES pairs related to water conservation service.The topographic and climatic influences on ESB were larger than those of land use and socioeconomic factors, with sunshine duration, temperature, slope, and ecological land proportion having marked effects.We recommended that local governments develop adaptive landscape planning and ecosystem management policies based on the characteristics of different ecological functional areas while paying attention to balancing the trade-off relationship for maintaining harmony between socioeconomic development and ecological restoration.This study provided a basis for coordinating integrated regional socio-ecological management and could be a planning reference for the sustainable development of ecological restoration areas.
6.Limitations and uncertainties
Methods for assessing ESs are diverse, and the accuracy and spatiotemporal resolutions of multi-source data have considerable impacts on the assessment results.In this study, an integrated analysis was conducted uniformly using datasets with 1 km×1 km resolution.Thus, the differential impacts of changes in the granularity of highly precise data on the assessment results should be examined in the future.In addition, a comparative study of ES assessment methods should be conducted for the social-ecological system characteristics of the study area.For instance, using NPP to estimate oxygen production and raw material provision service may increase the covariance of the results, and the reliability of the results could be improved by applying evaluation methods with different mechanisms and validation data.Finally,correlation analysis is a rapid evaluation method for determining trade-off/synergistic relationships among multiple ESs;however, there are limitations when characterizing nonlinear relationships among ESs (Xu et al., 2022).Thus,interdisciplinary methods (e.g., production possibility frontier curves) should be used to assess the nonlinear relationships among different ESs.
Authorship contribution statement
WU Fan: conceptualization, formal analysis, investigation, methodology, and writing - original draft; LIANG Youjia: conceptualization, formal analysis, funding acquisition, investigation, methodology, resources, supervision,writing - original draft, and writing - review & editing; LIU Lijun: funding acquisition, resources, and writing -original draft; YIN Zhangcai: funding acquisition and writing - review & editing; and Huang Jiejun: writing - review& editing.
Declaration of competing interest
The authors declare that they have no known competing financial interests or personal relationships that could have appeared to influence the work reported in this paper.
Acknowledgements
This work was supported by the Science Foundation of Hubei Province (2021CFB295), the China Postdoctoral Science Foundation (2023M730363), the China Meteorological Administration Key Open Laboratory of Transforming Climate Resources to Economy (2023016), and the National Natural Science Foundation of China(42171415).Thanks to HE Yating at Wuhan University of Technology for the improvement of this article.
- 區域可持續發展(英文)的其它文章
- Economic complexity and environmental sustainability in eastern European economies: Evidence from novel Fourier approach
- Supplemental feeding on rangelands: new dynamics of the livestock in the El Ouara rangelands in southern Tunisia
- Social interactions in periodic urban markets and their contributions to sustainable livelihoods: Evidence from Ghana
- How Himalayan communities are changing cultivation practices in the context of climate change
- Rural sustainable development: A case study of the Zaozhuang Innovation Demonstration Zone in China
- Toward a sustainable future:Examining the interconnectedness among Foreign Direct Investment (FDI),urbanization, trade openness, economic growth, and energy usage in Australia