
Phase field model for electric-thermal coupled discharge breakdown of polyimide nanocomposites under high frequency electrical stress
2024-03-19 02:37ZhiyunHAN韓智云QingminLI李慶民JunkeLI李俊科MengxiWANG王夢溪HanwenREN任瀚文andLiangZOU鄒亮
Plasma Science and Technology 2024年2期
關鍵詞:李俊
Zhiyun HAN (韓智云),Qingmin LI (李慶民),*,Junke LI (李俊科),Mengxi WANG (王夢溪),Hanwen REN (任瀚文) and Liang ZOU (鄒亮)
1 State Key Lab of Alternate Electrical Power System with Renewable Energy Sources,North China Electric Power University,Beijing 102206,People’s Republic of China
2 School of Electrical Engineering,Shandong University,Jinan 250061,People’s Republic of China
Abstract In contrast to conventional transformers,power electronic transformers,as an integral component of new energy power system,are often subjected to high-frequency and transient electrical stresses,leading to heightened concerns regarding insulation failures.Meanwhile,the underlying mechanism behind discharge breakdown failure and nanofiller enhancement under high-frequency electrical stress remains unclear.An electric-thermal coupled discharge breakdown phase field model was constructed to study the evolution of the breakdown path in polyimide nanocomposite insulation subjected to high-frequency stress.The investigation focused on analyzing the effect of various factors,including frequency,temperature,and nanofiller shape,on the breakdown path of Polyimide (PI) composites.Additionally,it elucidated the enhancement mechanism of nano-modified composite insulation at the mesoscopic scale.The results indicated that with increasing frequency and temperature,the discharge breakdown path demonstrates accelerated development,accompanied by a gradual dominance of Joule heat energy.This enhancement is attributed to the dispersed electric field distribution and the hindering effect of the nanosheets.The research findings offer a theoretical foundation and methodological framework to inform the optimal design and performance management of new insulating materials utilized in high-frequency power equipment.
Keywords: dielectric discharge breakdown,high frequency power electronic transformer,polyimide nanocomposites,phase field model
1.Introduction
With the proposal of carbon peaking and carbon neutrality goals,as well as the concept of energy Internet,the deployment of distributed power sources and renewable energy sources is gradually increasing,leading to the construction of a new power system with new energy sources as the main focus,which has become the primary direction for future grid development [1-3].As the crucial physical carrier of new energy power systems,the power electronic transformer (PET) is currently extensively employed in various applications such as AC/DC distribution network hybridization,connecting new energy DC grids,and electric vehicle charging utilizing new energy sources [4,5].However,in conditions of prolonged exposure to high frequency square waves and sine-like waves,the compact structure of PET leads to the concentration of the local electric field,posing a more significant challenge to the insulation performance of PET.
Polyimide (PI) is utilized as the winding insulation material for PET due to its outstanding mechanical properties,high temperature resistance,and radiation resistance [6,7].However,current research on the failure mechanism of polyimide primarily relies on experimental methods,while the high-energy rapid insulation discharge breakdown process is difficult to be analyzed in situ by existing experimental techniques.Gaining a comprehensive understanding of how electric-thermal frequency and dielectric composition influence the failure of polyimide insulation remains a fundamental challenge in high frequency PET insulation.
Niemyeret alintroduced a Dielectric Breakdown Model(DBM) based on fractal theory to simulate discharge electrical tree branches,its primary characteristic is the dependency of breakdown probability on the local electric field within the material [8].Bergeroet alenhanced the DBM and investigated the discharge breakdown behavior in resin composites containing conductor and insulator fillers,respectively [9].Wanget alsubsequently refined the electric tree growth probability equation within the DBM framework to examine the developmental process of electric trees in BaTiO3/PVDF composites with a sandwich structure [10].DBM is capable of effectively simulating discharge,aging,and breakdown phenomena,as well as the dynamics of breakdown evolution.However,the parameters within the model lack physical significance and do not allow for quantitative analysis of the breakdown process.
In the Phase Field Model (PFM),the free energy functional of the material system is constructed by incorporating the interactions of thermodynamic driving forces,including temperature field,composition field,and other external action fields.Consequently,the PFM enables the simulation of the arbitrary organization and intricate evolution of the material’s internal microstructure under the influence of external fields.Presently,PFM finds extensive application in simulating and predicting the microstructure of diverse functional materials.These include grain coarsening and growth,solidification and phase transformation,domain transformation in ferroelectric/ferromagnetic materials,and crack expansion [11-14].
Dielectric discharge breakdown is a highly intricate process.It initiates from areas of concentrated electric fields when the applied electric field surpasses a critical threshold,extending into a penetrating channel.Hong and Pitike utilized the analogy between dielectric breakdown and mechanical fracture to establish the PFM for characterizing the initiation and evolution of dielectric breakdown damage,and examined the impact of nanofillers with varying geometric structures on the evolution of breakdown paths [15].Shenet alperformed phase field simulations of electrostatic breakdown for different microstructure composites and designed PVDF-BaTiO3sandwich structure with high energy density [16,17].Nevertheless,there is currently a limited number of phase field models applicable to the discharge breakdown of composite materials under high frequency stress.
Consequently,this paper presents an electric-thermal coupled discharge breakdown phase field model to investigate the evolution of the breakdown path in polyimide nanocomposite insulation under high-frequency stress.The effects of different influencing factors such as frequency,temperature and nanofiller shape on the breakdown path of PI were studied.Additionally,the failure mechanism of polyimide insulation breakdown and the composite mechanism of nano-modified enhanced insulation at the mesoscopic scale were analyzed.These findings offer a theoretical foundation for the design of new insulation materials customized for high frequency power equipment.
2.Phase field model
2.1.Phase field model for electric-thermal coupled breakdown
The PFM incorporates a continuous scalar phase field variable?(r,t) related to space and time that represents the damage state of polyimide and varies from an undamaged state?(r,t) = 0 to a fully damaged state?(r,t) = 1,with intermediate values between 0 and 1 indicating different degrees of damage in the interface transition region.The skin effect induced surface heating of the winding wire under high-frequency electrical stress is particularly pronounced,and the increase in dielectric loss exacerbates the temperature effect.Consequently,high frequency transformers experience electric-thermal coupled stress during operation,necessitating the inclusion of breakdown damage energy,electrostatic energy,interface energy,and Joule heat energy in the total system free energy functional,which can be expressed as follows
wherefsepis the breakdown damage energy density,fgrad(?)is the interface energy density,felecis the electrostatic energy density,andfjouleis the Joule heat energy density.The breakdown damage energy densityfsepcan be expressed by utilizing the sequential parameter?
whereαis the damage energy coefficient.Equation (2)represents the breakdown damage energy density as a phenomenological double potential well function,where?=0 corresponds to the non-breakdown phase and?= 1 corresponds to the breakdown phase.The value ofαdetermines the magnitude of the energy potential barrier separating the two phases.
The gradient energy term facilitates the diffusion interface between the breakdown phase and non-breakdown phase,
whereγis the energy factor related to breakdown.The gradient energy densityfgradplays a key role both numerically and physically,numerically ensuring the diffusion of the interface and physically describing the contribution of the interface energy.
The electrostatic energy densityfelecis determined by the following equation.
whereε0is the vacuum dielectric constant with a value of 8.85×10⁻¹²F m-1.The space-dependent relative dielectric constants are uniformly interpolated between the undamaged and damaged states as follows
whereεBdenotes the relative dielectric constant of the breakdown phase,εCrepresents the space-dependent relative dielectric constant determined by the material at each position.To distinguish between the polyimide matrix and the nanofiller in the nanocomposite,a non-evolving phase field variableρ(r) is introduced.It takes the value of 0 or 1 to represent the polyimide matrix and the nanofiller,respectively.
whereεFandεMrepresent the relative dielectric constant of the nanofillers and polyimide matrix,respectively.
The dielectric loss power per unit volume under an alternating electric field can be expressed as
whereσis the volume conductivity,Eis the electric field strength,gis the equivalent conductivity of the dielectric under alternating voltage due to relaxation polarization loss,,ωis the angular frequency of the externally applied electric field,τis the relaxation polarization time,andεsandε∞are the static and optical frequency dielectric constants of the dielectric,respectively.
The dielectric loss factor tanδcan be expressed as
By substituting equation (8) into equation (7),the expression for the dielectric loss power per unit volume can be obtained.
The Joule heat energy densityfjoulecan be expressed as
where dtis the period of the applied electric field action.The space-dependent dielectric loss factor tanδ(r) is uniformly interpolated between the undamaged and damaged states as follows
where tanδBdenotes the dielectric loss factor of the breakdown phase,tanδCrepresents the space-dependent dielectric loss factor determined by the material at each position.
where tanδFand tanδMrepresent the dielectric loss factor of the nanofillers and polyimide matrix,respectively.
The evolution of the breakdown is described by the modified Allen-Cahn equation as follows
whereL0is the kinetic coefficient,H(|felec|+|fjoule|-|fint|) is the unit step function,fintis the critical energy density causing insulation damage,which can be expressed asfint=1/2εrEb2+2πfεrtanδEb2dt,Ebis the intrinsic breakdown field strength.
The driving forces resulting from breakdown damage energy,electrostatic energy,and Joule heat energy are expressed as
2.2.Fourier spectral method
The Fourier spectral method is commonly employed in PFM due to its excellent convergence and efficient solution.It converts the partial differential equation in real space to an algebraic equation in Fourier space through Fourier transform.The solution in real space is then obtained by applying Fourier inverse transform to the solution in Fourier space[18].Firstly,equation (13) is discretized
Secondly,the Fourier transform is applied to both sides of equation ( 17)
where γ?2?ncan be initially computed in Fourier space and subsequently transformed back to real space using Fourier inverse transform as follows
Finally,by substituting equation ( 19) into equation ( 18),the reformulated expression is as follows
The electric field distribution inside the material is determined by solving the Poisson equation using the spectral iterative perturbation method [19].
whereρf(r) is the free charge density.The relative dielectric constant can be expressed as the sum of the homogeneous partε0and the inhomogeneous perturbation Δε(r),i.e.,ε(r) =ε0+Δε(r).Additionally,the depolarizing potential?and the depolarizing electric fieldEd(r) = -??are introduced.
Equation (21) can be reformulated to derive
whereEextis the applied electric field.Assuming that Δε(r) =0,then
The above equation is transformed into Fourier space for solution,
The total electric field in a two-dimensional space can be calculated by applying the Fourier inverse transform to obtain the solution in real space.
When considering the single-step evolution equation (13),equation (22) is iteratively solved in Fourier space to obtain a solution with a relative error of less than 10-4.
2.3.Verification of the model
The proposed phase field simulation model was validated by initially conducting a breakdown process simulation in a pure polyimide matrix.The characteristic length and time can be determined using material parametersαandγ,as well as kinetic parametersL0.The expressions for the characteristic length and time are given byandt0= 1/(L0α),respectively.Here,the values forγ,α,andL0are given asγ=10-10J m-1,α= 108J m-3,andL0= 1 m2s-1N-1.In this model,the relative dielectric constant of polyimideεMis set to 3.2.To account for the impact of temperature on breakdown field strength and dielectric loss,the intrinsic breakdown field strength is determined by the expression 450-1.14×(T-298) kV mm-1[20].Additionally,the dielectric loss factor is interpolated with respect to temperature using the following table: {(300 K,0.0019),(400 K,0.0097),(500 K,0.0681)} [21].A relatively large but finite relative dielectric constantεB= 104is chosen to represent the conductive properties of an insulating material following complete breakdown.The geometry of the phase field simulation model is shown in figure 1.The simulation utilizes a grid resolution of 256×256,where each grid cell corresponds to a dimension of 1 nm in both thexandyaxes.To simulate the occurrence of internal breakdown resulting from defects within the material,a small square region (indicated in red) with a side length of 12 nm is introduced at the center of the square sample (represented by the green area) as the initial nucleation site.The dielectric constant within the small square is assigned a value of 104.
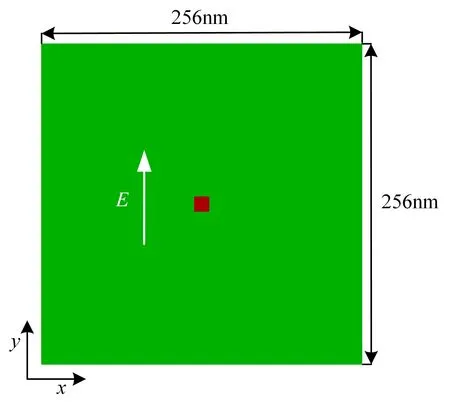
Figure 1.The geometry of the phase field simulation model.
Figure 2 illustrates the progressive evolution of the breakdown path when an electric field is applied along theydirection.In the case of a low applied electric field,despite the presence of an initial nucleation region,the maximum field strength remains below the intrinsic breakdown field strength of polyimide,resulting in a lack of breakdown development.However,once the electric field strength reaches 225 kV mm-1,the breakdown phase initiates and expands.As the applied electric field gradually increases,the length of the breakdown damage path extends,accompanied by an accelerated breakdown development speed and a widening of the path.
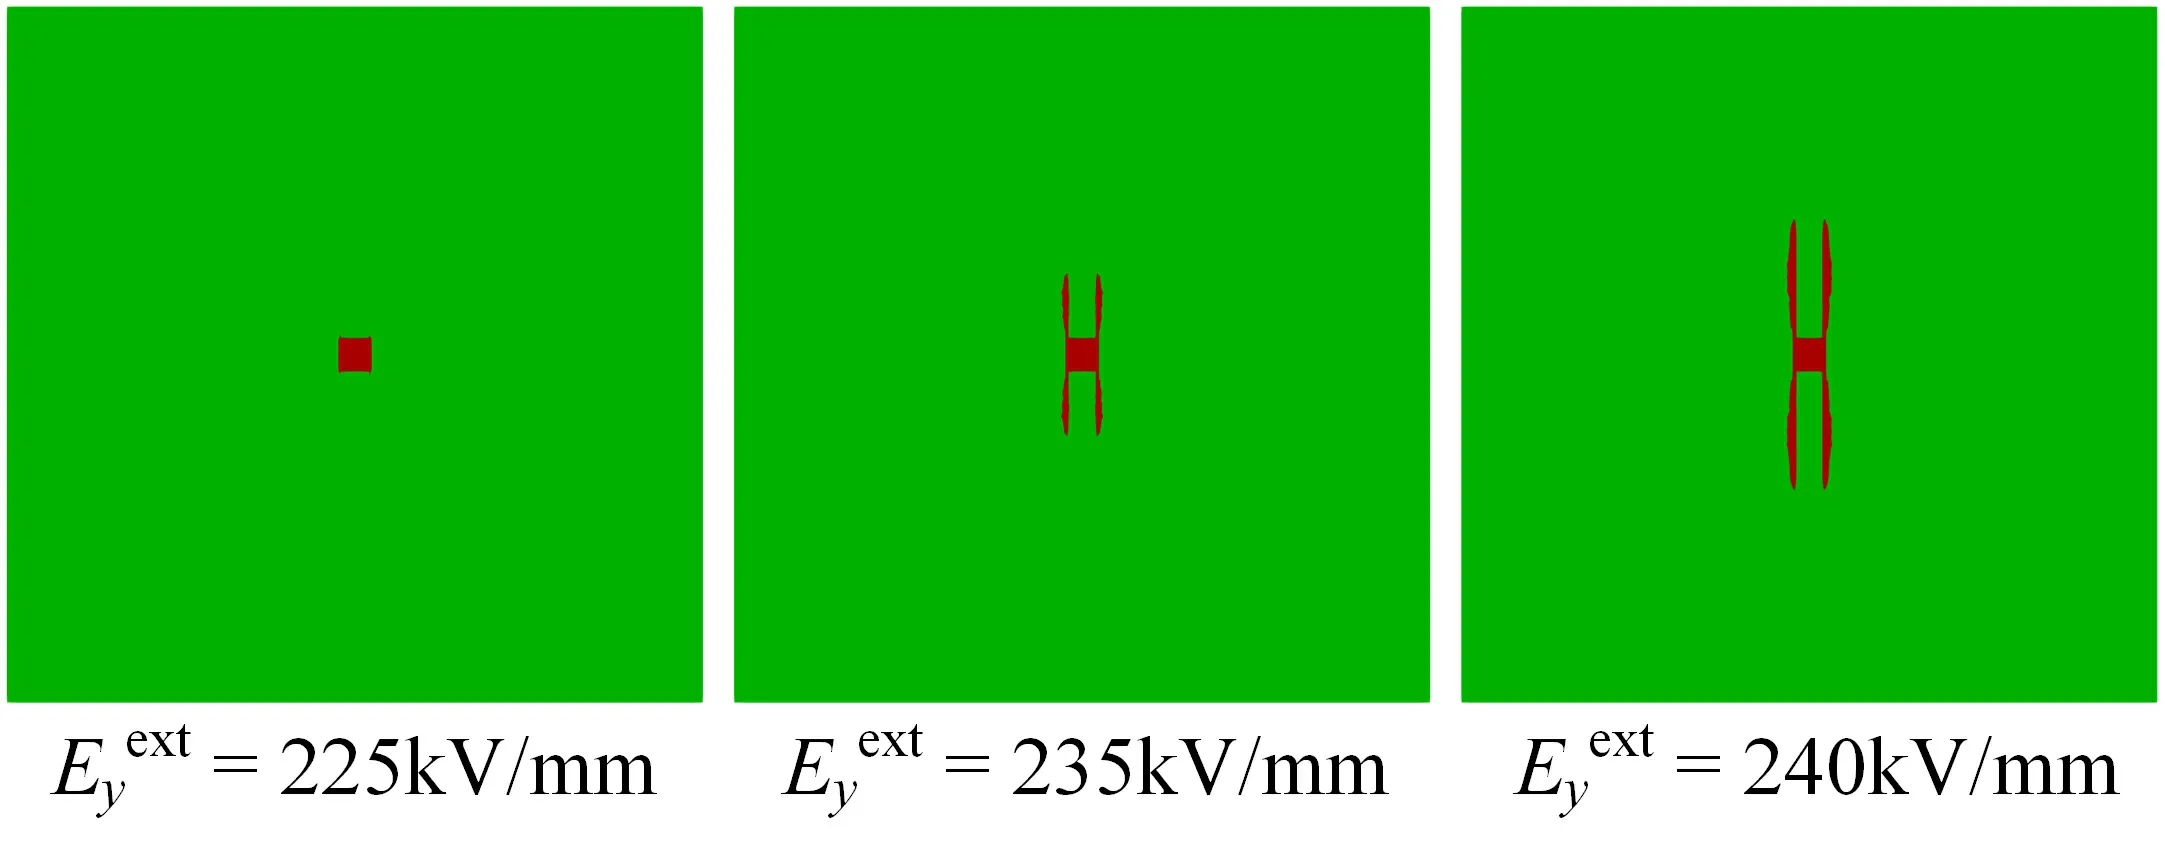
Figure 2.The progressive evolution of the breakdown path when an electric field is applied along the y-direction.
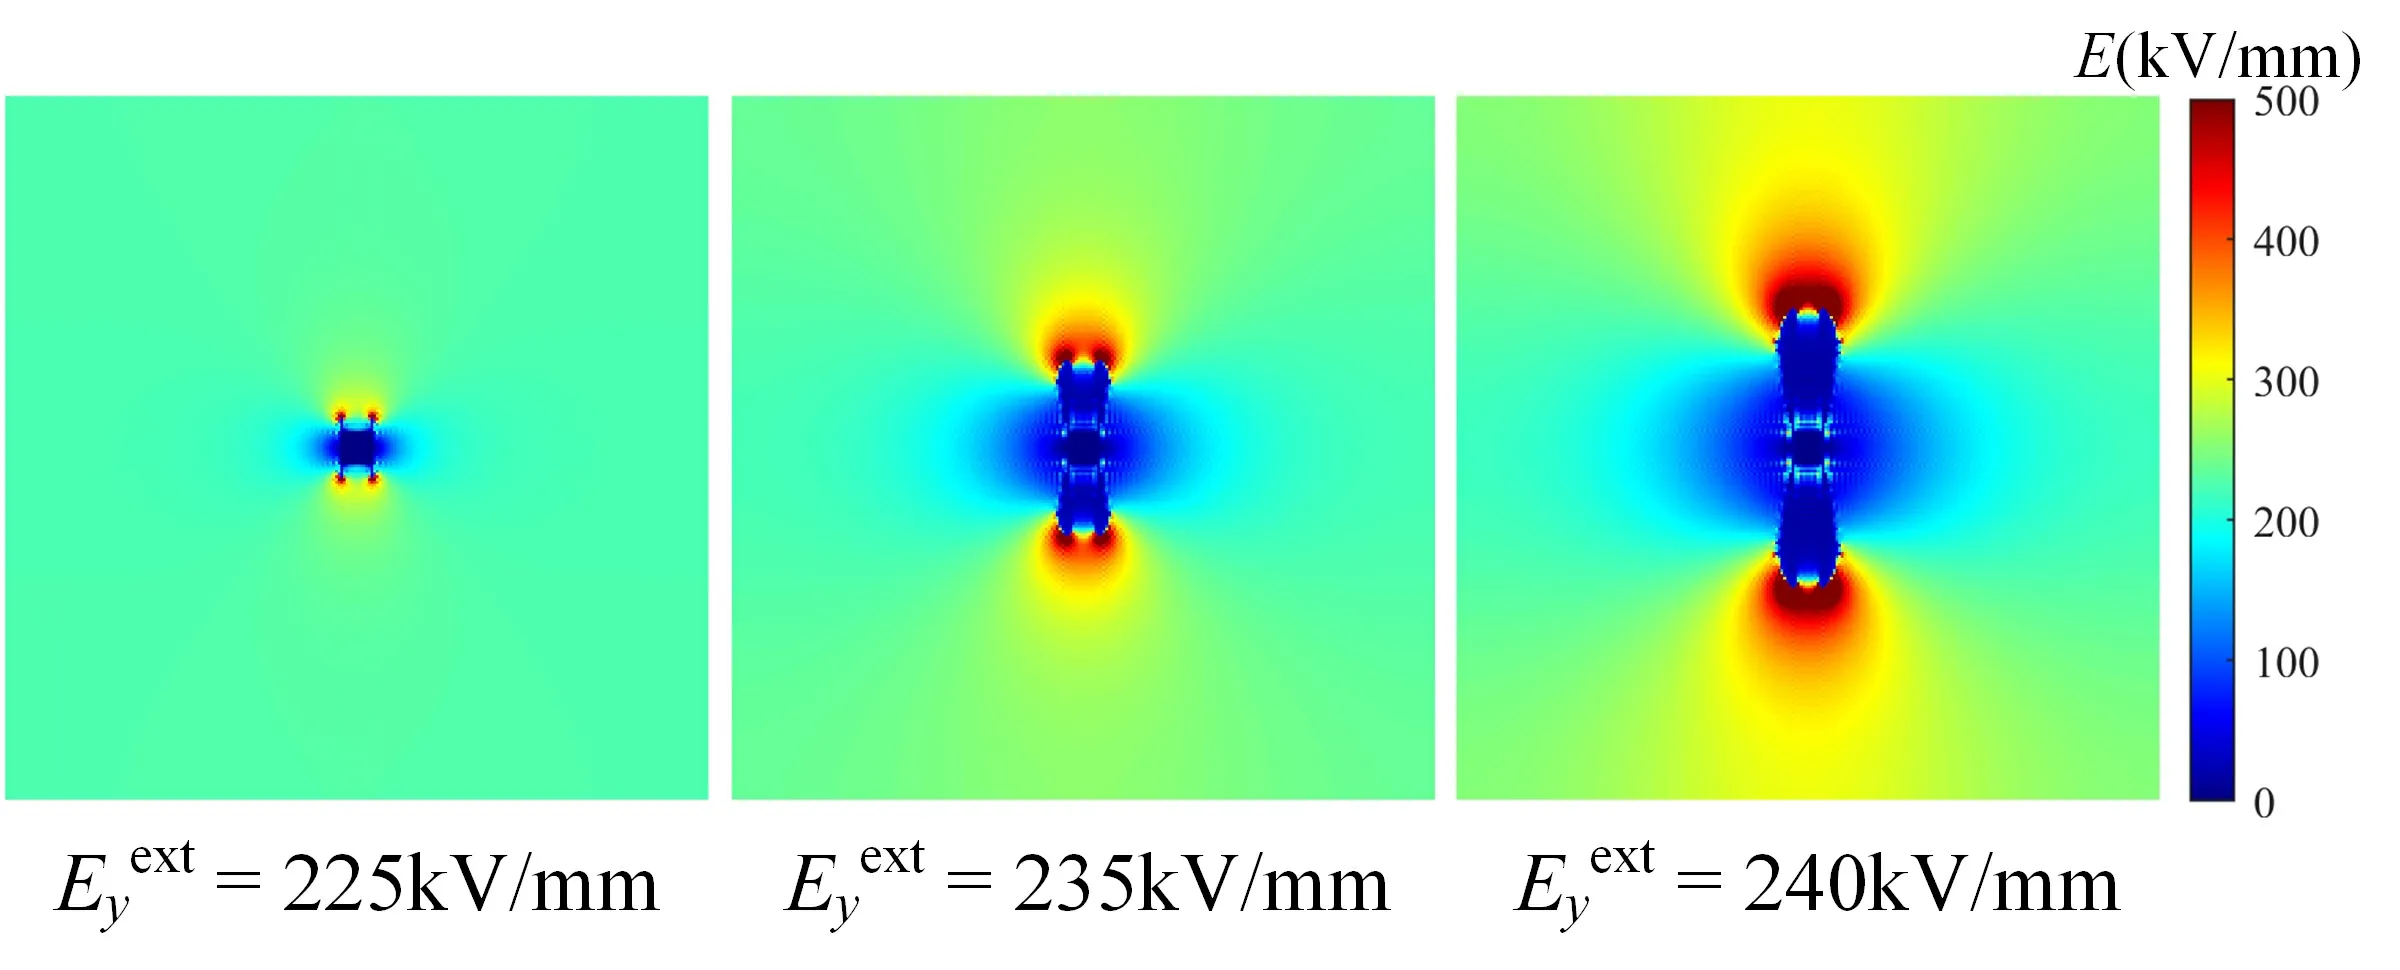
Figure 3.The local electric field distribution during the evolution of the breakdown phase.
To gain deeper insights into the intrinsic mechanism,the local electric field distribution during the evolution of the breakdown phase is shown in figure 3 due to the strong correlation between the breakdown phase and the electric field distribution.The analysis of the local electric field distribution reveals that the field strength near the end of the breakdown path,in the direction of the electric field,surpasses those of other regions.Furthermore,the breakdown path expands along the region with a higher local electric field strength.With the gradual increase in the applied electric field strength,the local electric field strength at the forefront of the breakdown phase steadily intensifies.Additionally,the high field strength region experiences a slight expansion,accounting for the accelerated breakdown speed and the widened breakdown path.Moreover,as the breakdown phase progresses,the local electric field strength within the breakdown region is significantly lower than the applied electric field strength.This discrepancy arises from the substantial difference in dielectric constants between the breakdown and non-breakdown phases,resulting in a larger depolarization electric field.
The phase field simulation results of polyimide breakdown demonstrate that the proposed polyimide breakdown phase field model well describes the evolution of the breakdown path within the polyimide matrix when subjected to an externally applied electric field.Moreover,it provides detailed insights into the electric field evolution during the breakdown process,which aligns well with existing theoretical and experimental findings on electric breakdown phenomena.
Additionally,the introduction of the deterioration factorβenables a comparison between simulation and experimental outcomes [20].The factor measures the reduction in breakdown field strength with temperature changes.Mathematically,it is defined as follows:,wheredenotes the breakdown field strength of the composite dielectric at 298 K,andis the breakdown field strength at given temperature,and the deterioration factorβtakes a value in the range of 0-1.Figure 4 presents a comparison between simulated deterioration factor values for PI at varying temperatures and experimental data from reference [22].Notably,as the temperature elevates from 298 K to 473 K,the outcomes of the phase field simulation align well with the experimental measurements,confirming the accuracy and validity of the proposed simulation model in this study.
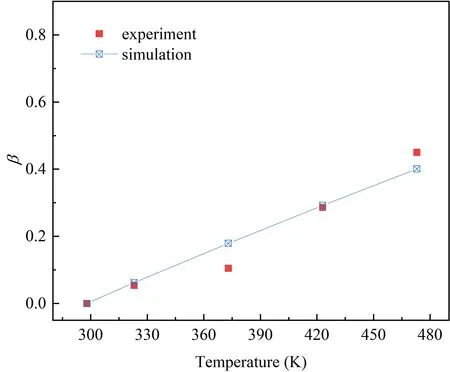
Figure 4.Comparison between simulated deterioration factor values for PI at varying temperatures and experimental measurements.
3.Results and discussion
3.1.Effect of different frequencies on breakdown path
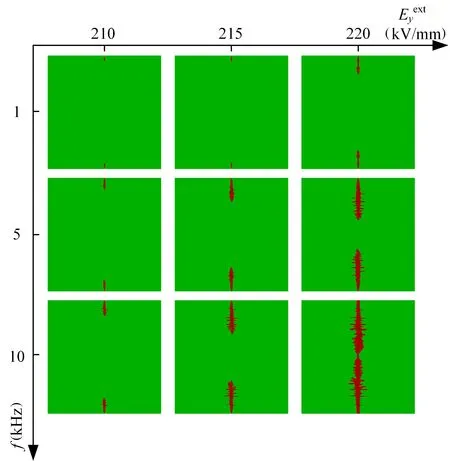
Figure 5.The breakdown evolution paths of polyimide at 1 kHz,5 kHz,and 10 kHz.
Investigation of the effect of electric field frequencies on the breakdown path of polyimide was conducted at frequencies of 1 kHz,2.5 kHz,5 kHz,7.5 kHz,and 10 kHz,with a temperature of 400 K.An initial nucleation region with a side length of 2 nm was positioned at the center of the upper and lower boundaries.The breakdown evolution paths of polyimide at 1 kHz,5 kHz,and 10 kHz are shown in figure 5,which illustrates the gradual growth of the breakdown phase from the initial nucleation sites at both ends in response to the applied electric field.Figure 5 clearly demonstrates that the breakdown path exhibits a significantly faster development rate at higher frequencies.To provide a clearer representation of the effect of frequency on breakdown development,the breakdown length ratio is defined as the ratio between the projected length of the current breakdown region along the electric field direction and the total length of the model.The variation of the breakdown length ratio with the applied field strength at different frequencies is statistically shown in figure 6(a).The breakdown process exhibits a clear non-linear growth trend with the applied field strength,starting with a gradual increase and then accelerating sharply.This can be attributed to the slow development of the breakdown path in the early stage,characterized by a small breakdown phase and weak local electric field.However,as the breakdown path evolves,the distortion of the electric field distribution intensifies,leading to increased loss within the breakdown channel and accelerating the evolution of the breakdown phase.Figure 6(b) illustrates that with increasing frequency,the applied field strength at complete breakdown gradually decreases,exhibiting an initial rapid decline followed by a slower decrease.This suggests a diminishing accelerating effect of higher frequencies on the breakdown process.Reference [23]concluded experimentally that the PI breakdown field strength decreases with increasing frequency,which is consistent with the results of the phase field simulation in this paper.
The evolution curves of the average electrostatic energy density and the average Joule heat energy density of the model with the applied field strength are shown in figure 7.The average energy density,denoted asis computed as the integral of electrostatic energy density and Joule heat energy density across the entire computational domain divided by its volume.The figure clearly illustrates the gradual growth of both electrostatic energy density and Joule heat energy density during the initial stage of evolution,followed by a sharp increase in the later stage.This phenomenon arises due to the correlation between the electric field strength and the magnitudes of electrostatic energy density and Joule heat energy density.As the breakdown progresses,the electric field at the leading edge of the breakdown intensifies,leading to a corresponding amplification of electrostatic energy density and Joule heat energy density.The continued increase in these energy density components drives the ongoing evolution of the breakdown phase,with Joule heat energy ultimately assuming numerical dominance during the later stages.Both electrostatic energy and Joule heat energy density exhibit an increasing trend with frequency.However,the effect of frequency on Joule heat energy density is direct.Higher frequencies result in greater polarization and conductivity losses,leading to increased heat generation.Moreover,the total energy increase accelerates the progression of the breakdown path,resulting in faster path development under the same applied field strength.Consequently,the local electric field strength at the leading edge of the path is amplified,indirectly influencing the electrostatic energy density and causing its augmentation.
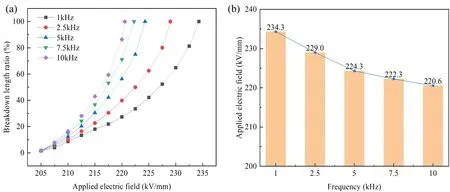
Figure 6.The variations of (a) the breakdown length ratios with the applied field strength and (b) the complete breakdown field strength at different frequencies.
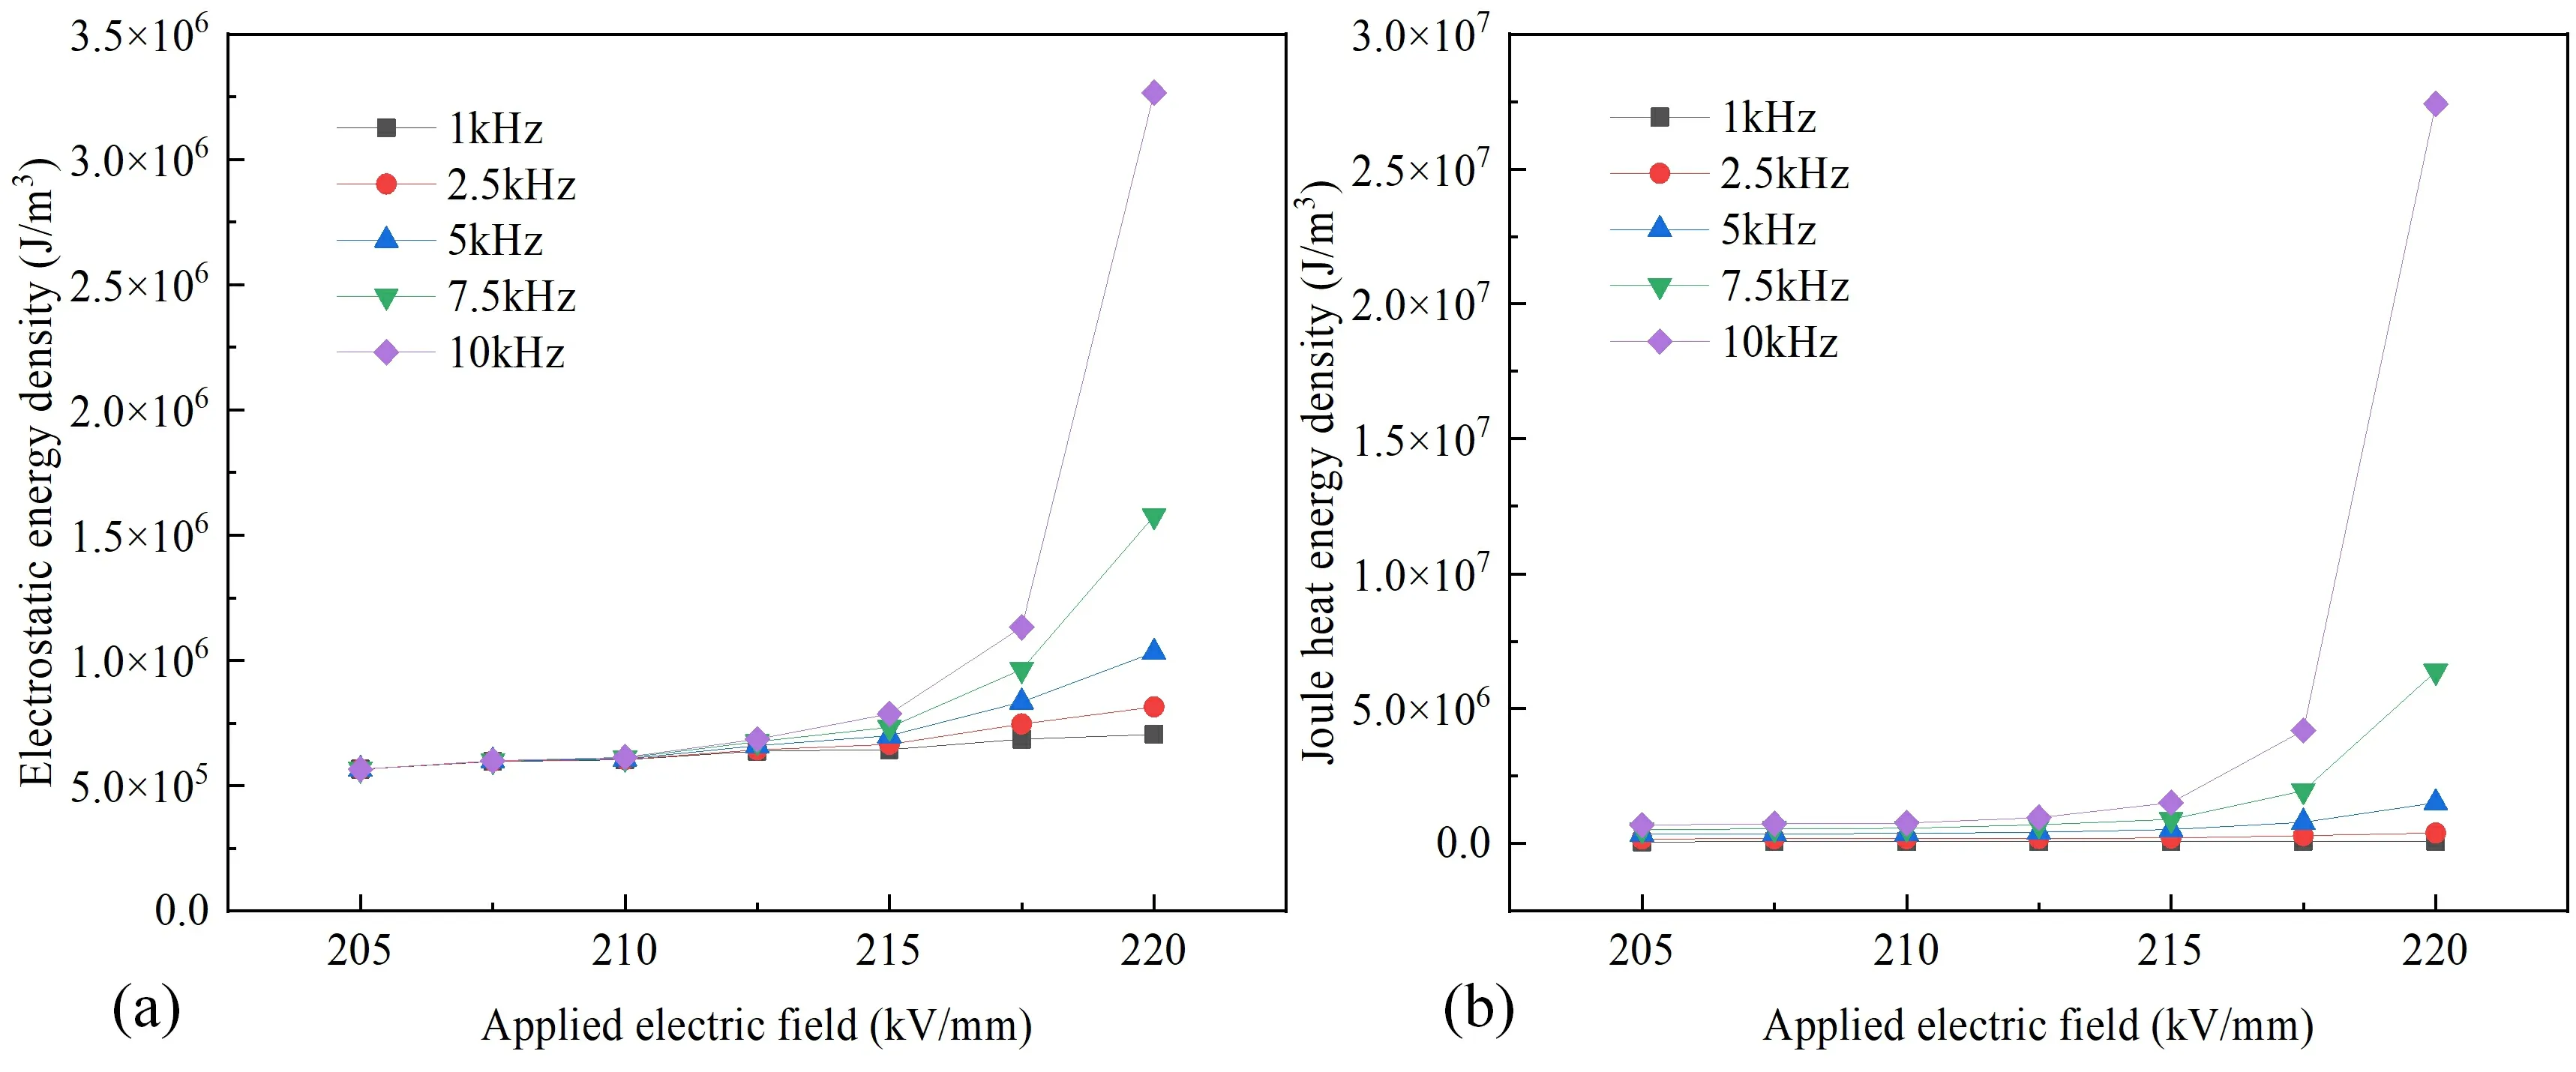
Figure 7.The variations of energy densities with applied field strength at different frequencies.(a) Average electrostatic energy density,(b) average Joule heat energy density.
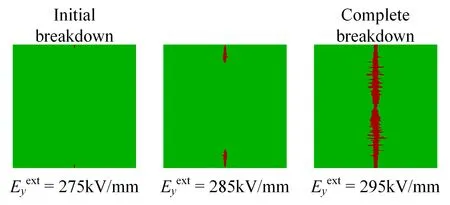
Figure 8.The evolution of the polyimide breakdown path at 300 K.
3.2.Effect of different temperatures on breakdown path
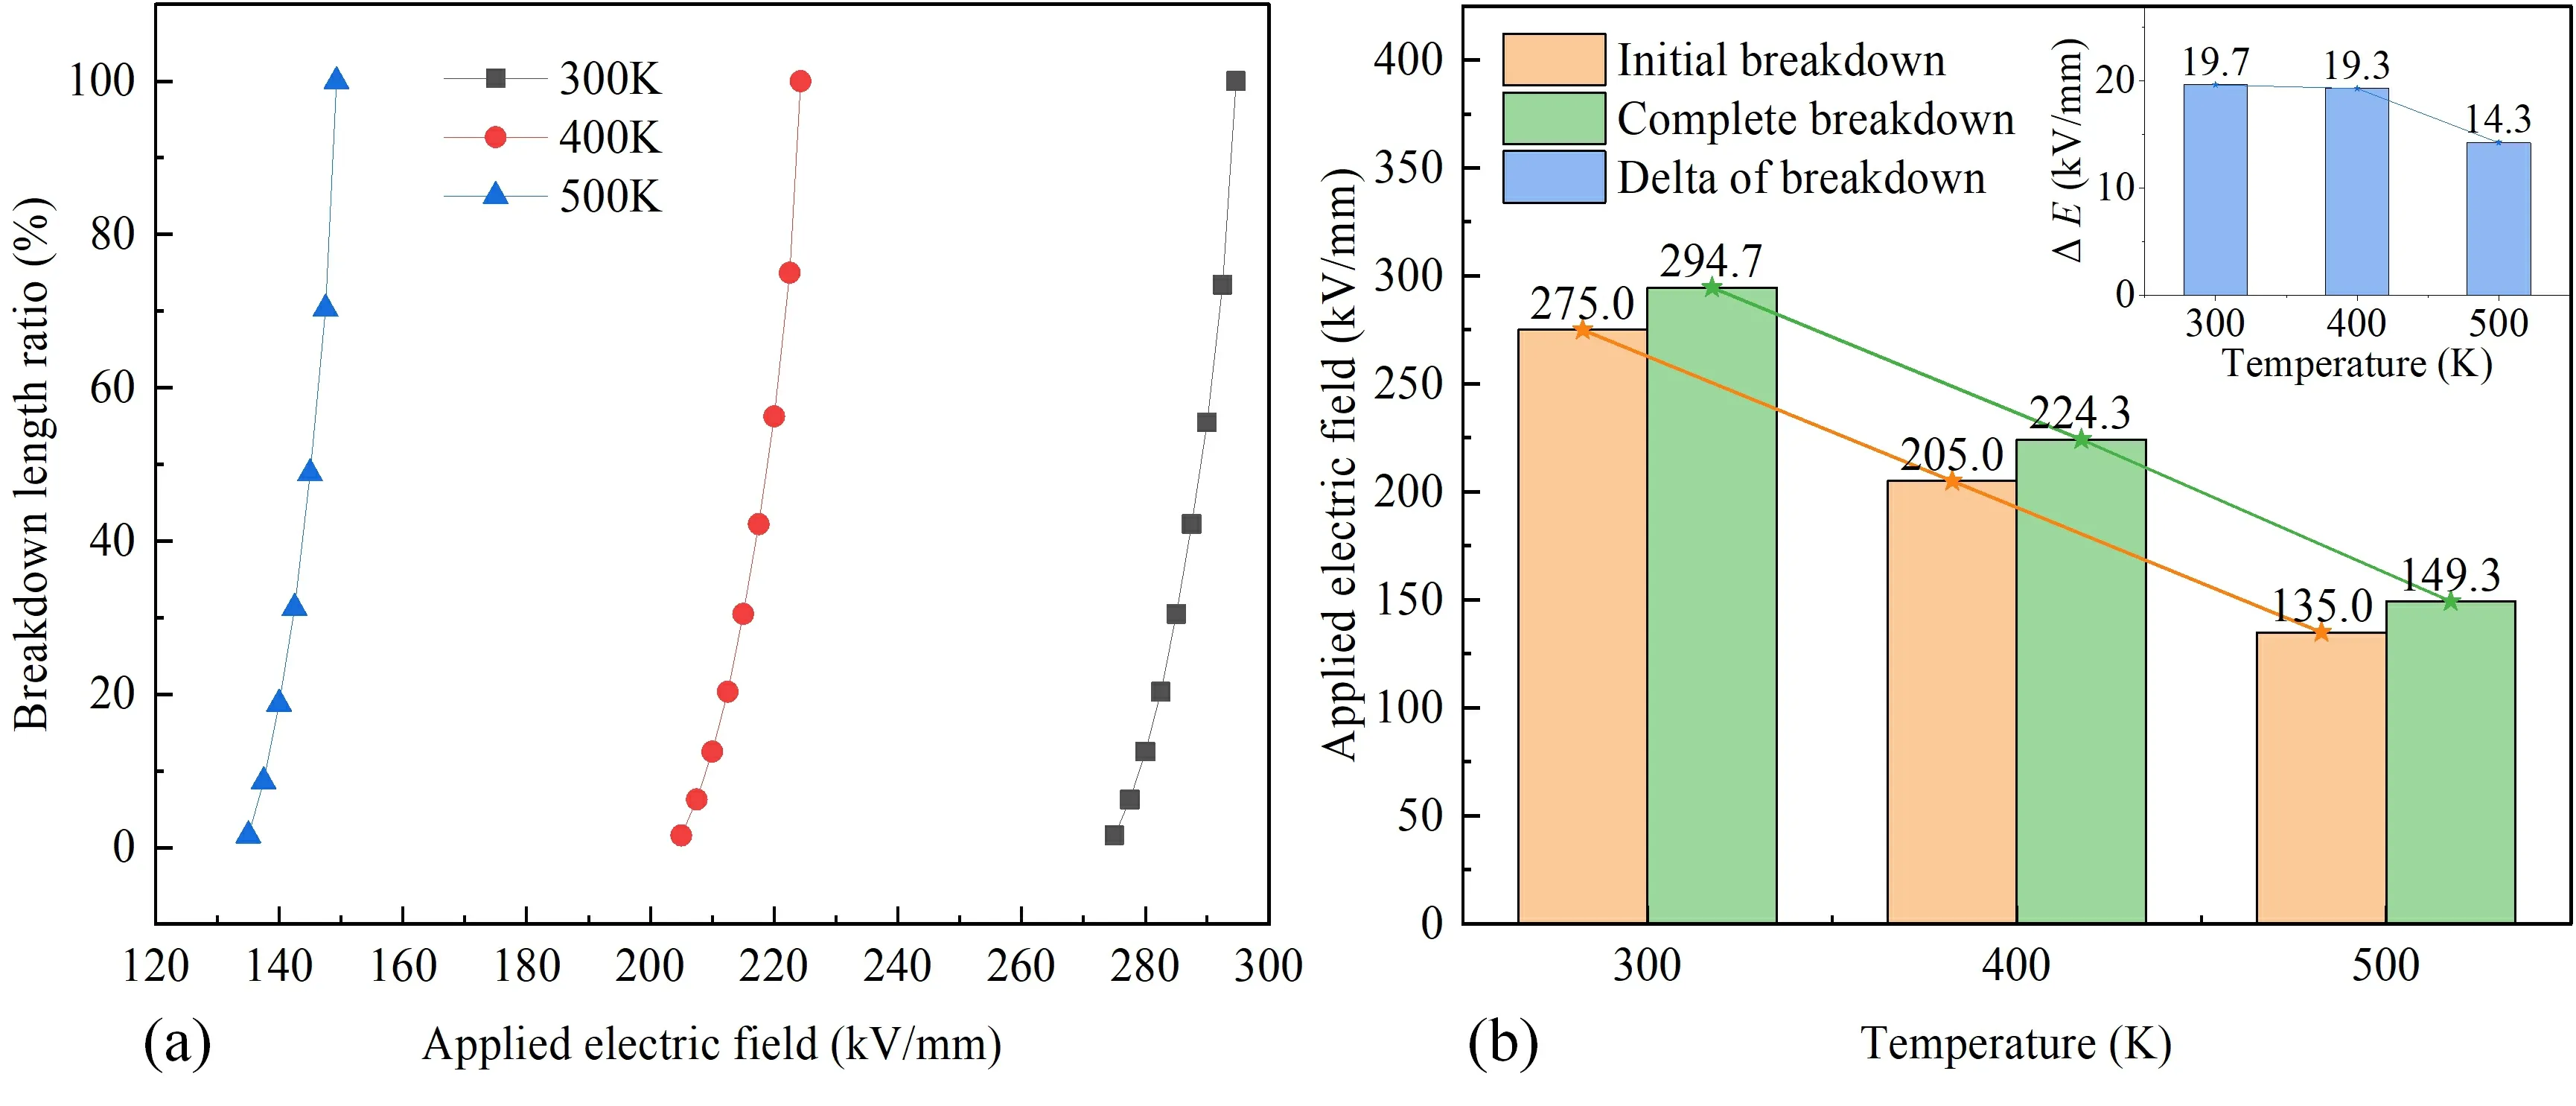
Figure 9.(a) Breakdown length ratios and (b) initial/complete breakdown field strengths of polyimide models at different temperatures.
This section examines the effect of temperature on the breakdown path of polyimide by investigating its evolution at 300 K,400 K,and 500 K under a frequency of 5 kHz,using the electric-thermal coupled phase field model.Figure 8 illustrates the evolution of the polyimide breakdown path at 300 K.The initial breakdown field strength is the applied field strength at the onset of breakdown path evolution,while the complete breakdown field strength corresponds to the applied field strength when the breakdown path fully develops.The difference between the complete breakdown field strength and the initial breakdown field strength is denoted as ΔE.Figure 9 presents the breakdown length ratio,initial breakdown field strength,and complete breakdown field strength of polyimide at different temperatures.It is observed that as the temperature increases,both the initial and complete breakdown field strengths gradually decrease.Specifically,the initial breakdown field strengths at 400 K and 500 K are 25.5% and 50.9% lower,respectively,than that at 300 K.Similarly,the complete breakdown field strengths are 23.9% and 49.3% lower,respectively,than that at 300 K.Furthermore,ΔEexhibits a decreasing trend with increasing temperature,with the most significant decrease observed at 500 K.This phenomenon occurs due to the significant rise in the dielectric loss factor of PI at 500 K in comparison to 400 K.This increase facilitates a substantial surge in Joule heat energy,thereby expediting the progression of the breakdown path.This finding aligns with the conclusion from reference [22],which states that the breakdown field strength of PI decreases gradually with rising temperature,leading to an accelerated breakdown rate.
Figure 10 shows the variations of the energy densities with the applied electric field at different temperatures.It can be clearly seen that the average electrostatic energy density and the average Joule heat energy density increase as the applied electric field intensifies during the dynamic evolution of the breakdown phase at each temperature,which provides a constant internal driving force for the growth of the breakdown phase during the phase transition of the model.Both the electrostatic energy densities at the initial breakdown and at the complete breakdown exhibit a decreasing trend with increasing temperature,primarily attributed to the reduced breakdown field strength at higher temperatures.However,the behavior of Joule heat energy density with temperature differs,as the Joule heat energy density at the initial breakdown increases with temperature,while it decreases at the complete breakdown.This phenomenon is attributed to the rise in Joule heat energy resulting from the temperature-dependent dielectric loss factor.As the temperature increases,the Joule heat energy becomes more significant compared to the driving force provided by the electrostatic energy,allowing the breakdown to occur at lower electric field strengths.
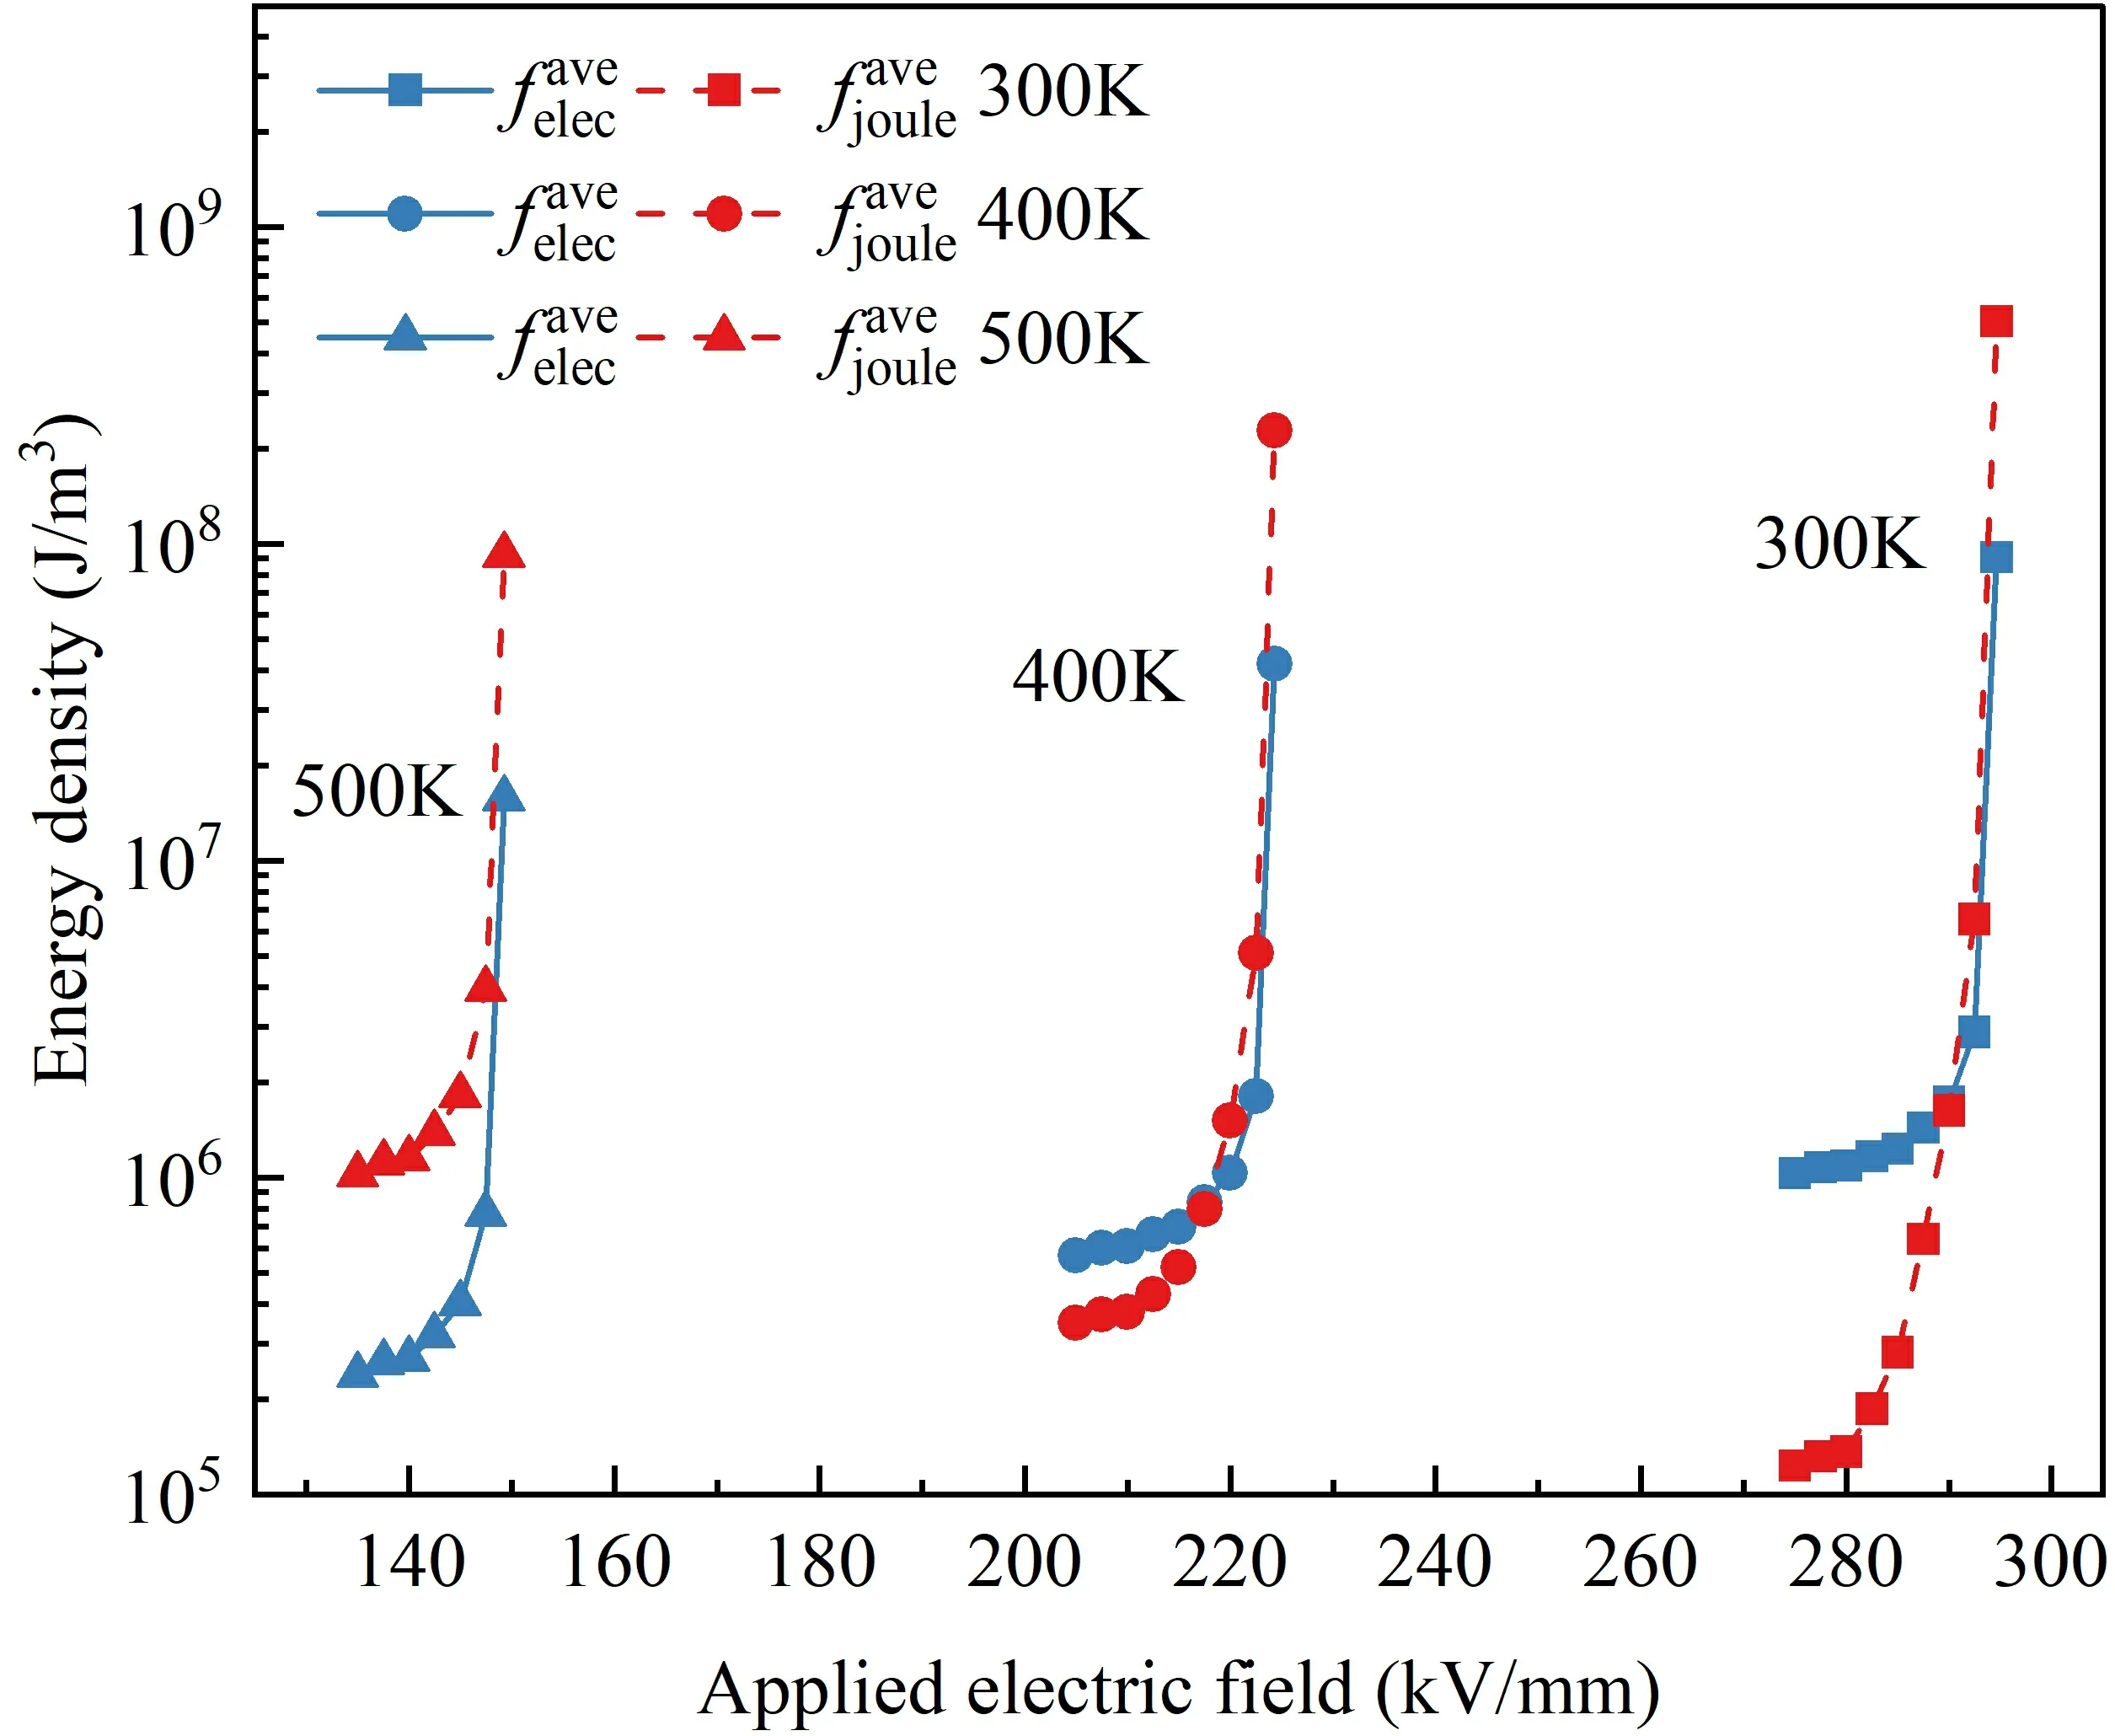
Figure 10.The variations of the energy densities with the applied electric field at different temperatures.
3.3.Effect of different nanoparticle shapes on breakdown path
This work utilizes PI-SiO2composites as a case study to investigate the effect of various nanofiller shapes on the breakdown path of PI composites.The Poisson Disk Sampling algorithm was employed to generate three microstructure models of composite materials with doped circle nanoparticles (PI_circle),nanosheets aligned parallel to the electric field direction (PI_parallel),and nanosheets aligned vertical to the electric field direction (PI_vertical).The filler area fraction was maintained at a constant value of 10% for all models.The filler is assigned a relative dielectric constant of 3.9 and an intrinsic breakdown field strength of 1000 kV mm-1[24].The nanoparticles have a diameter of 10 nm,and the nanosheets have dimensions of 25 nm×3 nm.
Figure 11 illustrates the electric field distribution of the three nanocomposite models when the electric field is applied along they-direction.It is evident that the high field strength regions of all three composite models emerge at the end of the nanofiller in they-direction.The PI_parallel model exhibits a higher concentration of the high field strength region compared to the PI_circle model,while the PI_vertical model displays a more dispersed distribution.Furthermore,the PI_parallel model has a smaller spacing between the nanosheets along they-direction,resulting in the proximity of their ends and the subsequent overlap of the electric field concentration region at the interface.Conversely,the PI_vertical model features a larger spacing between the nanosheets along they-direction,leading to minimal overlap of the high field intensity regions at the nanosheet ends and resulting in a more uniform distribution of field strength throughout the model.
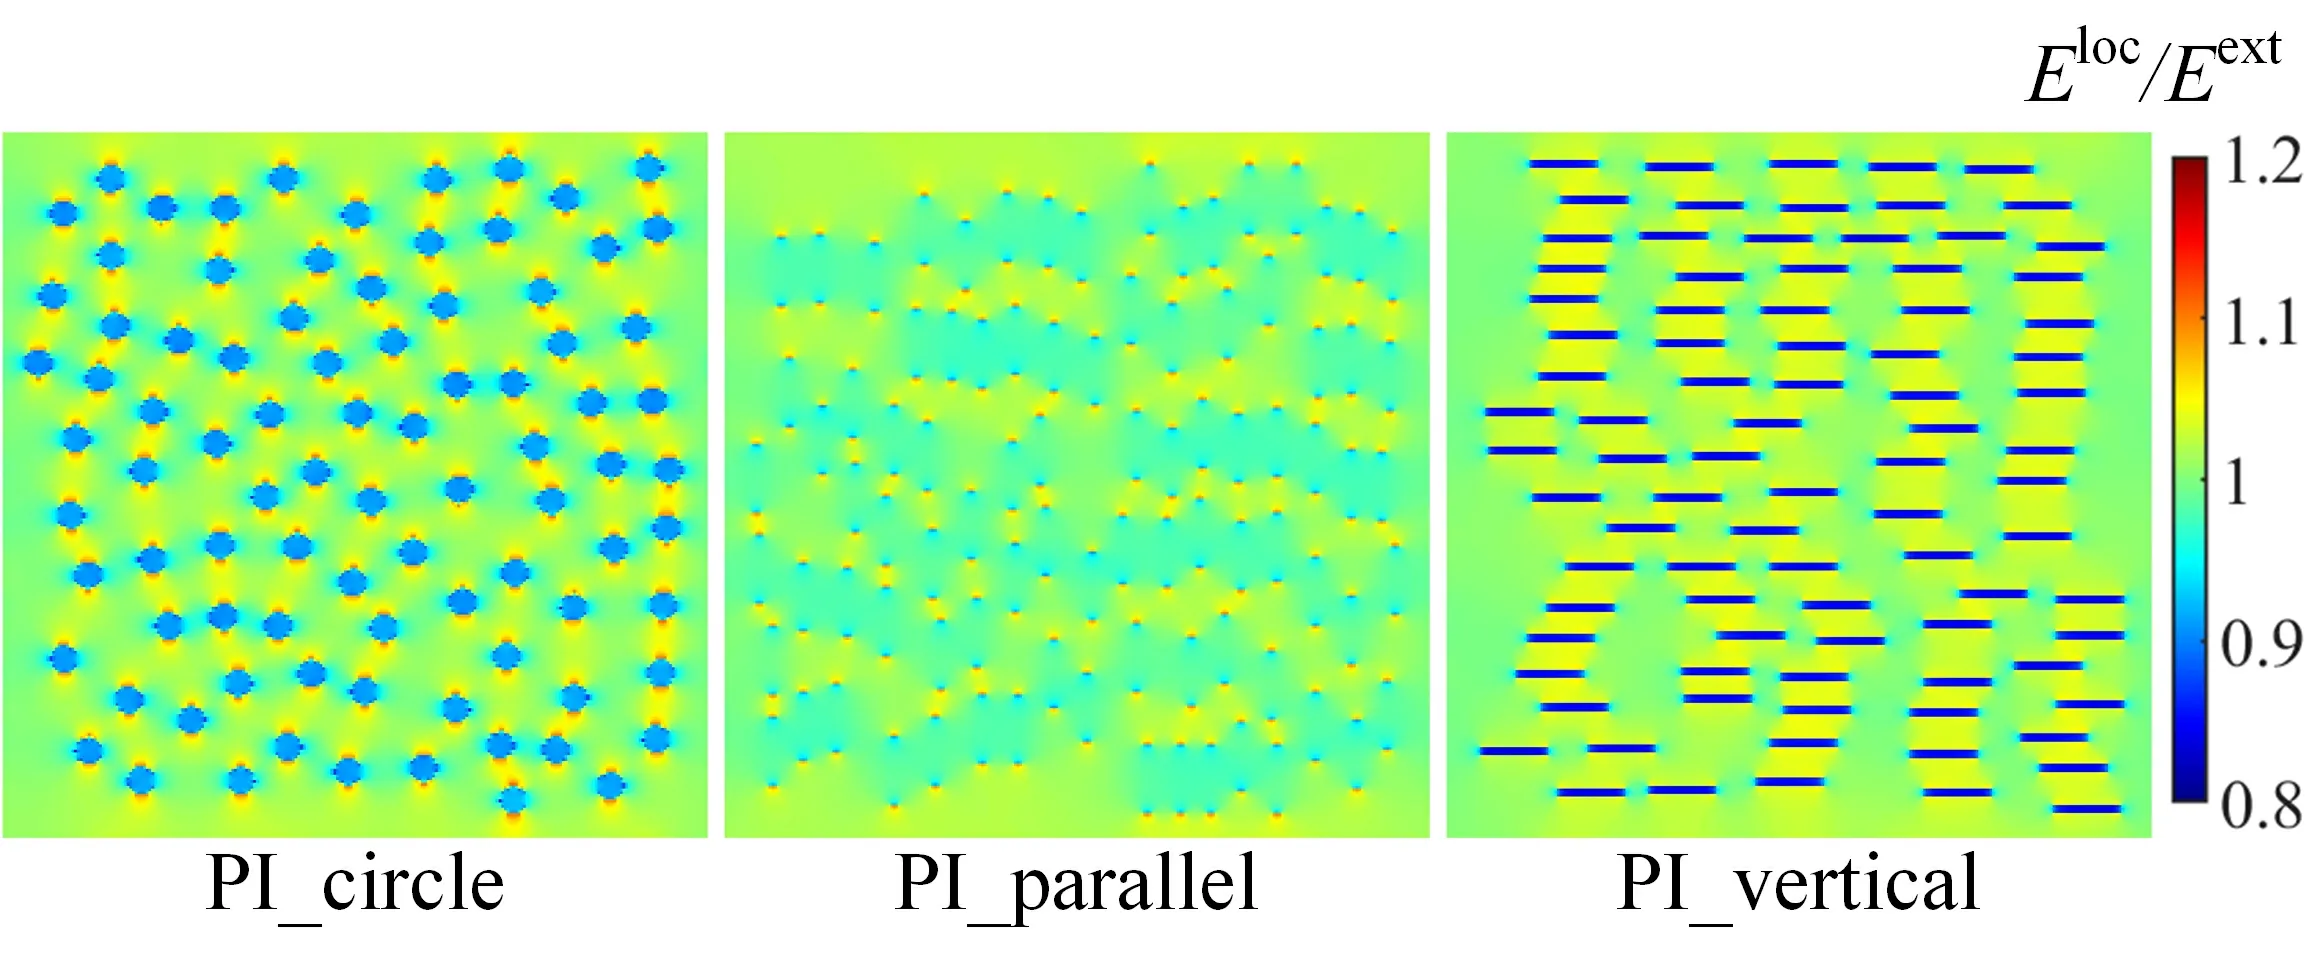
Figure 11.The electric field distribution of the three nano-composite models when the electric field is applied along the y-direction.
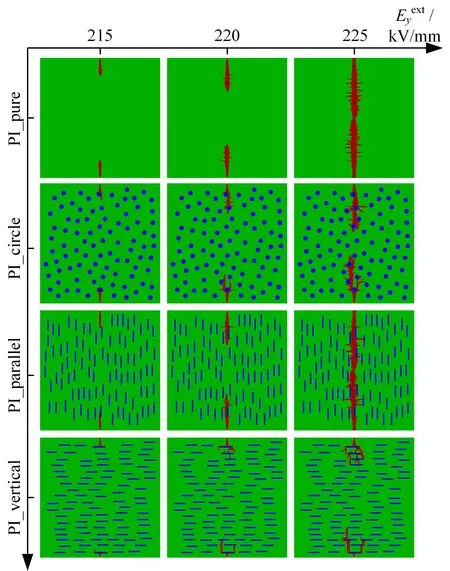
Figure 12.The evolution of the breakdown path for pure polyimide and three nanofiller doped composites.
The evolution of the breakdown path for pure polyimide and three nanofiller doped composites at a temperature of 400 K and a frequency of 5 kHz is shown in figure 12.In the figure,the nanofiller is represented by the blue area,the polyimide matrix is represented by the green area,and the breakdown path is highlighted in red.The breakdown process is observed to be faster in the pure polyimide(PI_pure) and PI_parallel models compared to the PI_circle and PI_vertical models.This finding aligns with the conclusion in the reference [25] which states that the addition of SiO2circle particles enhances the electric breakdown strength of PI compared to pure polyimide.In the PI_circle and PI_vertical models,as the breakdown phase approaches the nanofiller,it encounters a hindrance akin to a "wall" due to the elevated intrinsic breakdown field strength of the nanoparticles.Consequently,the breakdown path is compelled to circumnavigate the nanofiller.Notably,the PI_vertical model exhibits a more pronounced hindrance effect.The nanoparticles of the PI_parallel model align parallel to the breakdown path direction,and the crosssection of their ends is too small to play a role in hindering the breakdown path to make them circumvent.This limitation makes it difficult for PI_parallel to increase the complete breakdown field strength.
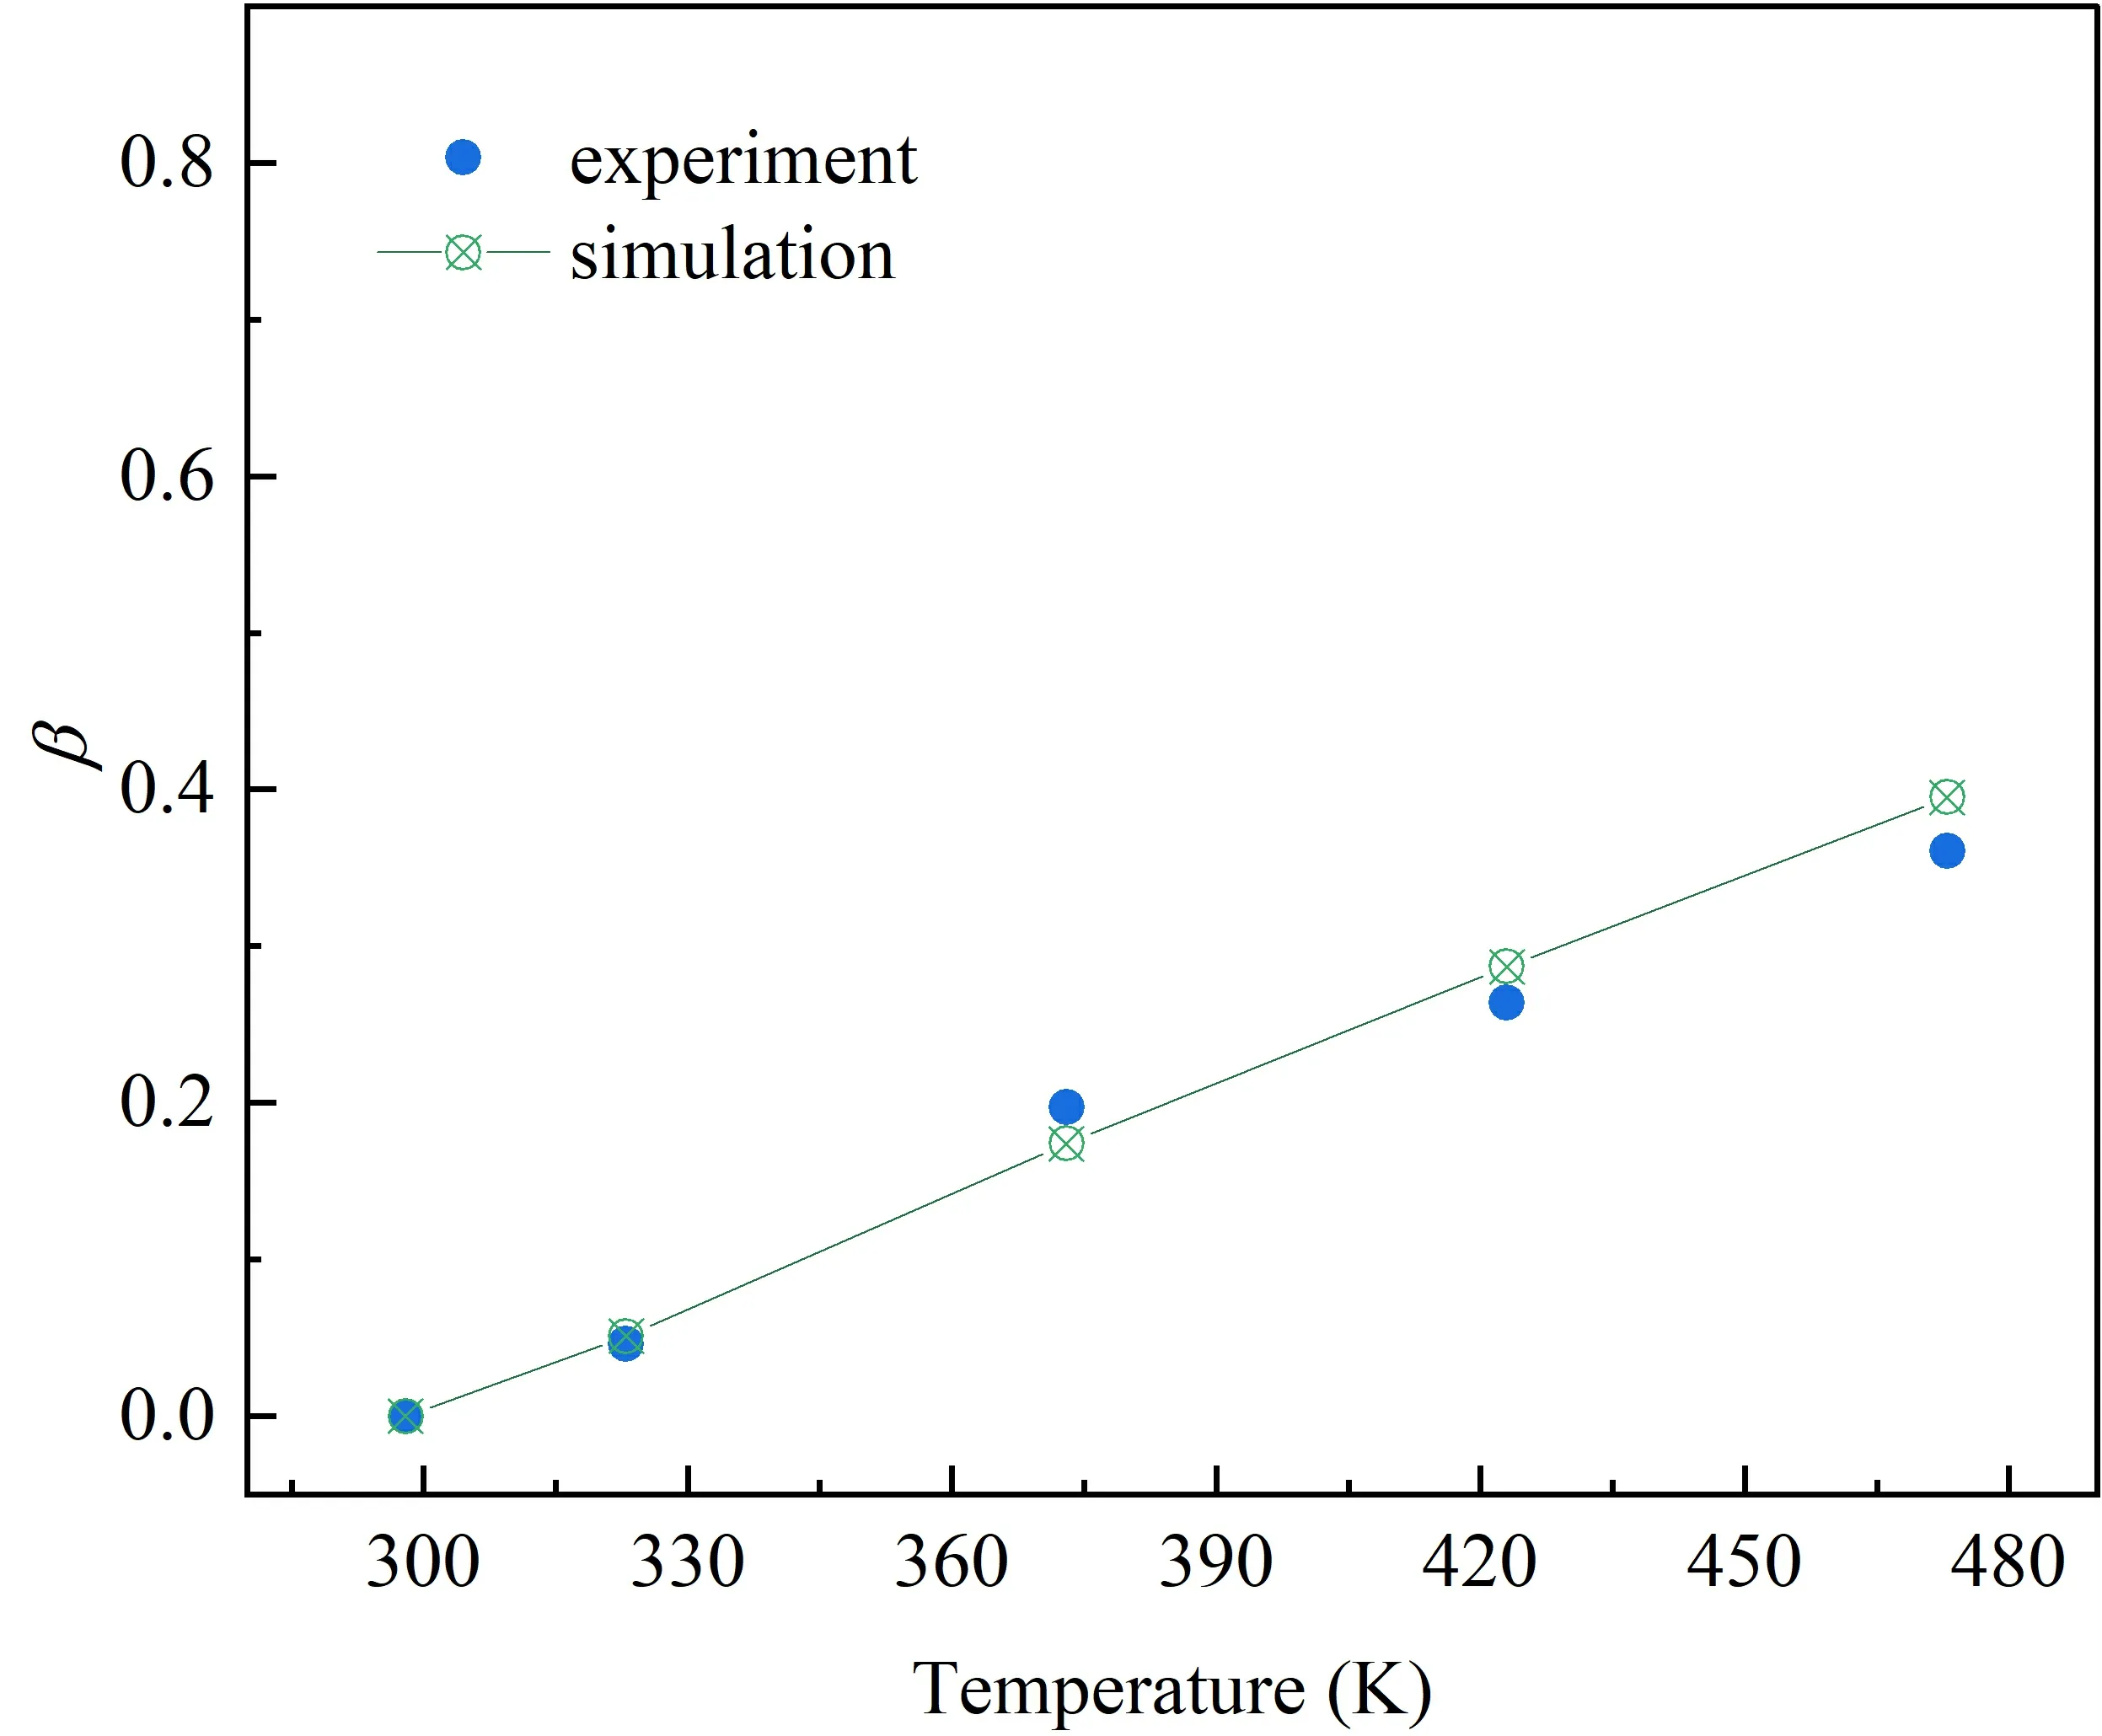
Figure 14.Comparison between the simulated predicted deterioration factor of the PI_circle model and the experimental value of PI doped SiO2 particles
Figure 13 presents the breakdown length ratios,along with the initial and complete breakdown field strengths,of the pure polyimide and three different filler composite models.This analysis serves to provide a deeper understanding of the effect of nanofiller shape on the breakdown evolution within the composites.The breakdown length ratio exhibits an approximate exponential increase across all models.The PI_vertical model exhibits the highest complete breakdown field strength,with ΔEincreased by 40.2%compared to PI_pure model.Moreover,it demonstrates a pronounced growth hysteresis under low applied electric field conditions,primarily attributed to the robust obstructive impact of the vertical nanosheets on the breakdown path.The PI_circle model exhibits the second highest complete breakdown field strength,experiencing a 10.9%increase in ΔEcompared to the PI_pure model.In contrast,the PI_parallel model has the same complete breakdown field strength as the PI_pure model.
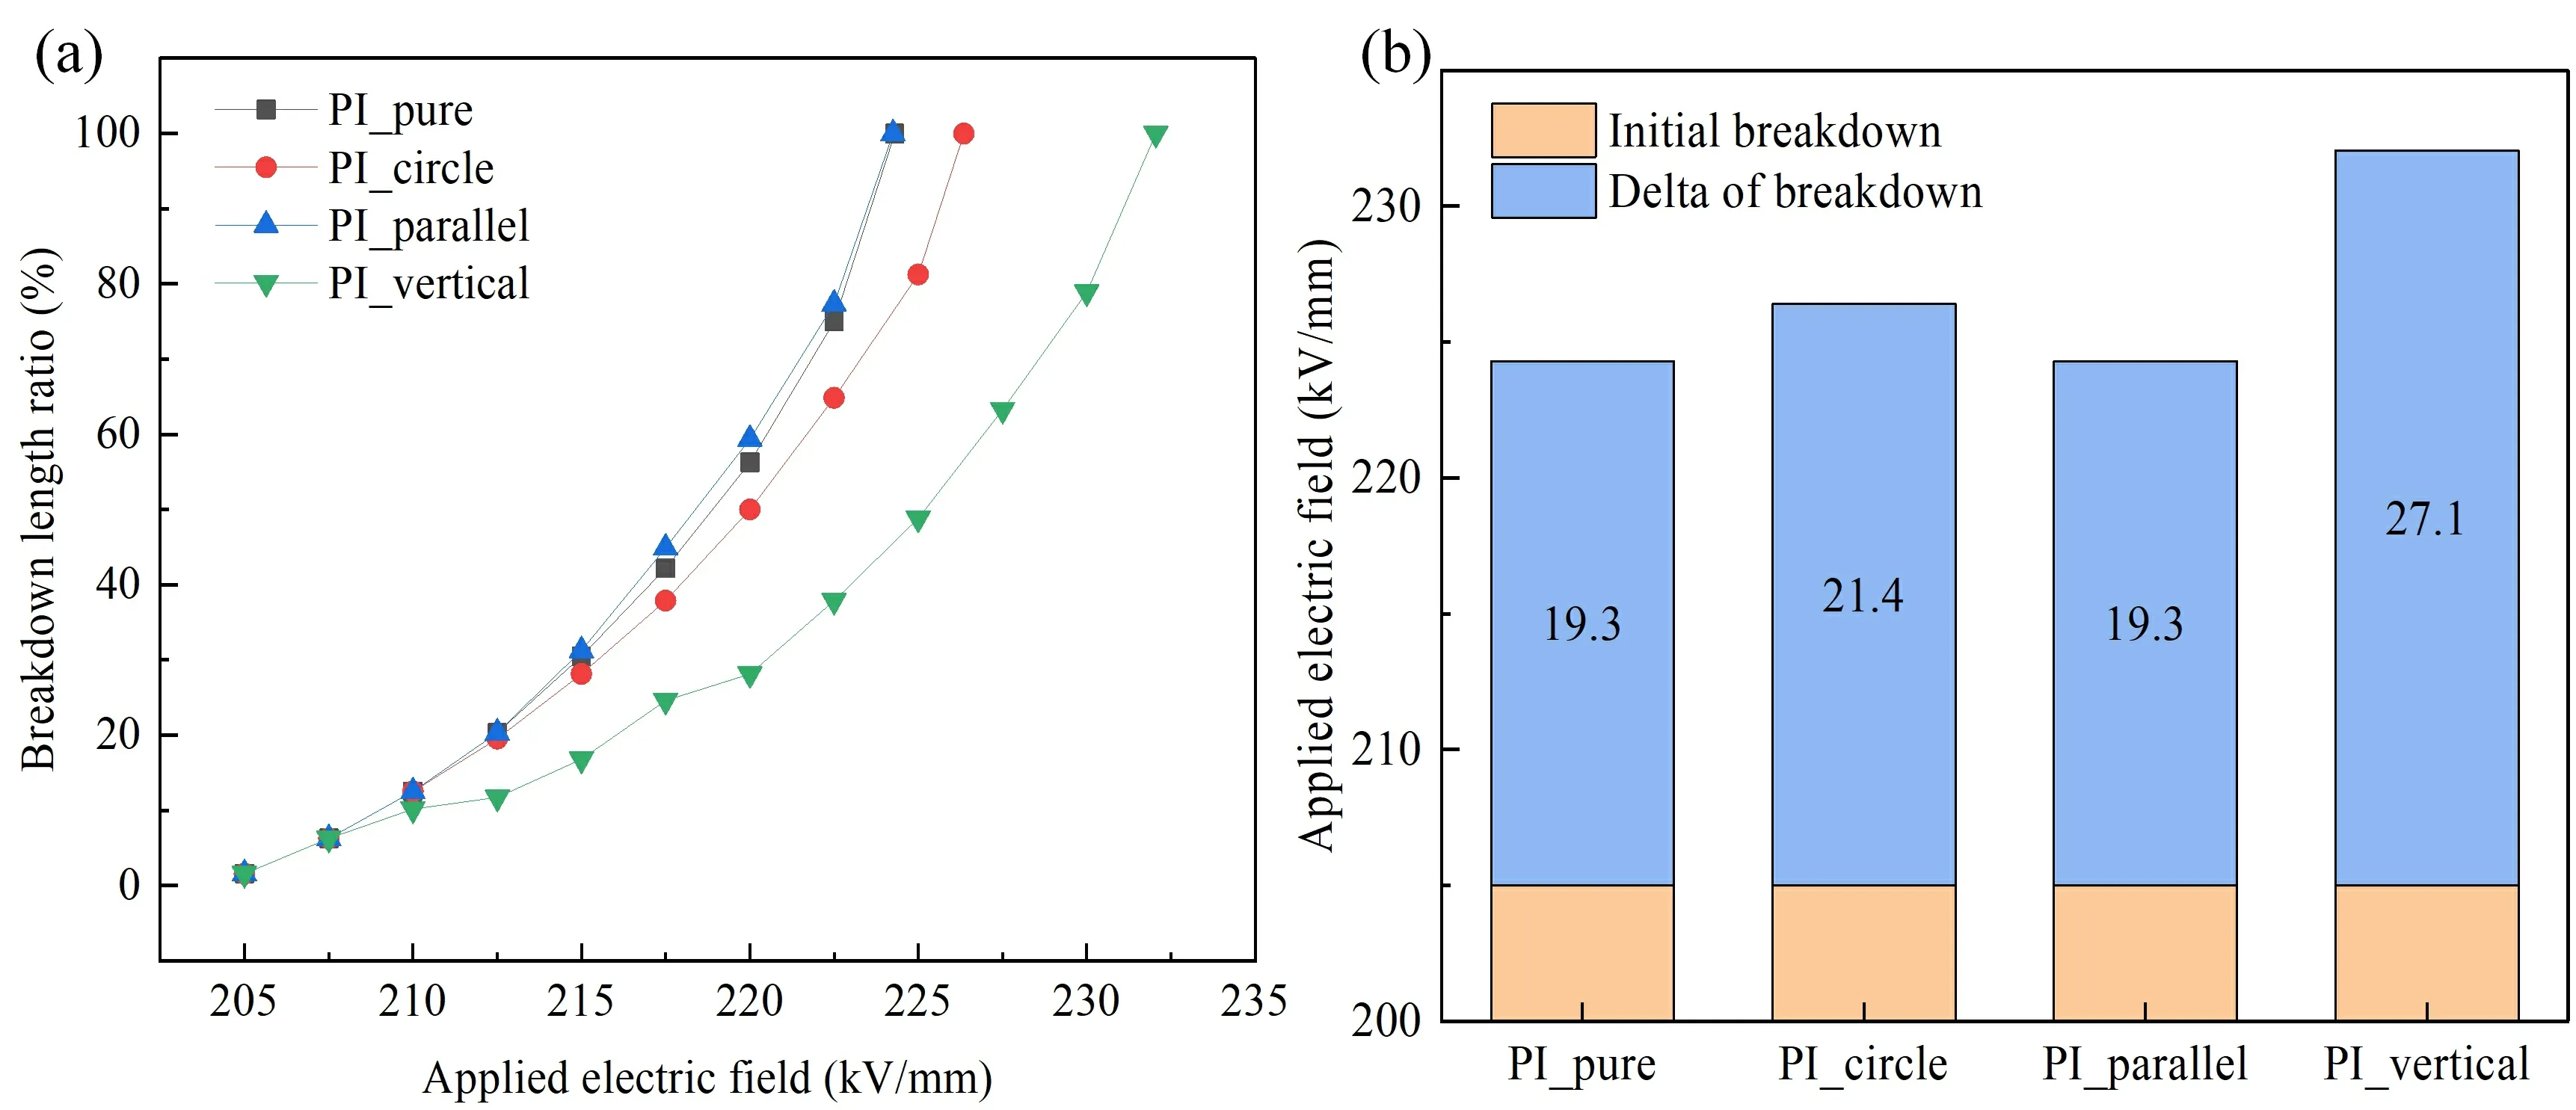
Figure 13.(a) The breakdown length ratios,along with (b) the initial and complete breakdown field strengths,of the pure polyimide and three different filler composite models.
Figure 14 shows the comparison between the simulated predicted deterioration factor of the PI_circle model and the experimental value of PI doped SiO2particles at different temperature.This comparison shows a remarkable agreement between the predicted and experimental PI_circle deterioration factors,illustrating the accuracy and validity of the phase field model.
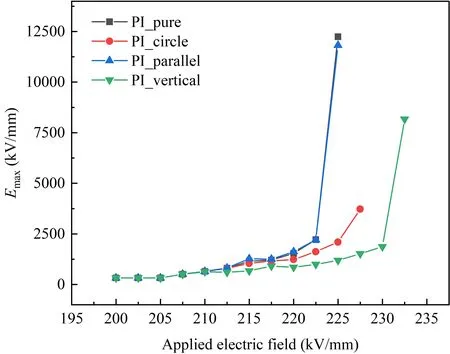
Figure 15.The relationship between local electric field maximum Emax and applied electric field for the pure polyimide and three different filler composite models.
Figure 15 illustrates the relationship between local electric field maximumEmaxand applied electric field for the pure polyimide and three different filler composite models.It can be seen that PI_parallel has higherEmax,whereas PI_circle and PI_vertical have comparatively lowerEmax.The lowerEmaxslows down the progression of the breakdown path,thus reducing the complete breakdown field strength.The relationship between energy density and applied electric field for the pure polyimide and three different filler composite models is shown in figure 16.During the initial stage of evolution,the average electrostatic energy density surpasses the average Joule heat energy density.However,in the later stage,the dominant driving force shifts to the average Joule heat energy.The PI_vertical model exhibits the lowest values for both electrostatic energy density and Joule heat energy density compared to the other models.This outcome can be attributed to two main factors.Firstly,the PI_vertical model possesses a smaller high field strength region under the applied electric field.Consequently,the total free energy available to drive breakdown is smaller than that of the other models at the same applied field strength,resulting in slower evolution of the breakdown path.Secondly,the vertical nanosheets,which possess a higher intrinsic breakdown field strength,act as obstacles to the development of the breakdown path.Consequently,the breakdown in the composite must circumvent the vertical nanosheets,further slowing down the breakdown development.The PI_parallel model exhibits the highest values for both electrostatic energy density and Joule heat energy density.This can be attributed to its concentrated and larger values of the high field strength region,which facilitates the development of the breakdown path.Consequently,the presence of parallel nanosheets becomes ineffective in improving the insulation properties of the composite.In summary,the composites doped with nanosheets aligned vertical to the applied electric field direction exhibit the highest breakdown resistance,followed by doped circle nanoparticles.Conversely,the composites doped with nanosheets aligned parallel to the applied electric field direction do not exhibit improved breakdown resistance.The enhanced breakdown characteristics of doped vertical nanosheets can be attributed to two main factors.Firstly,the shape of vertical nanosheets results in a more dispersed local electric field distribution with comparatively lowerEmax.Secondly,the nanosheets possess a high intrinsic breakdown field strength and larger cross section,which impedes the progression of the breakdown path and increases the applied field strength necessary for complete breakdown.
4.Conclusions
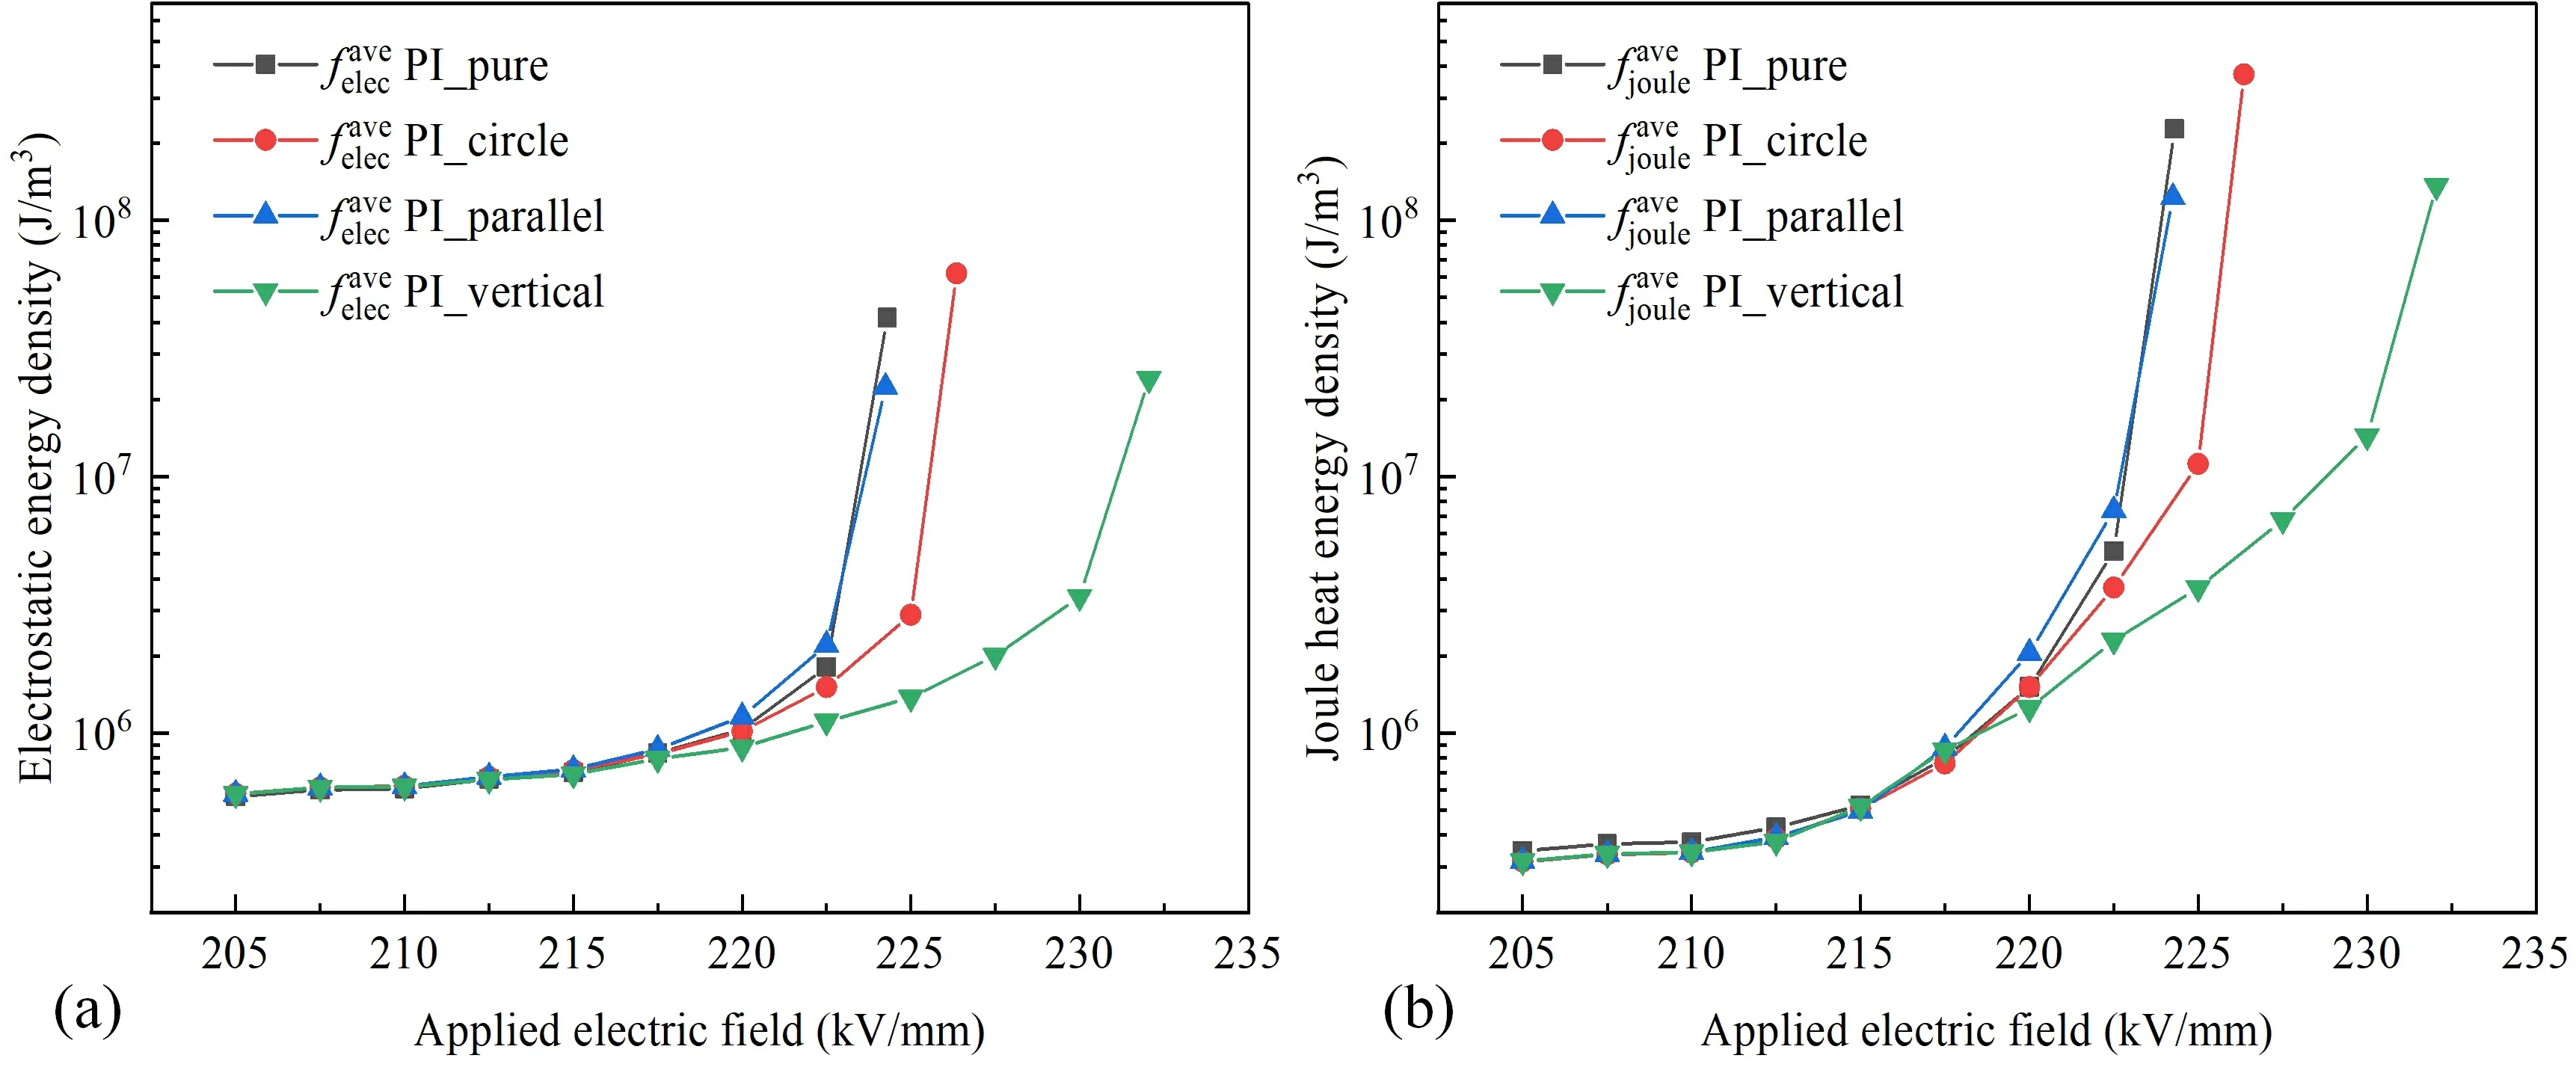
Figure 16.The relationship between energy density and applied electric field for the pure polyimide and three different filler composite models.(a) Average electrostatic energy density,(b) average Joule heat energy density.
In this paper,an electric-thermal coupled discharge breakdown phase field model was constructed to study the evolution of the breakdown path in polyimide nanocomposite insulation subjected to high-frequency stress.The investigation focused on analyzing the effect of various factors,including frequency,temperature,and nanofiller shape,on the breakdown path of PI composites.The study elucidated the failure mechanism of polyimide insulation breakdown and the enhancement mechanism of nano-modified composite insulation at the mesoscopic scale.Ultimately,this research aims to provide a theoretical foundation for the optimal design and performance regulation of new insulation materials for high-frequency power equipment,and the conclusions obtained are given as follows.
(1) The effect of different frequencies on the breakdown path of polyimide was analyzed.The breakdown path at higher frequencies obviously showed a faster development rate,and the complete breakdown field strength exhibited a decreasing trend with increasing frequency.As the frequency of the electrical stress increases,the driving force of the breakdown evolution gradually shifts to be dominated by Joule heat.This change can be attributed to the direct increase in Joule heat density with frequency and its indirect influence on the electrostatic energy density,causing it to increase.
(2) The effect of different temperatures on the breakdown path of polyimide was analyzed.As the temperature increased,both the initial and complete breakdown field strengths exhibited a gradual decrease.Specifically,the complete breakdown field strengths at 400 K and 500 K decreased by 23.9% and 49.3% respectively,in comparison to the value at 300 K.The ΔEalso displayed a decreasing trend as the temperature rose.With the rise in temperature,the dominance of Joule heat energy over the driving force provided by electrostatic energy increased,which allows the model to have breakdown at lower electric field strength.
(3) The effect of different nanofiller shapes on the breakdown path of PI composites was investigated using PI-SiO2composites as a case study.Among the investigated models,the composite doped with nanosheets aligned vertical to the applied electric field direction exhibited the highest complete breakdown field strength,resulting in a ΔEincrease of 40.2%compared to pure polyimide.Following this,the composite containing circle nanoparticles demonstrates a complete breakdown field strength increase of 10.9% compared to pure polyimide.Conversely,the composite doped with nanosheets aligned parallel to the applied electric field direction showed a complete breakdown field strength consistent with that of pure polyimide.The enhanced breakdown characteristics of doped vertical nanosheets can be attributed to two main factors.Firstly,the shape of vertical nanosheets results in a more dispersed local electric field distribution with comparatively lowerEmax.Secondly,the nanosheets possess a high intrinsic breakdown field strength and larger cross section,which impedes the progression of the breakdown path and increases the applied field strength necessary for complete breakdown.
Acknowledgments
This work was supported in part by the National Key R&D Program of China (No.2021YFB2601404),Beijing Natural Science Foundation (No.3232053),and National Natural Science Foundation of China (Nos.51929701 and 52127812).
猜你喜歡
Chinese Physics B(2022年8期)2022-08-31
大眾文藝(2021年5期)2021-04-12
小學生必讀(低年級版)(2020年9期)2020-12-04
中華詩詞(2020年11期)2020-07-22
河北書畫研究(2018年2期)2018-03-07
校園英語·上旬(2017年3期)2017-04-13
公關世界(2016年20期)2016-02-27
公關世界(2016年22期)2016-02-14
古代文明(2014年3期)2014-08-07
中學生英語·外語教學與研究(2008年4期)2008-03-18
 Plasma Science and Technology2024年2期
- Plasma Science and Technology的其它文章
- Non-thermal atmospheric-pressure positive pulsating corona discharge in degradation of textile dye Reactive Blue 19 enhanced by Bi2O3 catalyst
- The characteristics of negative corona discharge and radio interference at different altitudes based on coaxial wire-cylinder gap
- Characteristics of laser-induced breakdown spectroscopy of liquid slag
- Airfoil friction drag reduction based on grid-type and super-dense array plasma actuators
- Multi-layer phenomena in petawatt laserdriven acceleration of heavy ions
- Experimental study on the effect of H2O and O2 on the degradation of SF6 by pulsed dielectric barrier discharge