
The characteristics of negative corona discharge and radio interference at different altitudes based on coaxial wire-cylinder gap
2024-03-19 02:36WanglingHE何旺齡HongyuWEl魏宏宇YinluZHANG張胤祿YongcongLlU劉永聰YunpengLlU劉云鵬BaoquanWAN萬保權YangZHOU周陽YanzhaoWANG王延召andZheyuanGAN干喆淵
Plasma Science and Technology 2024年2期
Wangling HE (何旺齡),Hongyu WEl (魏宏宇),Yinlu ZHANG (張胤祿),Yongcong LlU (劉永聰),Yunpeng LlU (劉云鵬),Baoquan WAN (萬保權),Yang ZHOU (周陽),Yanzhao WANG (王延召) and Zheyuan GAN (干喆淵)
1 Hebei Key Laboratory of Green and Efficient New Electrical Materials and Equipment,North China Electric Power University,Baoding 071000,People’s Republic of China
2 State Grid Suzhou Power Supply Company,Suzhou 215000,People’s Republic of China
3 State Key Laboratory of Power Grid Environmental Protection (China Electric Power Research Institute),Wuhan 430000,People’s Republic of China
Abstract The corona discharge from transmission lines in high-altitude areas is more severe than at lower altitudes.The radio interference caused thereby is a key factor to be considered when designing transmission lines.To study the influence of altitude on negative corona characteristics,an experimental platform comprising a movable small corona cage was established: experiments were conducted at four altitudes in the range of 1120-4320 m,and data on the corona current pulse and radio interference level of 0.8-mm diameter fine copper wire under different negative voltages were collected.The experimental results show that the average amplitude,repetition frequency and average current of the corona current pulse increase with increasing altitude.The dispersion of pulse amplitude increases with increase in altitude,while the randomness of the pulse interval decreases continuously.Taking the average current as an intermediate variable,the relationship between radio interference level and altitude is obtained.The result of this research has some significance for understanding the corona discharge characteristics of ultra-highvoltage lines.
Keywords: altitude,negative corona,corona current pulse,radio interference level
1.lntroduction
China’s terrain is high in the west and low in the east,and the energy in the west is inversely distributed with the load center in the east.Areas with an altitude of over 2000 m in China account for 37% of the land area,and the average elevation of the Qinghai-Tibet Plateau is around 4000 m.It is an inevitable choice for China to build an ultra-high-voltage direct current (UHV DC) transmission network to meet its energy needs,and an UHV DC system has the advantages of long distance,large capacity and low loss [1,2].At the same time,corona discharge on the surface of transmission lines will cause some electromagnetic environmental problems,such as audible noise,radio interference (RI) and corona loss.RI can affect the normal operation of radio facilities around the transmission line,so its impact needs to be taken into account when erecting transmission lines.
With increase in altitude,the density of air decreases,the electron mean free path increases,effective collisional ionization is more likely to occur,the corona discharge phenomenon is more severe and the RI of transmission lines in high-altitude areas is consequently more serious [3].A negative pole line is important component for bipolar operation of a DC transmission system,so it is necessary to discuss the negative discharge and its level of RI.
Researchers have conducted a lot of work on negative corona discharges.In 1938,Trichel first studied the regular repetitive current pulses that occur in a negative corona discharge and proposed the reasons for the generation of these repetitive current pulses [4].In 1974,Lama and Gallo conducted a comprehensive analysis of the characteristics of negative polarity corona pulses for the first time [5],while in 1981,Henson measured and theoretically derived a mathematical model for the needle plate gap in liquid helium [6].In 1985,Morrow proposed a one-dimensional simulation model for negative corona current pulses [7].In 2002,Akishevet alobtained a series of Trichel pulses based on a two-dimensional model of a negative corona discharge in air[8].In 2004,Yamada measured the negative corona current using a ‘point to grid’ electrode system and obtained an empirical formula for the corona volt-ampere characteristics[9].In 2007,Hui studied the influence of air pressure on the characteristics of a negative corona pulse based on a needleplate electrode in an artificial climate chamber.Hui believed that the decrease in air pressure and the increase in electron density were the main reasons for the increase in current pulse amplitude [10].In 2014,Yinet alsimulated Trichel pulses in a negative corona discharge based on a timedomain finite-volume approach [11].In 2014,Denget alobtained the effect of humidity on negative corona Trichel pulses [12],while in 2021,Liuet alconducted experiments using small corona cages at different altitudes to study the characteristics of AC negative half-cycle corona current pulses at different altitudes [13].
As for the RI on transmission lines,Adams first proposed the concept of an RI generation function in 1956 [14].Moreau and Gary studied the effect of weather conditions and conductor surface condition on RI on transmission lines [15],while Heet almeasured the RI excitation function values of different bundle conductors at different altitudes,proposing a correction term for the RI level which fitted well for regions with different altitudes below 4300 m[16].Based on a large corona cage,Peiet almeasured the RI current of various conductor bundles under conditions of heavy rain.The proposed excitation function is suitable for the prediction of RI level of UHV alternating current (AC)transmission lines in plains [17].
Most of these studies used numerical simulation methods or model experiments based on artificial climate chambers,and few experiments have been conducted on discharge characteristics under actual environmental scenarios.Therefore,it is necessary to conduct corona discharge experiments at different altitudes,further study the influence of altitude on negative corona discharge and obtain negative corona discharge current characteristics and their connection to RI.
A movable small corona cage and a high-frequency current acquisition system were used to test negative corona characteristics at four different altitudes,and the RI levels were measured by an EMI receiver.The influence of altitude on the negative corona characteristics was analyzed,and the relationship between the average corona current and the RI level constructed.The results can provide reference values for understanding the negative discharge and its relationship with RI in high-altitude areas.
2.Experimental principle
2.1.Experimental platform
A mobile small corona cage and high-frequency current measurement system were used to conduct corona discharge experiments at different altitudes (figure 1).The corona cage was fabricated in metal,with the cage wall being a singlelayer network structure with a circular cross section of 0.4 m diameter and length of 1 m.The support frame and wire support rod of the corona cage were made of epoxy resin materials to ensure reliable insulation and prevent leakage current from affecting the measurement.Fine copper wire with a diameter of 0.8 mm was selected as the experimental wire.To obtain stable corona discharge,the surface of the wire was polished with abrasive paper.
Due to the end effect,the electric field on the surface of the conductor at the end of the corona cage will be distorted.The electric field intensity at the distortion is large,and the corona discharge is severe,which affect the accuracy of the whole corona current measurement system.Therefore,a grading ring was inserted between the conductor support rod and the small corona cage to eliminate the end effect.
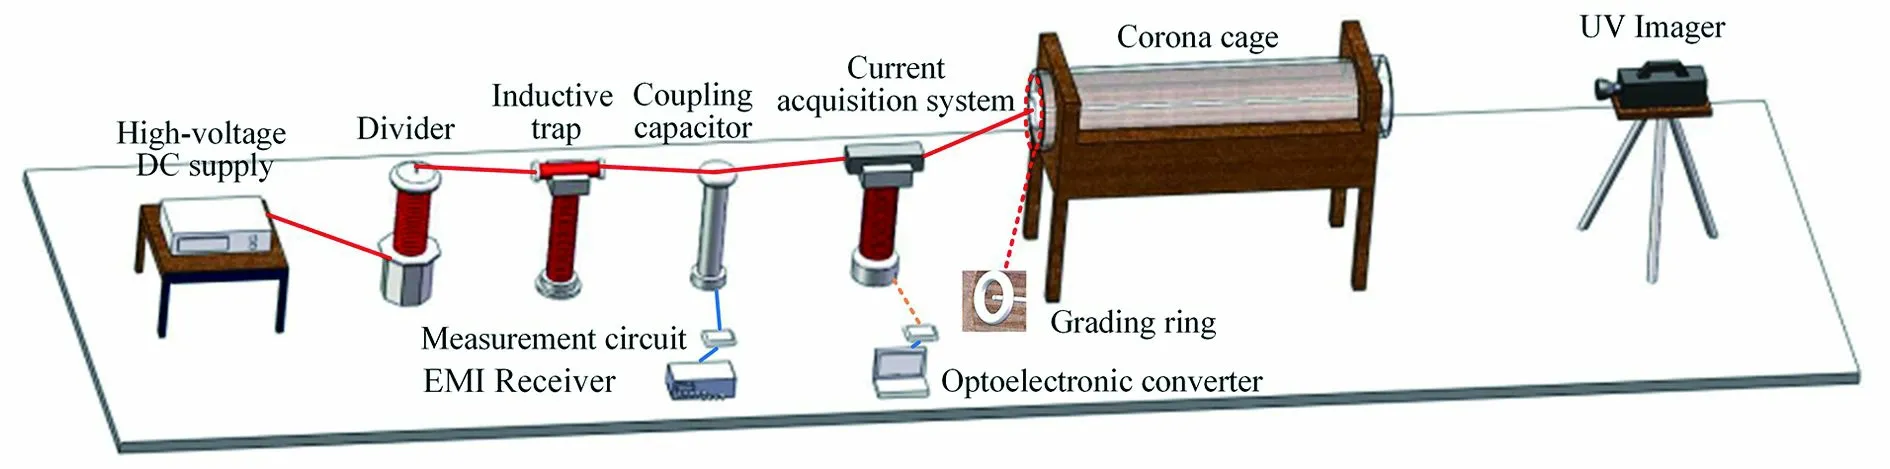
Figure 1.Layout of experimental setup.
2.2.Measurement system and experimental method
To ensure the safety of the experimental personnel,the highand low-potential parts of the measurement system must be reliably isolated.Therefore,a high-frequency current acquisition system was used in the present research to ensure electrical isolation between high and low potential through the optical fiber transmission measurement signal.The experimental circuit diagram is shown in figure 2.The inductive trap can block the high-frequency current generated by the corona discharge of the wire into the power supply end,and can also prevent interference on the power supply side; the coupling capacitor can couple the high-frequency component of the conductor corona current to the low-voltage side;the impedance at the end of the coupling loop prevents signal reflection between the measurement signal and the receiver,and its value was set to 50 Ω.
To ensure the effectiveness of corona current pulse measurement,the current acquisition system is required to distinguish the pulse with a minimum rising edge of less than 10 ns.The acquisition card is a U2702 A-USB modular oscilloscope (Agilent,USA) with a 12 V battery to supply power separately.The acquisition card has a bandwidth of 200 MHz,a single-channel sampling frequency of 5 × 10⁸samples s-1,a storage capacity of 16 million samples and a minimum sampling interval of 2 ns.At the same time,to eliminate the influence of resistance,lead inductance and stray capacitance on the ground of the current sensor,the current sensor used in this article adopted coaxial parallel connection of multiple non-inductive resistors and the total resistance value of the current sensor was 400 Ω.
Corona discharge is caused by the electric field strength on the surface of the wire being greater than the corona field strength,so the electric field strength on the surface of the wire was adjusted by changing the voltage applied to the wire.The corona current pulse and RI level data were measured at different altitudes and different applied voltages.
After the onset of conduction,data were measured for every 5 kV step,and the following negative DC voltages were applied: -15 kV,-20 kV,-25 kV and -30 kV.After the corona discharge state stabilized at each applied voltage,10 current pulse measurements were repeated and the waveforms recorded.
2.3.Experimental site and environment

Figure 2.Experimental circuit diagram.
To study the performance of the corona at different altitudes,experiments were conducted at four different altitudes in Tianshui,Gansu Province (altitude 1120 m),Baiyin,Gansu Province (altitude 1680 m),Lhasa,Tibet Autonomous Region (altitude 3660 m) and Yangbajing,Tibet Autonomous Region (altitude 4320 m).
All experiments were carried out at an indoor site with sufficient space.The relative humidity of the measurement environment was maintained at 40%-60%,and the ambient temperature was maintained between 20 °C and 30 °C.Studies have shown that temperature and humidity changes in this small range have little effect on the characteristics of negative corona discharge [10,18],therefore,in this work,the influences of temperature and humidity on the experimental results are ignored and the effect of altitude is mainly considered.
3.Measurement and analysis of corona current pulses at different altitudes
3.1.Typical corona current pulse sequence
The typical corona current pulse sequences at different altitudes when a voltage of -20 kV was applied to the copper wire is shown in figure 3.
Taking the pulse waveform at an altitude of 1120 m as an example,the characteristics of the corona current pulse were investigated (figure 4).The corona current pulse was fitted by the least squares method,as shown by the imaginary line.Here,Ipis the pulse peak andTis the duration of a single pulse.
3.2.Characteristics of the corona current pulse
3.2.1.Average value of the pulse amplitude and pulse repetition frequencyThe corona current pulse data measured by the experiment were analyzed,and the average value of the corona current pulse amplitude and the current pulse repetition frequency were obtained and discussed (figures 5 and 6).The negative corona pulse amplitude and the average current were taken as absolute values.

Figure 3.Corona current pulse sequences at different altitudes.

Figure 4.Pulse waveform parameter.
It can be seen from figures 5 and 6 that the average value of the pulse amplitude and repetition frequency increase with increasing altitude.For a voltage of -20 kV applied to the conductor,when the altitude increases from 1120 to 4320 m the average value of the pulse amplitude increases from 0.95 to 1.5 mA and the pulse repetition frequency increases from 18.2 to 40.2 kHz.The change of pulse repetition frequency is greater than the change in average value of the pulse amplitude.By analyzing the development of the corona discharge pulse,it can be seen that with increase in altitude the density of electrons and positive ions near the electrode increases when the pulse occurs,resulting in more severe spatial distortion of the electric field,a higher electric field intensity on the surface of the conductor and a greater corona pulse amplitude.At the same time,the increase in altitude makes the positive and negative ions migrate faster in the dead time after the end of the pulse,so the electric field intensity on the surface of the wire is better able to return to the state at the beginning of the corona discharge and the corona pulse repetition frequency increases.
3.2.2.Average value of corona currentTraditional research on corona current characteristics is mostly based on the average current measured in experiments,and the volt-ampere characteristics of the corona discharge have been studied [19].In the present work,the measured current pulse data were processed to allow calculation of the average value of the corona current,as shown in equation (1)
whereIaveis the average value of corona current (inμA),Tis the total duration of the measured current pulse fragment (in s) andiis the measured instantaneous value of corona current (inμA).
The change in the average value of the corona current with altitude is plotted in figure 7.
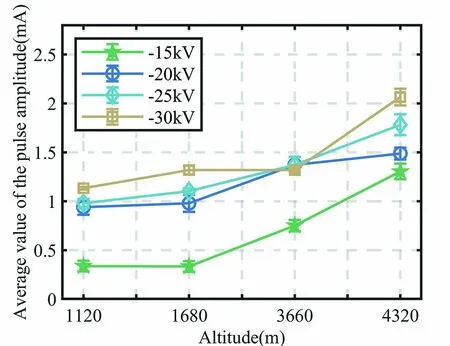
Figure 5.Average value of the pulse amplitude at different altitudes.

Figure 6.Pulse repetition frequency at different altitudes.
Figure 7 shows that the average value of corona current increases with increasing altitude.When the altitude is below 2000 m,the average current increases slowly when the applied voltage is low.At altitudes above 2000 m,the average current increases rapidly,and the greater the altitude,the greater the increase.When the voltage applied to the conductor is -20 kV and the altitude increases from 1120 to 1680 m,the average current increases from 1.9 to 2.49μA.When the altitude increases from 3660 to 4320 m,the average current increases from 5.71 to 8.58μA.With increasing altitude,the amplitude of the corona current pulse increases,the repetition frequency increases and,ultimately,the average value of the current increases.
3.3.Statistical analysis of corona current pulses
To estimate the random distribution of negative DC corona current pulse eigenvalues,it is necessary to evaluate the probability density distribution of pulse amplitude and pulse interval.
3.3.1.Probability density distribution of pulse amplitudeThe probability distribution of the amplitude of the negative corona current pulse at different altitudes when the voltage applied to the conductor is -20 kV is shown in figure 8.At low altitude (1120 m and 1680 m),the pulse amplitude is mainly concentrated at about 1 mA,which conforms to the characteristics of a normal distribution.As the altitude increases,the pulse amplitude gradually shifts to the right.When the altitude is higher than 3660 m,a larger part of the pulse amplitude appears,and the second peak appears at about 2 mA; this is characterized by a bimodal distribution,indicating that the discharge pulse may have a new form with a higher amplitude.
The standard deviation of corona current pulse amplitude at different altitudes for an applied voltage of -20 kV was calculated and is given in table 1.
For a constant voltage applied to the wire,as the altitude increases the randomness of the corona current pulse amplitude distribution increases,and the standard deviation of the pulse amplitude increases.This is because as the altitude increases,pulses with higher amplitudes will appear while pulses with lower amplitudes still exist,resulting in an increase in the dispersion of pulse amplitudes.
3.3.2.Probability density distribution of pulse intervalThe probability distribution of the negative pulse interval at different altitudes for an applied voltage of -20 kV is shown in figure 9.
Figure 9 shows that the probability distribution of the corona current pulse interval shows a trend of high on the left and low on the right,with exponential attenuation consistent with the probability density function curve of the exponential distribution.At an altitude of 1120 m,the maximum time interval between corona current pulses is close to 300μs,and their distribution is random.With increasing altitude,the maximum time interval between pulse gradually decreases,the overall distribution shifts to the left and the randomness of the distribution decreases.Above an altitude of 1680 m,the maximum value of the pulse time interval is less than 200μs and the probability density of small time intervals continues to increase.
The standard deviation of the pulse interval is shown intable 2: with increasing altitude,the dispersion of the pulse time interval distribution decreases and the standard deviation decreases.This is because when the voltage applied to the wire is constant,as the altitude increases the number of corona current pulses per unit time increases,the corona discharge tends to be more stable and regularity is enhanced,so the time interval distribution is more concentrated.

Figure 8.Histogram of the probability distribution of pulse amplitude at different altitudes: (a) 1120 m,(b) 1680 m,(c) 3660 m,(d)4320 m.
3.4.Variation of corona current with altitude
To quantify the variation of corona current characteristics with altitude,the influence of altitude on the negative DC corona characteristics of conductors is further analyzed.In most research,the empirical formula describing the corona current characteristics at different altitudes is derived using a data-fitting method.The average value of corona current contains information such as the voltage applied to the wire,the amplitude of the corona current pulse and the repetition frequency.Therefore,use of the average value of the current as a characteristic can more comprehensively and accurately describe the influence of altitude on the characteristics of the corona current pulse.
Under the same applied voltage,change in the electrode radius and gap distance will cause the electric field intensity to change,and the corona current characteristics will also change.Therefore,no accurate fitting formula can be obtained by taking the applied voltage as the independent variable,and the electric field strength on the surface of the conductor is directly related to the corona discharge characteristics.In addition,because the present research is based on scale-model experiments,the voltage of the actual line is quite different but the surface field strengths of the two are similar.Taking the electric field strength as the independent variable,the equivalence of the scale model to the actual line can be realized and simulation can be done.
Based on the principle of electrostatic field,according to equation (2) the applied voltage of the wire is converted into the field strength on the surface of the wire.Taking the surface field strength of the wire as the independent variable,the change in average corona current with electric field strength at different altitudes is described (see figure 10)
whereUis the conductor voltage (in kV),Eis the electric field intensity on the conductor surface (in kV cm-1),ris the radius of the wire (in cm) andRis the outer electrode radius(in cm).
It can be seen from figure 10 that at different altitudesthe average corona current increases with increase in the surface field strength on the conductor,and the average corona current increases with applied voltage as a power function.Through the pre-treatment and preliminary fitting of the experimental data,it can be found that the relationship between the average corona current and the surface field strength of the conductor takes the formK(E-E0)n,withnbeing about 1.6,which is consistent with previous results [20].
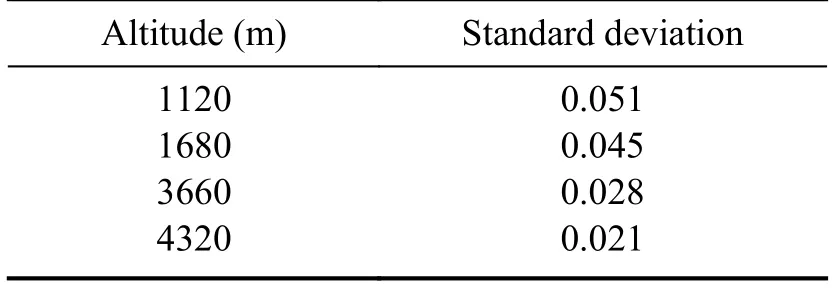
Table 2.Standard deviation of the pulse interval.

Figure 9.Histogram of pulse interval time distribution at different altitudes: (a) 1120 m,(b) 1680 m,(c) 3660 m,(d) 4320 m.
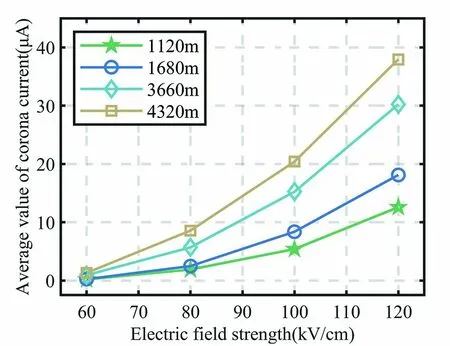
Figure 10.Relationship between the average corona current and the field strength on the wire surface.
The relationship between the average corona current and the electric field intensity of the conductor surface is fitted by equation (3)
whereIaveis the average value of corona current (inμA),Krepresents a linear coefficient of proportionality,Eis the electric field intensity on the surface of the conductor (in kV cm-1) andE0is the corona onset field strength (in kV cm-1).When the surface electric field intensity of the wire is close toE0,the average corona current tends to 0 and the corona discharge tends to stop.
The results for fitting the altitude andKare shown in equation (4) and figure 11
wherehis the altitude (in m).
The relationship between the average corona current and the altitude is obtained by equation (5)
whereIaveis the average value of corona current (inμA) andEis the surface field strength of the conductor (in kV cm-1).
4.Relationship between corona pulse and Rl level
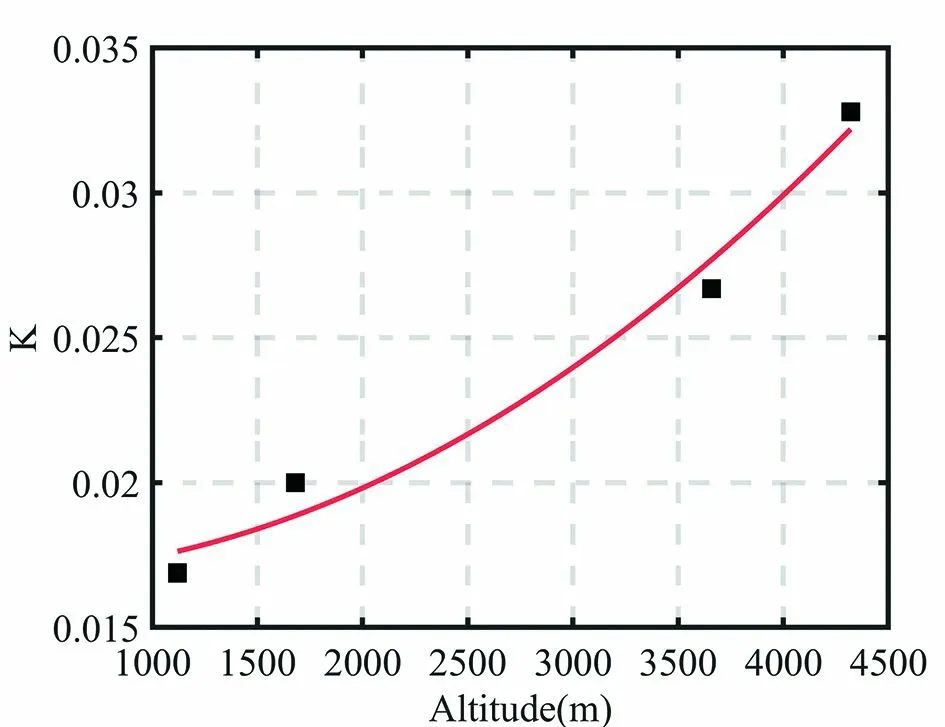
Figure 11.The coefficient K in relation to altitude.
The variation of the average corona current with altitude is given above: this covers the information on the applied voltage of the wire,the amplitude of the corona current pulse,the repetition frequency and so on.The average value of the corona current can be used to quantify the relationship between the corona current and RI level.Therefore,the average value of the corona current can be used as an intermediate variable to assess the influence of altitude on the negative corona effect.
Regression analysis was used to establish the correlation between the average corona current and the RI level [21].Based on the calculated results for average corona current,the relationship between the negative corona current and RI level at different altitudes was analyzed with an RI level of 0.5 MHz taken as the characteristic quantity.The RI level after eliminating background interference is summarized in table 3.
The level of RI and corona current pulse measurement data at different altitudes were analyzed.As shown in figure 12,at different altitudes the RI level increases with increase in the corona current and generally shows a logarithmic relationship.Altitude itself has no obvious relationship with RI level.
Based on the non-linear least squares method,the relationship between the RI level and the average corona current is fitted to quantify the relationship between them (figure 12)and determine the characteristics of the power function curve(table 4,figure 13).
In table 4,aandbare the optimal parameter values of the fitting curve,R2is the coefficient of determination,with a value range of [0,1].The closerR2is to 1,the more accurate the fitted formula.RMSE is the fitting standard deviation of the regression system.The closer the RMSE is to 0,the better the model fits the data.

Table 3.0.5 MHz RI level at different altitudes (unit dB).
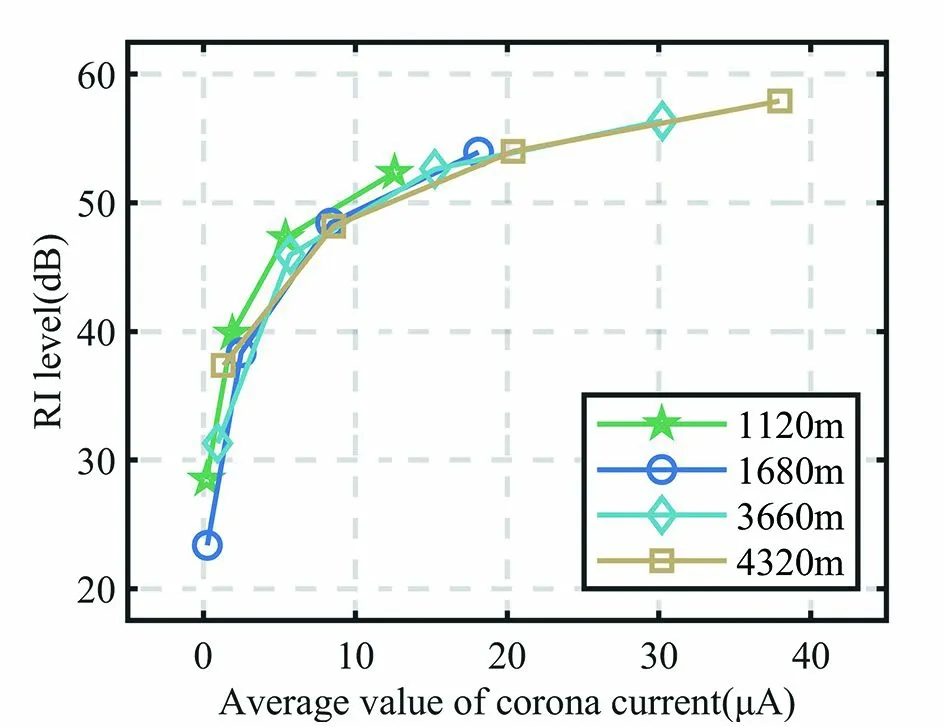
Figure 12.The relationship between RI and the average value of corona current.
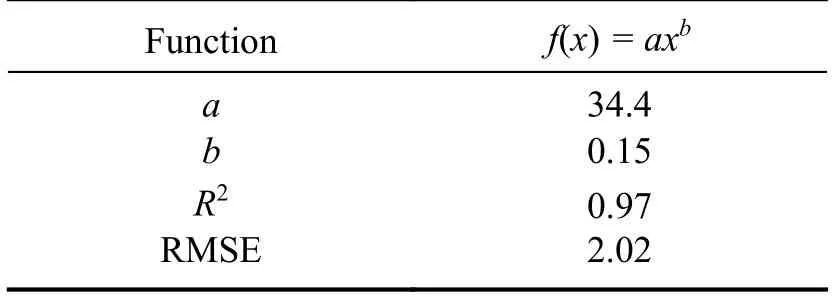
Table 4.Fitting results for RI level and average corona current.

Figure 13.Fitted curve of RI versus average corona current.
In summary,the functional relationship between corona current pulse and RI level can be obtained as shown in equation (6).That is,at the 0.5 MHz RI level,RI0.5and the average corona currentIare roughly in a power function relationship
whereRI0.5is the 0.5 MHz RI level (in dB) andIis the average corona current (inμA).
By substituting equation (5) into equation (6),the relationship between RI level and altitude can be obtained (equation (7))
whereEis the field strength of the conductor surface (in kV cm-1),Kis a function of altitudehand the relationship between them is given by equation (4).
5.Conclusions
The negative corona discharge of a conductor was tested at four different altitudes using a movable small corona cage,and the influence of altitude on negative corona current pulse and RI was discussed.The following conclusions were obtained:
(1) The average amplitude,repetition frequency and average current of the corona current pulse increase with increasing altitude.When the altitude increases from 1120 to 4320 m,the average amplitude of the corona current pulses increases from 0.95 to 1.5 mA,the repetition frequency increases from 18.2 to 40.2 kHz and the average current increases from 1.9 to 8.58μA.
(2) The amplitude of the pulse follows a lognormal distribution.As the altitude increases,the dispersion of the amplitude distribution increases.At an altitude of 3660 m,some high-amplitude pulses appear,resulting in two peaks appearing in the probability distribution.The pulse time interval follows an exponential distribution.As the altitude increases,the standard deviation decreases and the probability density distribution becomes more concentrated.
(3) The average corona currentIaveand the electric field strengthEof the conductor surface were selected as the characteristic quantities for fitting the relationship between the two at different altitudes.The results show thatIaveis proportional to (E-E0)1.6.The constant of proportionalityKlinking the two is a quadratic function of altitudeh.
(4) Through regression analysis,the relationship between RI and the average value of corona current shows power function growth (0 <α< 1).Combined with the relationship between the average value of corona current and the change in wire surface field strength and altitude,the relationship of RI level to altitude is obtained.
Acknowledgments
This work was supported by the Science and Technology Project of State Grid Corporation of China (No.5200-202155587A-0-5-GC).
 Plasma Science and Technology2024年2期
- Plasma Science and Technology的其它文章
- Phase field model for electric-thermal coupled discharge breakdown of polyimide nanocomposites under high frequency electrical stress
- Characteristics of laser-induced breakdown spectroscopy of liquid slag
- Airfoil friction drag reduction based on grid-type and super-dense array plasma actuators
- Non-thermal atmospheric-pressure positive pulsating corona discharge in degradation of textile dye Reactive Blue 19 enhanced by Bi2O3 catalyst
- Multi-layer phenomena in petawatt laserdriven acceleration of heavy ions
- Experimental study on the effect of H2O and O2 on the degradation of SF6 by pulsed dielectric barrier discharge