
Computed tomography-based nomogram of Siewert type II/III adenocarcinoma of esophagogastric junction to predict response to docetaxel,oxaliplatin and S-1
2024-03-23 00:40ChuanQinyuanZhouDanGaoYanGuiNingPuLiWenWenGuoHaiYingZhouRuiLiJingChenXiaoMingZhangTianWuChen
World Journal of Radiology 2024年1期
Chuan-Qinyuan Zhou,Dan Gao,Yan Gui,Ning-Pu Li,Wen-Wen Guo,Hai-Ying Zhou,Rui Li,Jing Chen,Xiao-Ming Zhang,Tian-Wu Chen
Abstract BACKGROUND Neoadjuvant chemotherapy (NAC) has become the standard care for advanced adenocarcinoma of esophagogastric junction (AEG),although a part of the patients cannot benefit from NAC.There are no models based on baseline computed tomography (CT) to predict response of Siewert type II or III AEG to NAC with docetaxel,oxaliplatin and S-1 (DOS).AIM To develop a CT-based nomogram to predict response of Siewert type II/III AEG to NAC with DOS.METHODS One hundred and twenty-eight consecutive patients with confirmed Siewert type II/III AEG underwent CT before and after three cycles of NAC with DOS,and were randomly and consecutively assigned to the training cohort (TC) (n=94) and the validation cohort (VC) (n=34).Therapeutic effect was assessed by disease-control rate and progressive disease according to the Response Evaluation Criteria in Solid Tumors (version 1.1) criteria.Possible prognostic factors associated with responses after DOS treatment including Siewert classification,gross tumor volume (GTV),and cT and cN stages were evaluated using pretherapeutic CT data in addition to sex and age.Univariate and multivariate analyses of CT and clinical features in the TC were performed to determine independent factors associated with response to DOS.A nomogram was established based on independent factors to predict the response.The predictive performance of the nomogram was evaluated by Concordance index (C-index),calibration and receiver operating characteristics curve in the TC and VC.RESULTS Univariate analysis showed that Siewert type (52/55 vs 29/39,P=0.005),pretherapeutic cT stage (57/62 vs 24/32,P=0.028),GTV (47.3 ± 27.4 vs 73.2 ± 54.3,P=0.040) were significantly associated with response to DOS in the TC.Multivariate analysis of the TC also showed that the pretherapeutic cT stage,GTV and Siewert type were independent predictive factors related to response to DOS (odds ratio=4.631,1.027 and 7.639,respectively;all P < 0.05).The nomogram developed with these independent factors showed an excellent performance to predict response to DOS in the TC and VC (C-index: 0.838 and 0.824),with area under the receiver operating characteristic curve of 0.838 and 0.824,respectively.The calibration curves showed that the practical and predicted response to DOS effectively coincided.CONCLUSION A novel nomogram developed with pretherapeutic cT stage,GTV and Siewert type predicted the response of Siewert type II/III AEG to NAC with DOS.
Key Words: Esophagogastric junction;Adenocarcinoma;Neoadjuvant chemotherapy;Response;Tomography,X-ray computed;Predictor
INTRODUCTION
The incidence of adenocarcinoma of esophagogastric junction (AEG) has increased worldwide,and the survival rate is unsatisfactory[1,2].Currently,surgical resection is the primary treatment for AEG,but it is only suitable for early-stage patients[3].Generally,most patients are diagnosed in the advanced stage,indicating that they are unsuitable for surgical resection.Multimodal treatment has become the standard of care for locally advanced AEG.Preoperative neoadjuvant chemotherapy (NAC) is designed to shrink the tumor to achieve a higher rate of complete resection[4].Although there is no uniform NAC regimen for AEG patients,and the regimens differ regionally,some research has indicated superiority of a docetaxel-based regimen over the established regimens,including S-1 and oxaliplatin,and cisplatin and fluorouracil[5-8].The Eastern Asia countries mostly used docetaxel,oxaliplatin and S-1 (DOS) as first-line NAC[7].However,research has demonstrated that patients who do not respond to DOS have a significantly worse prognosis.For docetaxelbased regimens,the key is to select AEG patients who optimally benefit from DOS and who do not respond to DOS in clinical practice.
The optimal treatment choice for AEG relies on the TNM staging and anatomical location.To evaluate the TNM stage and location,endoscopic ultrasound and computed tomography (CT) are the most common choices at present.However,endoscopic ultrasound is an invasive examination and may cause mucosal injury and uncomfortable response.In addition,it is hard to perform endoscopic ultrasound if the tumor causes significant stenosis.Compared with endoscopic ultrasound,CT can clearly show the morphological characteristics of the tumor,in addition to cT stage,cN stage and location of the lesion,and can measure tumor diameter and volume to assess the response to NAC[9,10].Beeretal[11] reported the early response of AEG after NAC could be predicted through gross tumor volume (GTV) on CT.Hofheinzetal[12] compared the response of advanced gastric cancer after different treatments through the changes in diameter,and cT and cN stages on CT.To our knowledge,there is no report on the development of a model based on CT characteristics to predict the response to DOS for advanced AEG patients.Our study aimed to establish and validate a novel nomogram based on CT characteristics to predict response to DOS,which could be helpful to choose optimal treatment and avoid the toxicity of DOS.
MATERIALS AND METHODS
Patients
This study was conducted in accordance with the Declaration of Helsinki,and approved by the Ethics Committee of our hospital.Written informed consent was obtained from each participant before the study.
From October 2017 to January 2021,we collected 150 consecutive patients with biopsy-confirmed AEG.The T and N stages were clinically determined according to American Joint Committee on Cancer (eighth edition).AEG was classified as stage T0if there was no evidence of primary tumor,and T1,T2,T3,and T4if tumors invaded the lamina propria or submucosa,invaded the muscularis propria or subserosa,penetrated the serosa (visceral peritoneum) without invasion of adjacent structures,and invaded adjacent structures,respectively.AEG was classified as stage N0if there were no metastatic lymph nodes,and N1,N2,and N3if there were one to two,three to six,and seven or more metastatic lymph nodes,respectively.
Patients were enrolled according to the following inclusion criteria: (1) Patients were diagnosed with AEG through gastroscopic biopsy and with locally advanced AEG confirmed by pretherapeutic CT (depth of tumor invasion > cT2N+M0),and met the National Comprehensive Cancer Network (NCCN) guidelines[13];and (2) patients received DOS chemotherapy,and underwent thoracoabdominal contrast-enhanced CT (CECT) in our hospital after three cycles of NAC.The exclusion criteria were as follows: (1) The quality of CT images was poor (n=2);(2) The clinical data were incomplete (n=3);(3) Patients had contemporary or previous malignancies (n=7);or (4) AEG was classified as Siewert type I according to the NCCN guidelines,and was treated as esophageal carcinoma (n=4).We enrolled 134 patients.However,the number of cT2stage patients was too small (n=6),and surgical treatment was mainly used in clinical practice.Therefore,we did not enroll cT2stage patients,and collected cT3-4stage patients.As a result,we enrolled 128 consecutive cT3-4stage patients who received DOS.All patients were randomly assigned to the training cohort (TC) and validation cohort (VC) at a ratio of 7:3,and the assignment was proportionally stratified by tumor location,cT stage,and cN stage.To ensure no distant metastases,positron emission tomography-CT was used before NAC.The clinical characteristics of the 128 enrolled patients are listed in Table 1.

Table 1 Demographic and clinical information of all enrolled patients receiving docetaxel,oxaliplatin and S-1
The DOS treatment during each 3-week cycle was as follows.Docetaxel 75 mg/m2and oxaliplatin 130 mg/m2were administered by intravenous infusion on day 1.Based on the patient’s body surface,S-1 was administered orally on days 1-14 (80,100 and 120 mg/time in the case of body surface area < 1.25 m2,1.25-1.5 m2and ≥ 1.5 m2,respectively).
CT image acquisition
All patients in our study underwent CT scans with two 64 multi-detector systems (LightSpeed VCT;GE Medical Systems,Milwaukee,WI,United States) 1 wk before initiation of NAC and after three cycles.Before each CT examination,all patients drank 500-1000 mL water as an oral negative contrast material.Patients were scanned in the supine position and held their breath for 10-15 s to obtain good quality images.After conventional CT without enhancement,biphasic enhancement CT scans were obtained 25 and 70 s after intravenous injection of 1.5 mL/kg contrast material (Omnipaque,Iohexol;GE Healthcare,Chicago,IL,United States) at a rate of 3.0 mL/s with a pump injector (Medrad;Vistron CT Injection System,Minneapolis MN,United States).The first-phase enhancement resulted in arterial phase images,and the second-phase enhancement resulted in portal venous phase images.The coverage of CT examination in the arterial phase was from the apex of the lungs to the middle of the right kidney to obtain thoracic enhanced images and abdominal arterial phase images.The coverage of CT in the portal venous phase was from the right diaphragmatic dome to the middle of the right kidney to obtain abdominal portal venous phase images.The CT scanning parameters were as follows: tube voltage 120 kV,tube current 200 mA,rotation time 0.5 s,detector collimation 64 mm × 0.6 mm,pitch 0.9,slice thickness 5 mm,slice interval 5 mm,and matrix 512 mm × 512 mm.The window settings were set with a width of 400 HU and window level of 40 HU.
Image-based treatment response evaluation
The treatment response in all target lesions including AEG and the positive lymph nodes was evaluated on CT according to the Response Evaluation Criteria in Solid Tumors,version 1.1 (RECIST 1.1) criteria[14].Because the peak enhancement of AEG and abdominal lymph nodes was significantly higher in the portal venous phase compared with arterial phase,the response evaluation was analyzed through the abdominal portal venous phase images together with thoracic arterial phase enhanced images[15].The treatment response of all target lesions after NAC was determined as follows: sum of maximal diameters (MDs) of AEG and positive nodal lesions before treatment minus sum of corresponding MDs after treatment at each scanning slice,divided by previous sum of MDs before treatment,multiplied by 100%.The maximal diameters of all target lesions were measured at 3D-SLICER (version 4.11,http://www.slicer.org) using CT data before DOS in transverse section with a portion of the maximal tumor extension (Figure 1) determined based on this baseline examination slice by slice.With CT data after the three cycles NAC,the maximal tumor diameters were similarly measured at the same tumor level as in the above baseline examination.For the CT evaluation before and after NAC with scan slice no greater than 5 mm,measurable lesions had to be ≥ 1 cm (long axis) for non-nodal lesions,and ≥ 1.5 cm (shortaxis) for nodal lesions.If a lesion was non-measurable and disappeared nearly completely after NAC,it was assigned a value of 0 mm.

Figure 1 Measurements of maximal diameters and gross tumor volume based on portal venous phase contrast-enhanced computed tomography in a 65-year-old male with adenocarcinoma of the esophagogastric junction. A: Maximal diameters of the tumor before three cycles neoadjuvant chemotherapy with docetaxel,oxaliplatin and S-1 (DOS);B: Maximal diameters of the tumor after three cycles DOS;C: Gross tumor volume (GTV) of the tumor before three cycles DOS;D: GTV of the tumor after three cycles DOS.
According to the percentage of the changes in the sum of MDs of all target lesions before and after three cycles of NAC,the responses after DOS treatment were individually divided into complete response (CR),partial response (PR),stable disease (SD) and progressive disease (PD) which were defined as follows.(1) CR: disappearance of all target lesions,confirmed at 4 wk;(2) PR: ≥ 30% decrease from baseline,confirmed at 4 wk;(3) SD: Neither PR nor PD criteria met;and (4) PD: ≥ 20% increase over smallest sum observed and overall 5-mm net increase or appearance of new lesions.Based on the above treatment responses,we used the index of disease control rate (DCR) to evaluate the response of DOS: DCR=CR+PR+SD.
Prognostic factors associated with response after DOS
Besides sex and age,the possible prognostic factors associated with responses after DOS treatment were evaluated with CT before DOS treatment.Two gastrointestinal radiologists (first author with 3 years’ experience in radiology and the corresponding authors with 25 years’ experience in abdominal radiology) assessed the Siewert Classification according to the tumor location,by consensus based on the portal-venous-phase-enhanced CT data[15].AEG was divided into three types based on the distance from the epicenter of the tumor to the gastroesophageal junction (GEJ).Tumors were classified as: type I,epicenter 1-5 cm above the GEJ;type II,1 cm above and 2 cm below the GEJ;and type III,epicenter 2-5 cm below the GEJ.
The measurement of GTV was also performed at 3D-SLICER by defining regions of interest according to the tumor area slice by slice,and we tried to avoid the air within the esophageal and gastric lumen as much as possible (Figure 1).The software automatically calculated the tumor volume.cT and cN stages before DOS determined on CT were also selected as possible prognostic factors associated with NAC response.
Inter-and intraobserver measurements of maximal tumor diameter and GTV
To ensure the accuracy of the pre and post-NAC maximal tumor diameter and pre-NAC GTV measurements in the TC and VC,two experienced radiologists (each with 3 years of radiology experience) independently measured the maximal tumor diameters and GTV to verify the interobserver repeatability.To verify intraobserver reliability,the first radiologist remeasured the maximal tumor diameters and GTV in all patients 1 month later.Before the radiologists’ measurements,a radiology professor with 25 years of experience trained them how to measure the maximal tumor diameter and GTV randomly in 20 patients.
Statistical analysis
The IBM SPSS for Windows version 25.0 (SPSS,Chicago,IL,United States) was used for statistical analysis.The continuous variables were expressed as mean ± standard deviation.Categorical variables were shown as numbers and percentages.P< 0.05 was considered statistically significant.The intra-class correlation coefficient (ICC) was used to evaluate the reliability of maximal tumor diameter and GTV measurements.ICC < 0.5,0.5-0.75,0.75-0.9,and > 0.9 was considered to have poor,moderate,good,and excellent reliability,respectively.
Theχ2test or Fisher’s test in the TC was used to assess the univariate associations of possible categorical variables with the response after NAC.The Mann-WhitneyUtest was used to determine the univariate associations of continuous variables with the response of NAC.The univariate factors with statistical significance for the response of AEG were enrolled in multivariate analysis,and binary logistic regression analysis was used to identify the independent predictors.
Establishment and validation of nomogram
The nomogram model was established based on all enrolled variables withP< 0.05 in multivariate analysis of the TC.The concordance index (C-index) was used to evaluate the performance of the nomogram in the two cohorts.Calibration curves were also plotted to compare nomogram-predicted DCR and actual DCR of the enrolled cohorts by using a 45-degree line as an optimal model in the two cohorts.Receiver operating characteristic (ROC) curves for the two cohorts were generated and compared based on the area under the curve (AUC).Nomogram,calibration and ROC were plotted by R4.2.1 with car,rms,pROC and rmda packages.
RESULTS
Inter-and intraobserver measurements agreements in the TC and VC
The interobserver agreements in the measurements of the pre and post-NAC maximal tumor diameter and pre-NAC GTV in the TC and VC were 0.969 [95% confidence interval (95%CI): 0.957-0.979] and 0.914 (95%CI: 0.881-0.939),respectively.The intraobserver agreements in the maximal tumor diameter and GTV measurements were 0.947 (95%CI: 0.927-0.963) and 0.982 (95%CI: 0.974-0.987),respectively.Because of all ICC values were > 0.9,the first measurements from observer 1 were repeatable,and were used for subsequent analysis.
Univariate analysis: association of prognostic factors with response after DOS in the TC
The associations of possible prognostic factors with the treatment response in AEG patients receiving DOS are shown in Table 2.Patients with Siewert type III had a greater chance to achieve DCR compared with patients with type II.Patientswith cT3stage tumor had a greater chance to achieve DCR than those with cT4.The larger the GTV,the poorer the response to NAC (allP< 0.05).However,age,gender and cN stage were not associated with treatment response (allP> 0.05).

Table 2 Univariate analysis of possible prognostic factors associated with responses to docetaxel,oxaliplatin and S-1
Multivariate analysis: Association of factors with response after DOS in the TC
We performed logistic regression analyses to further identify potential prognostic factors for the response to DOS in the TC.Pretherapeutic cT stage (P=0.039,OR=4.631,95%CI 1.082-14.824),GTV (P=0.007,OR=1.027,95%CI 1.007-1.046) and Siewert type (P=0.014,OR=7.639,95%CI 1.514-28.540) were independent prognostic factors for response to DOS.
Development and validation of nomogram model
The nomogram model (Figure 2) included three significant variables (cT stage,GTV and Siewert type) according to multivariate analysis of the TC.This model was used to predict the incidence of DCR.Each subtype of enrolled covariates including cT stage,GTV and Siewert type was assigned as a point.By adding the total points and positioning them on the bottom scale,we calculated DCR.
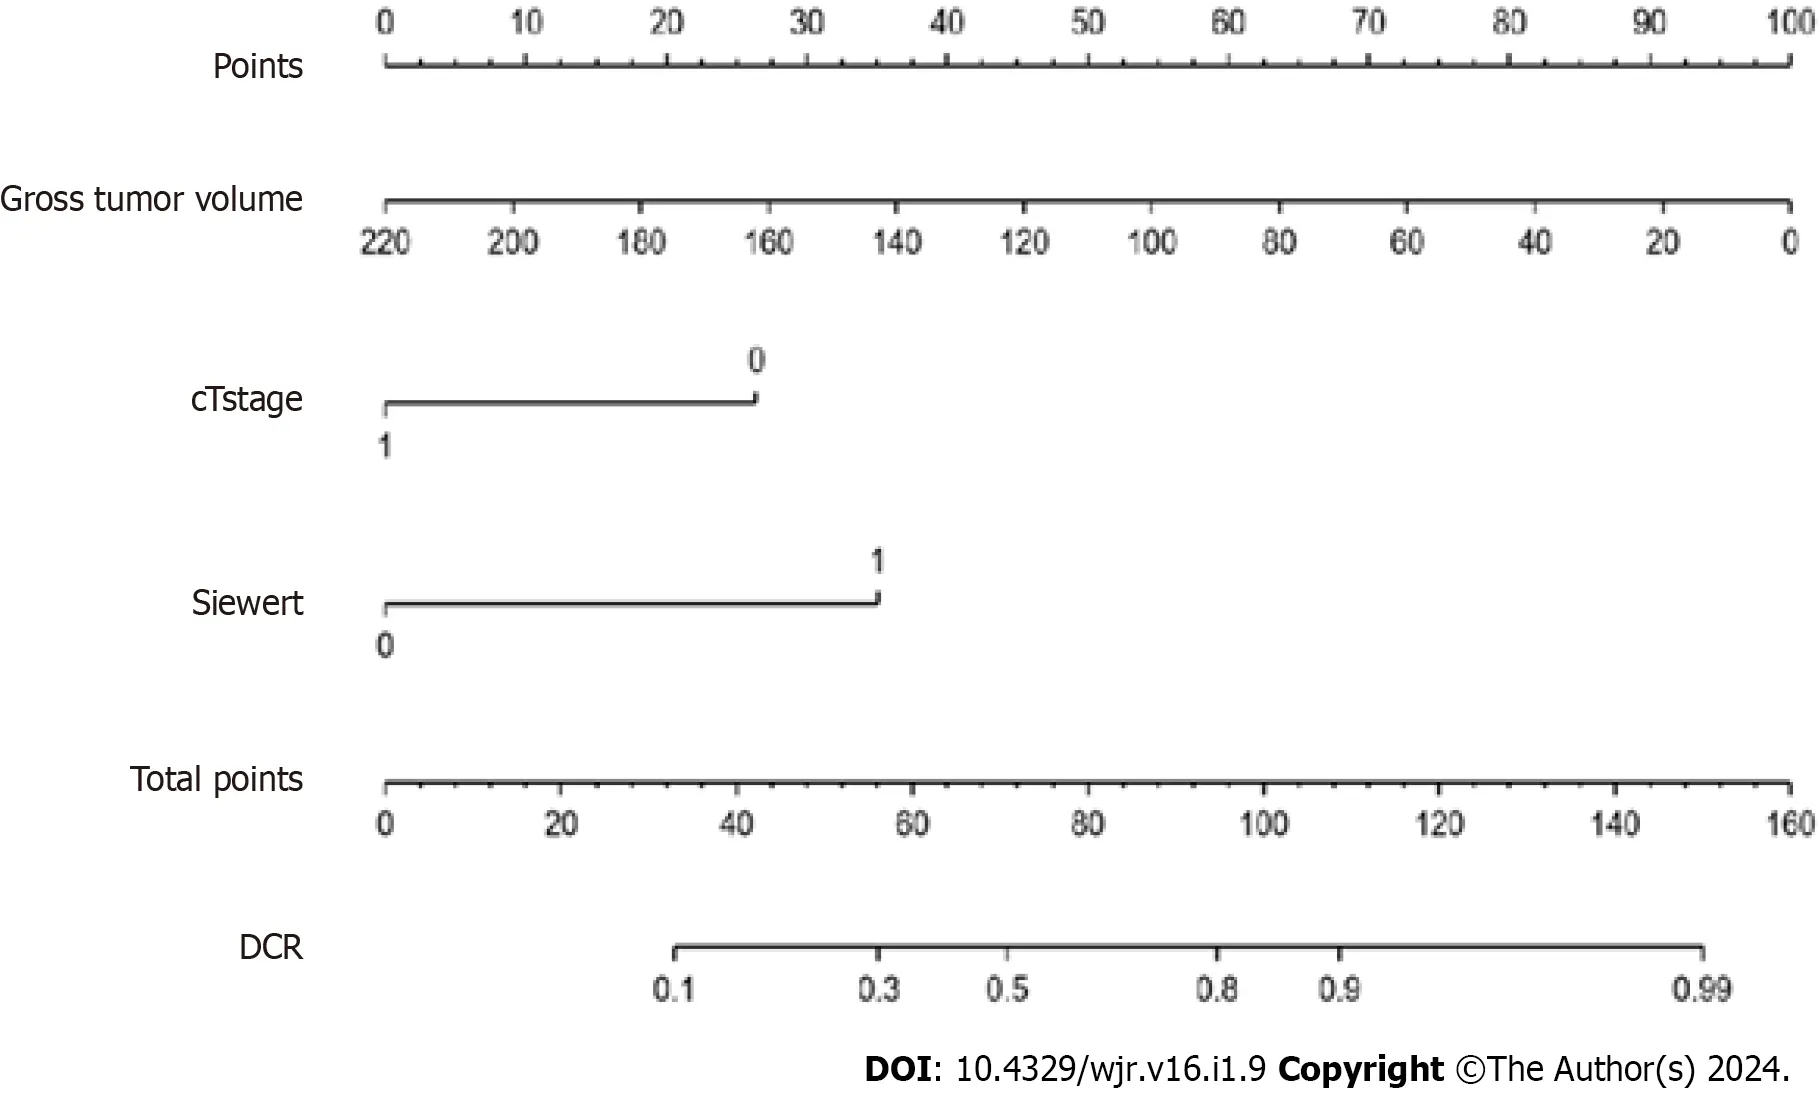
Figure 2 Nomogram was developed to predict disease control rate of adenocarcinoma of the esophagogastric junction after three cycles of neoadjuvant chemotherapy with docetaxel,oxaliplatin and S-1. DCR: Disease control rate.
In the TC,the C-index of the model was 0.838 (95%CI 0.703-0.964).In the VC,the C-index of the model was 0.824 (95%CI 0.721-0.971).The predictive accuracies of the nomogram were validated in the TC and VC.The AUC of the model was 0.838 (95%CI 0.703-0.964) in the TC,and 0.824 (95%CI 0.721-0.971) in the VC (Figure 3).The calibrations curves plots performed well in the two cohorts (Figure 4).

Figure 3 Receiver operating characteristic curves of the nomogram. A: Area under curve with 0.838 in training cohort;B: Area under curve with 0.824 in validation cohort.

Figure 4 Calibration curve of the nomogram. A: Calibration curve in the training cohort;B: Calibration curve in the validation cohort.
DISCUSSION
In this study,we investigated the possible predictors associated with treatment response,and found that pretherapeutic GTV,cT stage and Siewert type as shown on CT were independent prognostic factors.We developed a nomogram model to predict the response to DOS in advanced AEG patients.
Our study demonstrated that pretherapeutic GTV could be an independent prognostic factor of AEG after DOS treatment.This finding is supported by other reports[16,17].GTV is a comprehensive index that reflected tumor diameter and tumor invasion depth,and it has been demonstrated as a significant indicator for assessing the therapeutic response of AEG,indicating that GTV could be a prognostic factor.
As another independent prognostic factor of the response to DOS,cT stage is associated with the invasion depth of tumors,and provides prognostic estimation for clinicians.Bottetal[18] reported that patients with cT3stage esophageal adenocarcinoma were more likely to achieve DCR than those with cT4stage,illustrating that cT stage can be an effective index to predict treatment prognosis.This finding can be explained by a high expression level of special AT-rich binding protein 1 in patients with cT4stage gastric cancer,which plays a vital role in facilitating tumor invasion,metastasis and multidrug resistance,resulting in the unsatisfactory response in tumors with later cT stage[19-21].
Our study demonstrated that patients with Siewert type III AEG could benefit more from DOS than patients with type II.Studies have shown the histological differences between types II and III AEG.Compared with patients with type II AEG,background mucosa of patients with type III mainly showed moderate to marked atrophy and intestinal metaplasia,and almost half of type II AEG originated from gastritis-unrelated mucosa[22,23].AEGs with atrophy or intestinal metaplasia were less aggressive than those without these histological changes,and the prognosis of tumors with intestinal metaplasia was better than of tumors without intestinal metaplasia.Besides,AEG with atrophy or intestinal metaplasia benefited more from NAC compared with the diffuse type[7,24].
Clinically,we established a novel nomogram based on pretherapeutic cT stage,Siewert type and GTV to predict the response of DOS in patients with AEG,and the C-indexes of the models in the TC and VC were 0.838 and 0.824,respectively,suggesting good predictive ability.By identifying non-responders,the treatment strategies for these patients may be adjusted accordingly;therefore,these patients could avoid the adverse effects associated with NAC and thus prolong their survival.
The study had some limitations.First,this was a single-center study,indicating that the general applicability of our model needs further validation.Second,the sample size was small,especially for patients with CR.Our model still showed excellent performance.In the future,we will expand the sample size for further study.
CONCLUSION
In conclusion,this study illustrated that pretherapeutic cT stage,GTV and Siewert type could be independent prognostic factors for response to DOS.Based on the three independent prognostic factors,a novel nomogram was established to predict the response to DOS.We hope that our nomogram will help clinicians select suitable patients with Siewert types II and III AEG to undergo DOS,and identify non-responders to adjust the treatment strategies and to avoid toxicity associated with DOS.
ARTICLE HIGHLIGHTS
Research background
The incidence of adenocarcinoma of esophagogastric junction (AEG) has increased worldwide,and the survival rate is unsatisfactory.Generally,most patients are diagnosed in the advanced stage.Multimodal treatment has become the standard of care for locally advanced AEG.The NAC regimen for AEG patients differ regionally.Some research has indicated superiority of a docetaxel-based regimen over the established regimens,including S-1 and oxaliplatin,and cisplatin and fluorouracil.The Eastern Asia countries mostly used docetaxel,oxaliplatin and S-1 (DOS) as first-line NAC.However,research has demonstrated that patients who do not respond to DOS have a significantly worse prognosis.For docetaxel-based regimens,the key is to select AEG patients who optimally benefit from DOS and who do not respond to DOS in clinical practice.
Research motivation
The optimal treatment choice for AEG relies on the TNM staging and anatomical location.To evaluate the TNM stage and location,endoscopic ultrasound and computed tomography (CT) are the most common choices at present.Compared with endoscopic ultrasound,CT can clearly show the morphological characteristics of the tumor,in addition to cT stage,cN stage and location of the lesion,and can measure tumor diameter and volume to assess the response to NAC.To our knowledge,there is no report on the development of a model based on CT characteristics to predict the response to DOS for advanced AEG patients.
Research objectives
Our study aimed to establish and validate a novel nomogram based on CT characteristics to predict response to DOS,which could be helpful to choose optimal treatment and avoid the toxicity of DOS.
Research methods
One hundred and twenty-eight consecutive patients with confirmed Siewert type II/III AEG underwent CT before and after three cycles of NAC with DOS,and were randomly and consecutively assigned to the training cohort (TC) (n=94) and the validation cohort (VC) (n=34).Therapeutic effect was assessed by disease-control rate and progressive disease according to the Response Evaluation Criteria in Solid Tumors (version 1.1) criteria.Possible prognostic factors associated with responses after DOS treatment including Siewert classification,gross tumor volume (GTV),and cT and cN stages were evaluated using pretherapeutic CT data in addition to sex and age.Univariate and multivariate analyses of CT and clinical features in the TC were performed to determine independent factors associated with response to DOS.A nomogram was established based on independent factors to predict the response.The predictive performance of the nomogram was evaluated by Concordance index (C-index),calibration and receiver operating characteristics curve in the TC and VC.
Research results
Univariate analysis showed that Siewert type (52/55vs29/39,P=0.005),pretherapeutic cT stage (57/62vs24/32,P=0.028),GTV (47.3 ± 27.4vs73.2 ± 54.3,P=0.040) were significantly associated with response to DOS in the TC.Multivariate analysis of the TC also showed that the pretherapeutic cT stage,GTV and Siewert type were independent predictive factors related to response to DOS (odds ratio=4.631,1.027 and 7.639,respectively;allP< 0.05).The nomogram developed with these independent factors showed an excellent performance to predict response to DOS in the TC and VC (C-index: 0.838 and 0.824),with area under the receiver operating characteristic curve of 0.838 and 0.824,respectively.The calibration curves showed that the practical and predicted response to DOS effectively coincided.
Research conclusions
This study illustrated that pretherapeutic cT stage,GTV and Siewert type could be independent prognostic factors for response to DOS.Based on the three independent prognostic factors,a novel nomogram was established to predict the response to DOS.
Research perspectives
We have developed a novel nomogram based on the independent prognostic factors including pretherapeutic cT stage,GTV and Siewert type of AEG as depicted on CT to predict response to DOS.We hope that our nomogram will help clinicians select suitable patients with Siewert types II and III AEG to undergo DOS,and identify non-responders to adjust the treatment strategies and to avoid toxicity associated with DOS.
FOOTNOTES
Co-first authors:Chuan-Qinyuan Zhou and Dan Gao.
Author contributions:Chen TW,Gui Y and Zhang XM proposed the study;Zhou CQ,Gao D,Li NP,Guo WW,Zhou HY,Li R and Chen J performed the research and collected the data;Zhou CQ was responsible for patient screening,enrollment,collection of clinical and image data;Zhou CQ and Gao D measured the diameter of tumor,and Gao D divided the subjects according to the diameter changes of tumor;both authors have made crucial and indispensable contributions towards the completion of the project and thus qualified as the co-first authors of the paper;Zhou CQ and Chen TW analyzed the data and wrote the first draft;all authors contributed to the interpretation of the study and to further drafts;all authors read and approved the final manuscript;Chen TW is the guarantor.
Supported bythe National Natural Science Foundation of China,No.82271959,and the Nanchong-University Cooperative Research Project,No.20SXQT0329.
Institutional review board statement:The study was reviewed and approved by the (Affiliated Hospital of North Sichuan Medical College) Institutional Review Board [(Approval No.2023ER335-1)].
Informed consent statement:All study participants or their legal guardian provided informed written consent about personal and medical data collection prior to study enrolment.
Conflict-of-interest statement:There are no conflicts of interest to declare in this study.
Data sharing statement:Please contact the corresponding author for data requests.
STROBE statement:The authors have read the STROBE Statement-checklist of items,and the manuscript was prepared and revised according to the STROBE Statement-checklist of items.
Open-Access:This article is an open-access article that was selected by an in-house editor and fully peer-reviewed by external reviewers.It is distributed in accordance with the Creative Commons Attribution NonCommercial (CC BY-NC 4.0) license,which permits others to distribute,remix,adapt,build upon this work non-commercially,and license their derivative works on different terms,provided the original work is properly cited and the use is non-commercial.See: https://creativecommons.org/Licenses/by-nc/4.0/
Country/Territory of origin:China
ORCID number:Chuan-Qinyuan Zhou 0009-0007-9157-4577;Tian-Wu Chen 0000-0001-5776-3429.
S-Editor:Liu JH
L-Editor:A
P-Editor:Zhao S
 World Journal of Radiology2024年1期
- World Journal of Radiology的其它文章
- Anti-N-methyl-D-aspartate receptor-associated encephalitis: A review of clinicopathologic hallmarks and multimodal imaging manifestations
- From strength to precision: A systematic review exploring the clinical utility of 7-Tesla magnetic resonance imaging in abdominal imaging