
Influencing Factors on Cardiovascular Health in China
2024-03-24 10:47ShengShouHUtheWritingCommitteeoftheReportonCardiovascularHealthandDiseasesinChina
Journal of Geriatric Cardiology 2024年1期
Sheng-Shou HU;the Writing Committee of the Report on Cardiovascular Health and Diseases in China
1. Fuwai Hospital Chinese Academy of Medical Sciences,Beijing,China
ABSTRACT The Annual Report on Cardiovascular Health and Diseases in China (2022) intricate landscape of cardiovascular health in China.This is the first section of the report,which dissects influential factors across diverse domains.The investigation identifies tobacco use as a paramount concern,portraying China as the global epicenter of tobacco consumption.Cigarette smoking,exacerbated by second-hand smoke exposure,emerges as a critical and preventable risk factor,contributing to a surge in attributable deaths over the past three decades.In the realm of dietary nutrition,the study discerns an overall improvement,yet discerns worrisome deviations,notably an escalating fat intake surpassing recommended guidelines.The shifting dietary structure reveals diminished consumption of cereals and vegetables juxtaposed with an uptick in animal foods,while excessive intake of cooking oil and salt persists,straying substantially from endorsed levels.The exploration of physical activity patterns unfolds a nuanced narrative.Varied trends are observed among students,with concerns arising from sedentary behaviors and inadequate adherence to recommended guidelines.The analysis spans a trajectory of declining physical activity in Chinese adults,coupled with an alarming surge in sedentary leisure time,ultimately linking these factors to heightened risks of cardiovascular diseases and increased adiposity.An examination of overweight and obesity trends uncovers a relentless upward trajectory,projecting substantial prevalence by 2030.Noteworthy prevalence rates underscore the imperative for targeted interventions to curtail this burgeoning health crisis,with the anticipated prevalence extending to nearly two-thirds of the adult population.Psychological factors,notably depression,constitute an integral facet of cardiovascular health.Prevalence rates among patients with coronary artery disease and acute myocardial infarction underscore the intricate interplay between mental health and cardiovascular outcomes.Additionally,persistent depressive symptoms are shown to significantly elevate the risk of cardiovascular diseases and mortality.This first section underscores the multifaceted challenges facing cardiovascular health in China,emphasizing the imperative for tailored interventions across tobacco control,dietary habits,physical activity,obesity management,and psychological well-being to mitigate the escalating burden of cardiovascular diseases in the population.
TOBACCO USE
Tobacco control is one of the important public health priorities.Since the World Health Organization (WHO) “Framework Convention on Tobacco Control (FCTC)” entered into force in 2005,encouraging progress has been made to reduce tobacco use.Smoking prevalence among people aged over 15 years has fallen from 22.7% to 17.5% globally.[1]In 2018,the current smoking prevalence of people aged ≥ 15 years was 26.6% in China,[2]and the number of smokers was estimated to be more than 300 million.
Smoking Status of Chinese Population
Tobacco use among people aged ≥ 15 years
A stratified multi-phased randomized cluster sampling design was used for China Adult Tobacco Survey in 2018 to describe the current status of smoking among Chinese people aged ≥ 15 years.A total of 200 districts/counties in 31 provincial administrative units were covered,and 19,376 individual questionnaires were completed.Compared with the previous data,the smoking rate tended to drop.The prevalence of current smoking among people aged ≥15 years was 26.6% in 2018,which was decreased by 1.55% and 1.13% in comparison with the estimates in 2010 and 2015,respectively (Figure 1).The prevalence was higher among males (50.5%) than among females (2.1%) and higher among the residents in rural (28.9%) than among those in urban areas(25.1%).From 2010 to 2018,the prevalence declined substantially among the 25-44 age groups and 45-64 age groups,and the differences were both statistically significant (P< 0.05) (Figure 2).For the individuals with different education level,the most significant decline occurred among those with higher education of junior college and above,which decreased from 26.6% to 20.5% (P=0.002).[2]
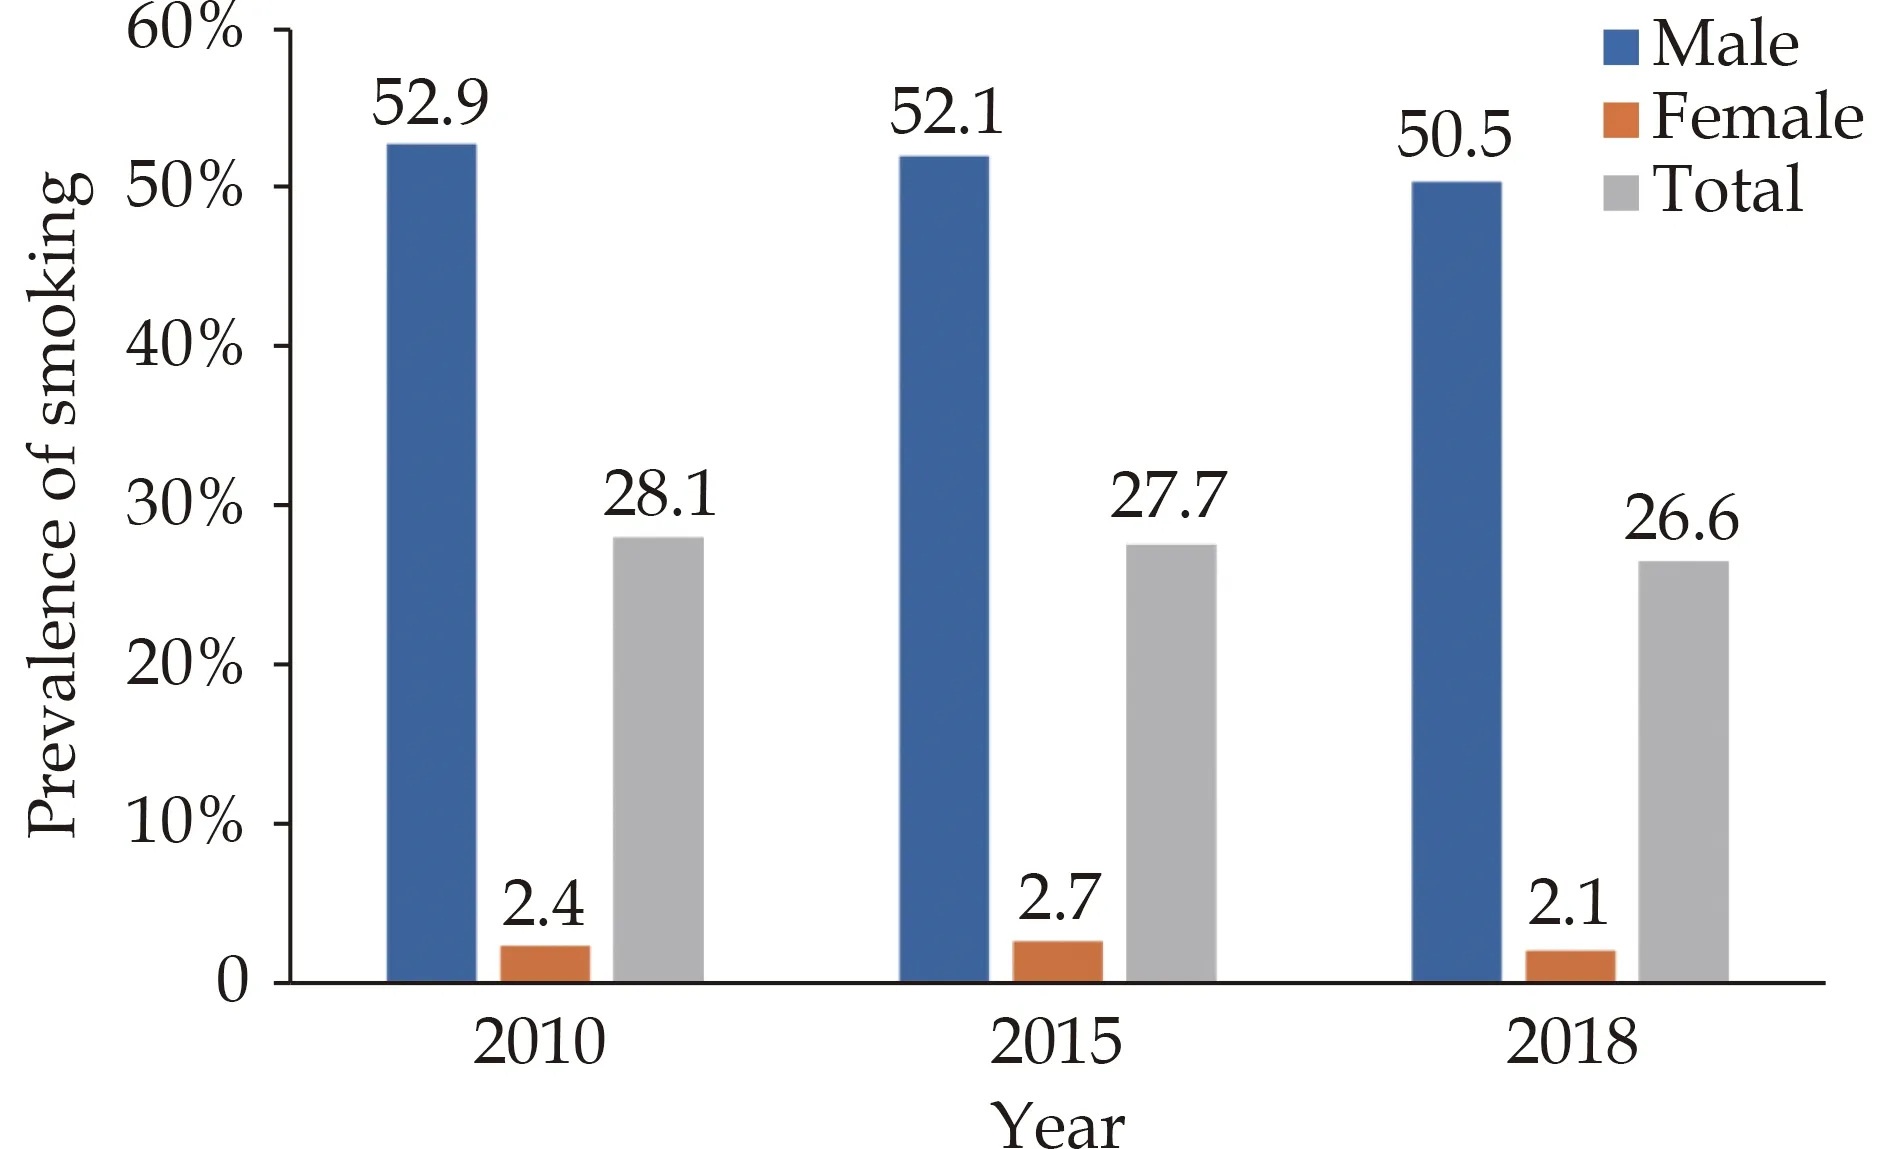
Figure 1 Prevalence of smoking from 2010 to 2018 among Chinese people aged ≥ 15 years.

Figure 2 Prevalence of smoking from 2010 to 2018 among Chinese people by age group.
Tobacco use among adolescents
Based on the framework of Global Youth Tobacco Survey (GYTS),269,250 eligible students completed the 2021 China National Youth Tobacco Survey (NYTS),which applied a 3-stage stratified cluster random sampling and covered 31 provincial administrative units.Results showed that the prevalence of ever cigarette smoking among secondary school students was 16.7%,higher for boys (23.2%) than for girls (9.5%),higher in rural areas (18.5%) than in urban areas (14.5%),and highest among vocational senior high school students (28.9%),followed by senior high school students (18.9%) and junior high school students (12.9%).Among ever cigarette smokers,66.1% smoked their first cigarette at 13 years old and before.In 2021,the prevalence of current smoking among secondary school students was 4.7%,higher for boys (7.1%) than for girls (1.9%),higher in rural areas (5.3%) than in urban areas (3.9%),and highest among vocational senior high school students (12.1%),followed by senior high school students (4.2%) and junior high school students (3.3%).The proportion of frequent smoking (defined as the students who reported smoking cigarettes on 20 or more days in the past 30 days) was 1.3%,which meant more than a quarter of current smokers were frequent smokers.Similar to ever cigarette smokers and current smokers,the prevalence of frequent smokers was much higher among boys (2.1%) than among girls (0.3%),lowest in junior high school (0.6%),followed by senior high school (1.3%),and highest in vocational senior high school (4.1%).The highest current smoking prevalence rates were reported for Xizang,Yunnan,and Qinghai,while the lowest prevalence rates were in Shanghai,Beijing,and Jiangxi.Compared with the 2019 China NYTS,the prevalence rates of ever cigarette smoking,current smoking,and frequent smoking for boys in 2021 decreased by 10.8% (26.0%vs.23.2%),26.0% (9.6%vs.7.1%),and 34.4% (3.2%vs.2.1%),respectively,while they were unchanged for girls.[3]
Electronic cigarette (e-cigarette) use
Data from China Adult Tobacco Survey revealed that 48.5% of Chinese individuals aged ≥ 15 years had heard of e-cigarettes in 2018.The proportions of Chinese people who had ever used,had used in the last 12 months,and currently used e-cigarettes were 5.0%,2.2% and 0.9%,respectively.People in the 15-24 years age group showed the highest rates of ever use,last 12-month use and current use at 7.6%,4.4%,and 1.5%,respectively.Among males,higher e-cigarette use was associated with 15-24 years age group,college/university or above education,and daily use of combustible cigarettes.Among all e-cigarette users,90.6% also used combustible cigarettes.The most common reason for e-cigarette use was smoking cessation (46.2%).[4]There is sufficient evidence to show that the use of e-cigarettes is unsafe and detrimental to human health.It will not only cause adverse effects on the physical and mental health as well as growth of the youth,but also induce them to use combustible cigarettes.[5]
Second-hand smoke exposure
Data from China Adult Tobacco Survey indicated that internet cafes (89.3%),[6]bars/nightclubs (87.5%),and restaurants (73.3%) were the most common indoor public places with severe exposure to secondhand smoke in 2018.The rates of people who saw smoking in the universities,government buildings,medical institutions,taxis,secondary or elementary schools,and public transport were 33.3%,31.1%,24.4%,23.5%,23.4% and 21.7%,respectively.
The prevalence of non-current smokers aged ≥ 15 years who were exposed to second-hand smoke in 2018 was decreased in comparison with that in 2010(68.1%vs.72.4%).The proportion of non-current smokers who saw someone smoking indoors decreased from 84.7% in 2010 to 71.9% in 2018.The most significant decline occurred in the government buildings or offices,followed by restaurants.The rates were reduced by 27.3% and 15.2%,respectively (Figure 3).[6]

Figure 3 Rate of non-current smokers who saw indoor smokers during 2010 -2018.
Smoking cessation
China Adult Tobacco Survey Report demonstrated that the rate of smoking abstinence was 20.1% among Chinese smokers aged ≥ 15 years in 2018.[7]It was higher in females (30.2%) than in males (19.6%),but no significant difference was observed between urban and rural areas.Among the individuals who had tried smoking cessation in the past 12 months,more than half of them gave up smoking because of their health issues.The top three reasons for quit attempt were concern about the adverse impact of smoking on health (38.7%),suffering from a disturbing illness (26.6%),and opposition from family members(14.9%).In addition,few of them took drugs for (4.6%)or consulted about (3.2%) smoking cessation.The main reasons for smoking quit attempt in the past 12 months are showed in Figure 4.

Figure 4 The main reasons for smoking quit attempt in the past 12 months in 2018.
Data from China Adult Tobacco Survey indicated that in 2018,66.05% of smokers aged ≥15 years had smoking relapse,in whom 66.59% were male and 55.79% were female.In all age groups,the 15-24 years age group had the highest smoking relapse rate(82.63%).Multivariate analysis showed that e-cigarette use,having seen the advertisement,promotion and sponsorship of tobacco in the past 30 days,smoking limit in home or workplace,and awareness of the hazard to result in stroke,heart disease,or lung cancer were associated with smoking relapse rate.[8]
Tobacco dependence
For ever-smokers,tobacco dependence was diagnosed if they had three or more of the following six symptoms or signs (1) craving or a strong desire or urge to use tobacco;(2) a persistent desire or unsuccessful efforts to cut down or control tobacco use;(3) experiencing tobacco withdrawal symptoms after abrupt cessation of tobacco use or reduction in the amount of tobacco used;(4) tolerance,defined as the need for markedly increased amounts of tobacco to achieve the desired effect;(5) giving up or reducing important social,occupational,or recreational activities because of tobacco use;and (6) sticking to tobacco use despite knowledge of having a persistent or recurrent physical or psychological problem that is likely to have been caused or exacerbated by tobacco.China Health Literacy Survey (CHLS) was conducted in 2018 using a multistage stratified sampling method,and 84,839 participants aged 20-69 years from 31 provincial administrative units with valid data were included in the analysis.Among general population,the prevalence of tobacco dependence was 13.1%.Among current smokers,it was 49.7%,with no difference between men and women (49.7%vs.50.8%).The prevalence of tobacco dependence was associated significantly with smoking intensity,defined by packyears,cigarettes smoked per day,and smoking starting age.Compared with those without tobacco dependence,ever smokers with tobacco dependence were less likely to be ex-smokers.In China,183.5 million adults were tobacco dependent in 2018,and 177.5 million of them were men.[9]
Harm of Tobacco Use
Cigarette smoking and second-hand smoke exposure are the major preventable risk factors for total mortality in the Chinese adults.The multivariateadjusted relative risk (RR) of death was 1.23 (95% CI:1.18-1.27) and the population-attributable fraction(PAF) risk was 7.9% for cigarette smoking.[10]A systematic analysis from the Global Burden of Disease(GBD) study 2019 indicated that the number of deaths attributable to tobacco smoking in China increased by 57.9% during 1990-2019,from 1.5 million to 2.4 million.[11]
Relationship between the duration of smoking and blood pressure in Han and ethnic populations
A large national multi-ethnic cross-sectional survey was conducted to model the relationship between duration of smoking and systolic blood pressure (SBP) in China.[12]Participants were selected through a multi-stage probability sampling procedure from 2012 to 2017,and 8,801 former or current smokers were included in this study.Their smoking behavior,blood pressure (BP),and other demographic information were collected and measured through a face-to-face interview.Results showed that the prevalence of hypertension was 41.3%,and current smokers accounted for 77.8%.For every additional year of smoking duration,SBP raised by 0.325 mmHg (95% CI: 0.296-0.354,P< 0.001).The Chinese ethnic populations (0.450 mmHg,95% CI:0.380-0.520,P< 0.001) might suffer more from the elevated blood pressure in long-term smoking than Han populations (0.283 mmHg,95% CI: 0.252-0.314 mmHg,P< 0.001).
Associations of smoking with risk of major cardiovascular events
China Cardiometabolic Disease and Cancer Cohort (4C) study enrolled 170,240 participants aged ≥40 years.During a follow-up of up to 5 years,3,520 cardiovascular events,including cardiovascular death,myocardial infarction,stroke,and hospitalized or treated heart failure,were detected.Current smoking (3.38%) significantly contributed to the risk of major cardiovascular events,on the basis of 37.42% PAF attributed to a cluster of metabolic risk factors.[13]
Impact of smoking lifestyle on the development and progression of cardiometabolic disease and cardiometabolic multimorbidity
Data from the China Kadoorie Biobank (CKB) cohort of 461,047 adults aged 30-79 years free of heart disease,stroke,and diabetes mellitus (DM) at baseline were analyzed with multi-state model to investigate the potentially different impacts of single and combined lifestyle factors (current smoking or quitting because of illness,current excessive alcohol drinking or quitting,poor diet,physical inactivity,and unhealthy body shape) on transitions from free of cardiometabolic disease (CMD) to first cardiometabolic disease (FCMD),subsequently to cardiometabolic multimorbidity (CMM),and further to death.Results from a median follow-up of 11.2 years showed that tobacco smoking played a crucial role in all transitions from healthy to FCMD,to CMM,and then to death,but to different extents (Table 1).[14]
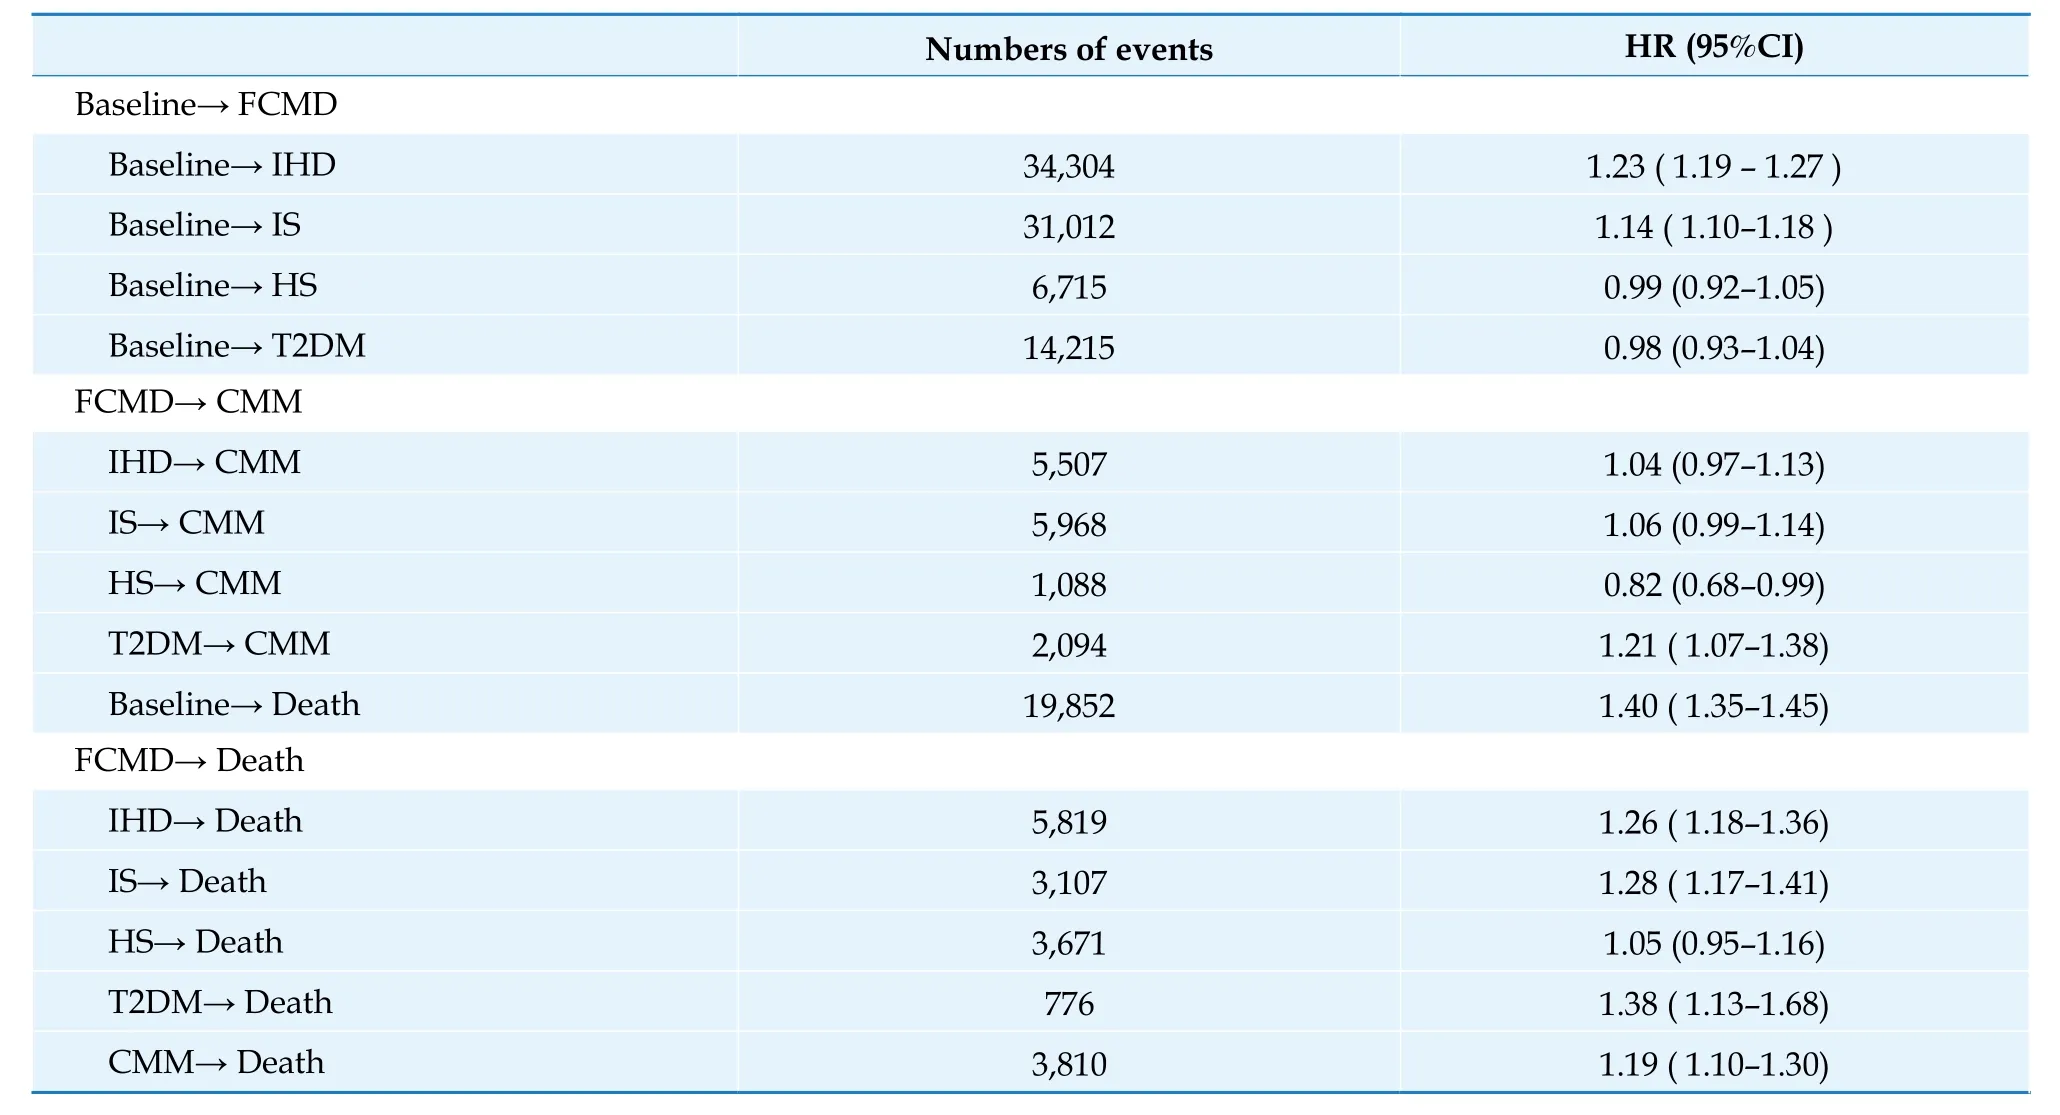
Table 1 Impacts of tobacco smoking on each transition in cardiometabolic diseases.
Policies and Evaluation of Tobacco Control
New policies of tobacco control
The “Law on the Protection of Minors in People’s Republic of China” came into effect in June 2021.It required that smoking must be forbidden in all activity places of juveniles and cigarettes should not be sold to them.“Regulations on Tobacco Control in Beijing”was revised in September 2021 on the basis of “Law on the Protection of Minors in People’s Republic of China”.In addition to the prohibition of indoor smoking,punitive measures were reinforced for the individuals who smoke in the places of children,such as kindergarten or school,and for the tobacco sellers who violate the regulation of tobacco control.
“Decision to Revise the Regulations on the Implementation of the Tobacco Monopoly Law in People’s Republic of China” was published by the State Council of the People’s Republic of China in November 2021.It added the content that “Novel tobacco products,e.g.,e-cigarettes,should be managed by reference to the relevant provisions on combustible cigarettes in these regulations”.“Administrative Measures for e-Cigarettes” was issued by the State Tobacco Monopoly Administration in March 2022 and was implemented on May 1,2022.Provisions were made for the production,sale,transportation,import and export,supervision and management of ecigarettes.Special rules were highlighted to ban the sale of flavored (but not classic) e-cigarettes and ecigarettes that smokers can add aerosol by themselves.The mandatory national standard “GB 41700-2022 Electronic Cigarette” was released by State Administration for Market Regulation on April 8,2022.It made substantial requirements for the production of e-cigarettes.
Evaluation on the policies of tobacco control in China
FCTC has a groundbreaking significance in the history of global tobacco control.It came into force in China in January 2006.Although some achievements have been made since then,the progress is still slow.“WHO Report on the Global Tobacco Epidemic” was published in July 2021.[1]The implementation of convention in each contracting country was evaluated by WHO according to the 6 MPOWER measures,which were: Monitor tobacco use and prevention policies;protect people from tobacco use;offer help to quit tobacco use;warn about the dangers of tobacco;enforce bans on tobacco advertising,promotion,and sponsorship;and raise taxes on tobacco.The performance for each measure was graded as 4 classes,from I (the best) to IV (the worst).
As for the MPOWER measures that was implemented in China,M (Monitor) and W (Warn) were rated as class I,but P (Protect) was regarded as class IV.It was requested by FCTC that China should have a comprehensive smoking ban before 2011 in the public transport,indoor workplaces,indoor public places and,as appropriate,other public places.Despite the fact that smoke-free laws have been implemented in more than 20 provincial administrative units or cities,such as Beijing,Shanghai,Shenzhen,and Xi’an,only 15.9% of the Chinese population have been covered.Graphic health warnings on tobacco packaging have been adopted in 134 countries and regions globally,but they are not mandated in China yet.
Summary
Tobacco use causes immense burden on the health of Chinese residents.“Healthy China Action (2019-2030)” includes 15 specific projects,and the fourth is tobacco control.It was clarified that smoking poses a serious threat to people’s health and proposed measures including promoting individuals and families to fully understand the serious hazards of smoking and exposure to second-hand smoke;encouraging the government officials,healthcare professionals,and teachers to take a lead in the action of tobacco control;building each government agency,medical organization,and educational institution into a smokefree place;exploring comprehensive measures including tax and price policies and increase the efficacy of tobacco control;improving the content and form of health warnings on tobacco packaging;protecting at least 30% of the population in China by smokefree laws in 2022 and 80% in 2030;reducing the smoking rate among adults below 20% in 2030.The current tobacco control policies in China are expected to cut down the prevalence of tobacco use by reducing the demand for and supply of tobacco products,and to achieve the goal of “Smoke-free China”.
DIETARY NUTRITION
Current Situation and Trend of Dietary Nutrition
The status of dietary nutrition among Chinese residents has been improved on the whole.Data from the China Nutrition and Health Surveillance (CNHS)2015-2017 indicated that the average energy intake per reference person per day was 2007.4 kcal.It was adequate for energy and intake of macronutrients,including carbohydrate,protein,and total fat.The trend in average daily energy intake decreased in Chinese population.The proportion of energy intake from protein changed little,but that from carbohydrates declined apparently.The contribution of fat-to-energy intake increased and had exceeded the Chinese Dietary Guidelines (CDG) recommendation (20%-30%) since 2012 (Figure 5).The proportion of energy intake from fat in rural area was 33.2% during 2015-2017,which broke the upper limit of recommendation (30%) for the first time.[15-18]The proportions of calorie intake from different food also changed.A study retrieved data from Global Statistical Database,Food and Agriculture Organization of the United Nations,and China Health and Nutrition Survey (CHNS) and reviewed data from original articles and review papers.Findings indicated that during 1990-2019,the industrially processed food calorie share increased from 1.5% to 28.7% and animal calorie intake increased from 9.5% to 30.0% in China(Figure 6).[18]

Figure 5 Trend in percentage of energy intake from carbohydrate,protein,and fat among Chinese residents from 1982 to 2015. Data sources: 1982-2012 China National Nutrition Surveys(CNNS) and 2015 CACDNS.
In general,the trend in dietary structure among Chinese residents during 1982-2015 was characterized as decreased intake of cereals and vegetables and increased intake of animal foods with pork dominating.[15-17]Intake of fruits,eggs,seafood,dairy products,and soybeans remained at a low level (Figure 7).Daily intake of cooking oil increased and that of cooking salt decreased.But both of them were substantively far above the recommendations (Figure 8).

Figure 7 Trend in dietary structure among Chinese residents from 1982 to 2015. Data sources: 1982-2012 CNNS and 2015 CACDNS.
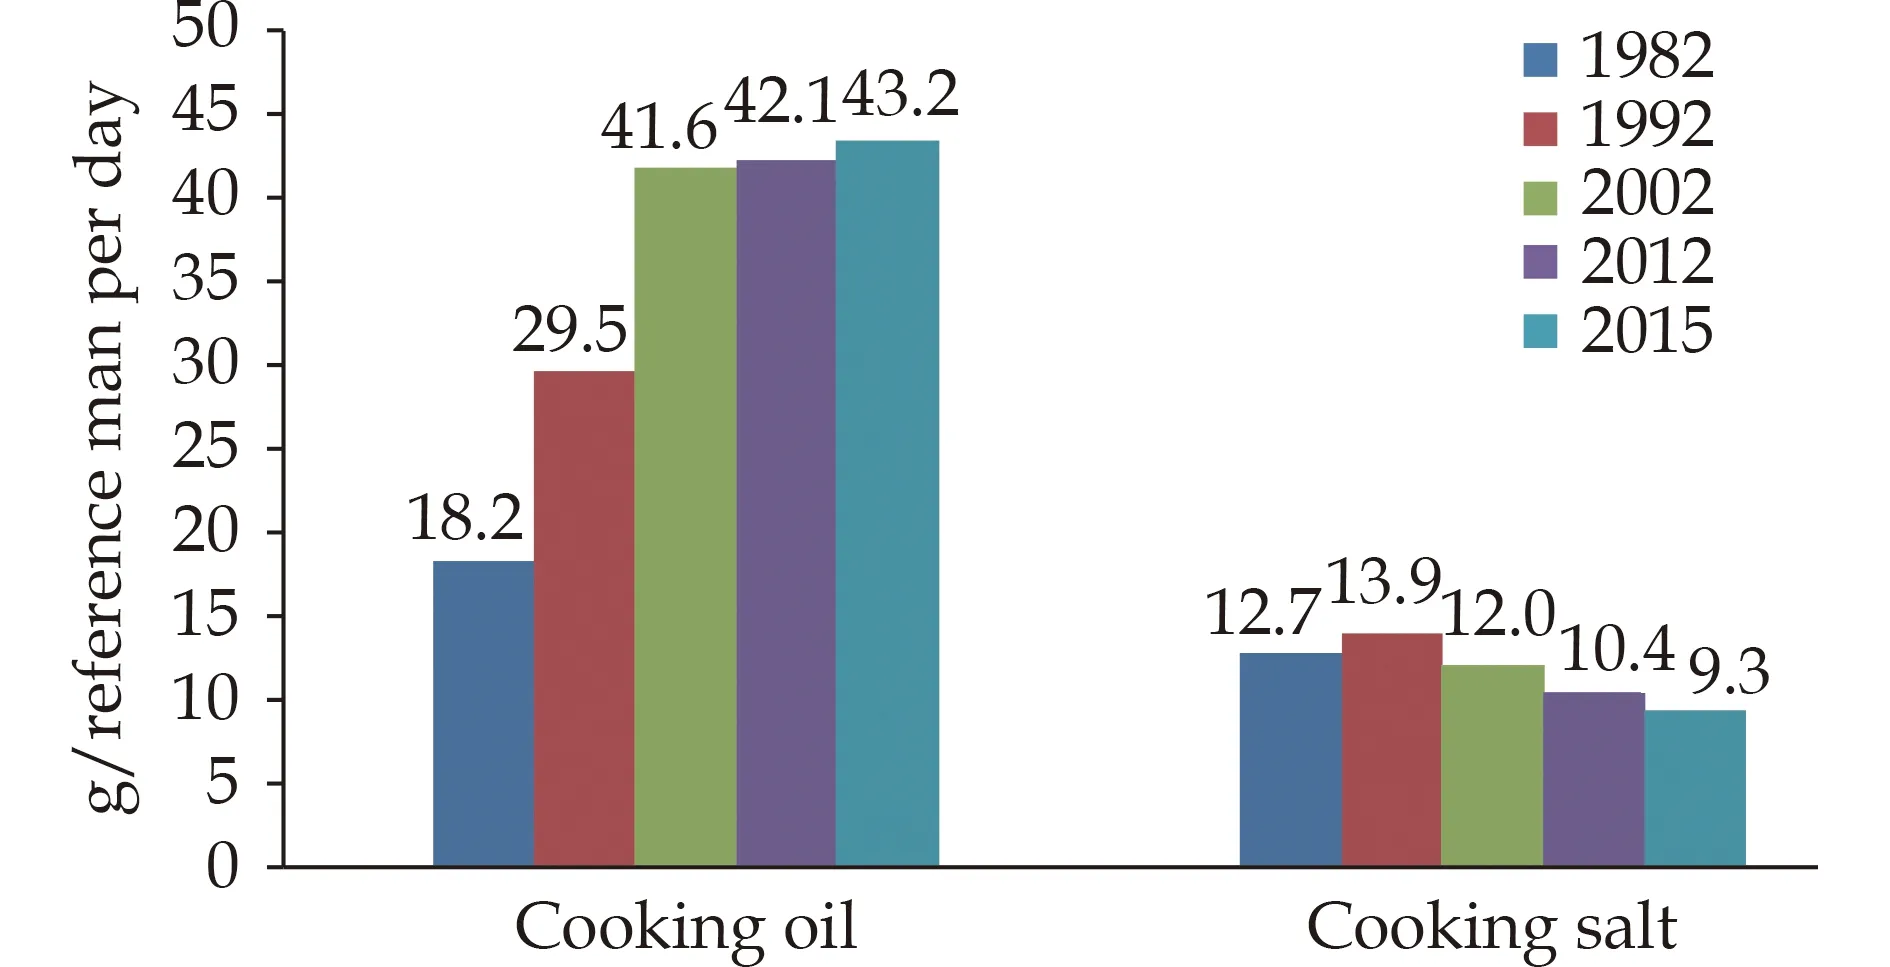
Figure 8 Trend in consumption of cooking oil and salt among Chinese residents from 1982 to 2015. Data sources: 1982-2012 CNNS and 2015 CACDNS.
“Report on the Status of Nutrition and Chronic Diseases of Chinese Residents 2020” showed that Chinese residents also had some unhealthy dietary behaviors.[17]The prevalence of frequent sugary drinks intake (defined as ≥ once per day or ≥ 5 days per week)was 18.9% among Chinese children aged 6-17 years during 2016-2017 (Figure 9).For Chinese drinkers aged ≥ 18 years,the average alcohol intake in 2018 increased by 0.4 L compared with that in 2012.The prevalence of frequent drinking (defined as ≥ 5 days per week in the last year) was 19.9% among them,and that of harmful drinking (defined as an average daily alcohol intake ≥ 61 g for males and ≥ 41 g for females) was 8.6%,which was decreased by 0.7% in comparison with that in 2012 (Figure 10).Although significant evidence for the J-shaped curve was found for cardiovascular diseases (CVD),alcohol consumption,regardless of amount,led to an increased risk of breast cancer or tuberculosis in females and of lip and oral cavity cancer or tuberculosis in males.No alcohol use minimized the overall risk to health.The risk rose monotonically with increasing amounts of daily drinking.[19]Therefore,adults had better not drink alcohol.If you drink,the amount should be limited,and the daily alcohol intake is recommended as < 15 g.Alcohol use should be forbidden for children,pregnant women,and breast-feeding mothers.[20]

Figure 9 Prevalence of frequent sugary drinks intake among Chinese children aged 6-17 years during 2016-2017.

Figure 10 Trend in prevalence of harmful drinking among Chinese drinkers aged ≥ 18 years during 2012-2018.
Association of Dietary Nutrition with CVD and Its Risk Factors
Association of dietary intake with CVD and its risk factors
Substantial evidence from population studies has confirmed that dietary intake is significantly associated with CVD,DM,hypertension,and such diseases.Increased consumption of cereals,vegetables,and fruits,frequent drinking tea,and adequate intake of soybeans and nuts are helpful to decrease the risk of CVD and death.Increased consumption of cereals,oat,and green or yellow vegetables,adequate intake of coffee,and frequent drinking tea will reduce the risk of T2DM.Adequate intake of soybeans,nuts,and algae is associated with declined risk of dyslipidemia.Moderate increment in the consumption of fishes beneficial to reduce the risk of stroke among adults.On the contrary,excessive intake of livestock meat,trans-fatty acids,cooking salt,alcohol,and sugary drinks will increase the risk of CVD,DM,hypertension,stroke,and the like.[17]
No researches have yet found that intake of eggs is associated with CVD and dyslipidemia among general population.A study utilized the data of CHNS from 1991 to 2015 and included 8,095 participants in the final analysis.During a median follow-up duration of 11.4 years and after adjustment for the multivariate factors,consuming more than seven eggs per week was related to 29% lower mortality among the hypertensive patients compared with the consumers with not more than 2 eggs per week [hazard ratio (HR)=0.71,95% CI: 0.59-0.85;P< 0.001].Similarly,the egg-sourced cholesterol intake was inversely associated with mortality (P=0.002) whereas intake of dietary cholesterol from nonegg sources was significantly related to the higher mortality (P< 0.001).However,total cholesterol intake was not related to mortality among hypertensive patients.Substituting eggs for an equivalent amount of non-egg-sourced protein-abundant foods was also associated with lower mortality.[21]A nested case control study selected 4,778 participants (3,401 CVD cases and 1,377 controls) aged 30-79 years based on the CKB and partially explained the protective effect of moderate egg consumption on CVD.Egg consumption was positively associated with apolipoprotein A1,acetate,mean high-density lipoprotein (HDL) diameter,and lipid profiles of large and very large HDL,and inversely associated with total cholesterol and cholesterol esters in small very lowdensity lipoprotein (VLDL).[22]
A study analyzed the data of 16,117 participants who were free of DM at baseline from CHNS 1997-2015.During a median follow-up duration of 9.0 years,1,088 (6.7%) participants developed new-onset DM.There was a significant inverse association between dietary variety score and the risk of new-onset DM(per one point increment;HR=0.85,95% CI: 0.80-0.90).When dietary variety score was categorized as quartiles,multivariate-adjusted HRs (95% CI) of new-onset DM were 1.00,0.75 (0.63-0.91),0.59 (0.48-0.72),and 0.56 (0.45-0.70) for Q1 (score < 4.5),Q2(4.5 to < 5.4),Q3 (5.4 to < 6.5),and Q4 (≥ 6.5),respectively.In addition,there were U-shaped associations of refined grains,whole grains,nuts,red meat,poultry,processed meat,dairy products,and aquatic products intake with DM,and L-shaped associations of legumes,vegetables,fruits,and eggs intake with DM(allr< 0.001 for nonlinearity.[23]
Association of dietary patterns with CVD and its risk factors
Dietary pattern is associated with incident DM.The Guizhou Population Health Cohort Study (GPHCS)started from 2010 and included 7,023 eligible adults who did not have DM at baseline.During an average follow-up of 7.05 years,749 new T2DM cases were identified.Two main dietary patterns were characterized by factor analysis,i.e.,vegetable-grain pattern and junk food pattern.In the multivariate analysis after adjustment for potential confounding factors,28% and 20% lower risks of T2DM were observed at the low intake of junk food pattern (HR=0.72,95% CI: 0.61-0.87) and at the high intake of vegetable-grain pattern (HR=0.80,95% CI: 0.67-0.95),respectively,compared with the medium intake of such patterns.[24]
Dietary pattern is associated with incident hypertension.The above GPHCS included 5,442 eligible adults who did not have hypertension at baseline.A total of 1,177 new hypertension cases were identified during an average follow-up of 6.97 years.In the multivariate-adjusted analysis,a low intake of the junk food pattern (HR=0.772,95% CI: 0.671-0.887) and a high intake of the vegetable-grain pattern (HR=0.774,95% CI: 0.669-0.894) were significantly associated with a reduced risk of incident hypertension,compared with the medium intake of such patterns.[25]A multi-center,single-blind,randomized feeding trial was conducted among participants aged 25-75 years with baseline SBP 130-159 mmHg for four major Chinese cuisines (Shandong,Huaiyang,Cantonese,Szechuan).A total of 135 participants were randomized on the Chinese hearthealthy (CHH) diet and 130 on the control diet.CHH diet had reduced energy from fat by 5%-8%,increased energy intake from protein by 3.5%-5.5%,and increased energy from carbohydrates by 0-5%,respectively.Further,dietary sodium intake reduced from nearly 6000 mg/day to 3000 mg/day;fiber intake increased from 11 g/day to 30 g/day;and potassium intake increased from < 1700 mg/day to 3,700 mg/day.After a 28-day intervention period,the net difference in the change of SBP in the CHH diet group from baseline to the end of the intervention was -10.0 mmHg (95% CI: -12.1 to -7.9) compared with the control diet group (P< 0.001).For diastolic blood pressure (DBP),the net difference was -3.8 mmHg (95% CI: -5.0 to -2.5).The incremental cost-effectiveness ratio per 1 mmHg SBP reduction was 0.4 China Yuan (CNY) per day.No difference in the number of adverse events was found between the two groups (P=0.259).It suggested that the CHH diet was palatable and cost-effective in reducing BP in Chinese adults with hypertension.[26]China Multi-Ethnic Cohort (CMEC) study was undertaken between 2018 and 2019 in Southwestern China,covering the Qinghai-Tibet Plateau,Yunnan-Guizhou Plateau and Szechuan Basin.The final study sample consisted of 68,834 participants.Overall,all five dietary patterns [two a priori dietary patterns,i.e.,Dietary Approaches to Stop Hypertension (DASH) and alternative Mediterranean (aMED)style diets,and three a posteriori dietary patterns,i.e.,Qinghai-Tibet Plateau,Yunnan-Guizhou Plateau and Szechuan Basin dietary pattern] showed considerable associations with risks of hypertension and metabolic syndrome (MS).Comparing the highest quintile with the lowest quintile,the DASH score showed the strongest inverse associations with risks of hypertension [odds ratio (OR)=0.74,95% CI: 0.70-0.79;the proportion mediated by overweight (PM)=10%] and MS (OR=0.79,95% CI: 0.74-0.85;PM=35%);conversely,scores of the localized a posteriori Yunnan-Guizhou plateau dietary pattern showed the strongest positive associations with risks of hypertension (OR=1.44,95% CI: 1.35-1.52;PM=10%) and MS (OR=1.35,95% CI: 1.26-1.46;PM=33%),with allP< 0.001 for trend.These associations were consistent in various subgroups defined by sex,age,smoking and physical activity,but with magnitudes that differed substantially across different ethnic regions and urbanicity.[27]
Dietary pattern is associated with dyslipidemia.A total of 3,387 elderly participants aged ≥ 60 years living in Northern China (including Beijing municipality,Tianjin municipality,Hebei province,Shandong province,Shanxi province,and the Inner Mongolia autonomous region) were analyzed in a study.The data were from 2015 China Adults Chronic Diseases and Nutrition Surveillance (CACDNS).Three dietary patterns were identified: balanced,Western,and thrifty.After adjustment for potential confounding factors,participants with highest score versus lowest score in the balanced dietary pattern had a decreased risk of low HDL cholesterol (HDLC) (OR=0.38,95% CI: 0.16-0.88;P=0.013 for trend)in the group with a body mass index (BMI) ≥ 27.1 kg/m2.Compared with the lowest quartile,there was a significantly negative association between the highest score of the Western dietary pattern and low HDL-C (OR=0.37,95% CI: 0.17-0.82;P=0.018 for trend) in the group with a BMI of 21.6-24.8 kg/m2.However,greater adherence to a thrifty dietary pattern (highest quartilevs.lowest quartile) was associated with an increased risk of low HDL-C (OR=3.31,95% CI: 1.05-10.40;P=0.044 for trend),especially in the subgroup with a BMI ≤ 21.6 kg/m2.[28]
Policies,Actions and Guidelines on Healthy Diet
In order to advocate healthy diet among residents,China has issued and implemented a series of policies,such as “Healthy China 2030 Plan” and “National Nutrition Plan (2017-2030)”.At the same time,a range of national actions and projects have been carried out,for example,the “Healthy Diet Action”of “Healthy China Action (2019-2030)” and “Special Action for Three Reductions and Three Health Benefits (salt reduction,oil reduction,sugar reduction,healthy bones,healthy weight,and healthy oral cavity)” of “China Healthy Lifestyle for All ”.
The new edition of “Dietary Guidelines for Chinese Residents (2022)” was released by Chinese Nutrition Society (CNS) in 2022.It was developed on the principles of nutriology and according to the actual status of dietary consumption and nutrition in Chinese residents.Eight rules of balanced diet were recommended for the general population aged > 2 years: eat a variety of foods and collocate diets rationally;keep diet and physical activity in balance and maintain a healthy body weight;consume plenty of vegetables,fruits,dairy products,whole grains,and soybeans;consume an appropriate amount of fish,poultry,eggs,and lean meat;reduce cooking salt and oil and limit sugar and alcohol;eat regularly and drink enough water;be good at cooking dinner and picking foodstuff and be able to read nutrition facts;use serving chopsticks and never waste food.In addition,a variety of dietary guidelines have been proposed for special groups,such as pregnant and lactating women,infants,children,old people,and vegetarians.[20]
Summary
The problem of unbalanced dietary structure is prominent among Chinese residents.The energy supply ratio of dietary fats continues to rise,and consumption of cooking oil and salt is far above the recommendations,but the intakes of fruits,dairy products,soybeans and bean products are inadequate.Such unbalanced dietary structure is a crucial factor for the increased risk of DM,hypertension,dyslipidemia,CVD and death.We should push forward healthy diet action,propagate scientific knowledge of nutrition and health,create healthy food environment,help residents to choose food reasonably and collocate diets rationally.All these efforts are necessary to prevent and reduce the incidence of CVD and other chronic diseases.
PHYSICAL ACTIVITY
Physical activity is defined as any bodily movement produced by skeletal muscles that results in energy expenditure.[29]It contains four elements: frequency,intensity,type and duration.Physical activity can further be classified by the level of intensity: light[< 3.0 metabolic equivalents (MET)],moderate (3.0-5.9 MET),and vigorous (≥ 6.0 MET).Sedentary behavior is defined as any waking behavior characterized by an energy expenditure ≤ 1.5 MET while in a sitting or reclining posture.Volume of physical activity is usually estimated by the product of intensity(MET) and time (min or h).The weekly activity is expressed as MET ·h/7d or MET ·min/7d.
Assessment of physical activity at the level of population is usually based on the data of each individual,which is accomplished by either subjective questionnaires or objective motion sensors (such as a pedometer or accelerometer).It is widely recommended that an adult should do at least 150 min of moderate-intensity aerobic physical activity or at least 75 min of vigorous-intensity aerobic physical activity or an equivalent combination of moderate-and vigorous-intensity activity throughout the week.Adults should also do muscle strengthening activities and limit the amount of time spent being sedentary.[30,31]The commonly used index for assessment of physical activity in Chinese population is the prevalence of regular physical activity,which is defined as the proportion of individuals who take moderate-to vigorousintensity physical activity at least 3 times a week and for 30 min or more each time.Recommendations call for students in primary and middle schools to engage in at least 60 min of daily moderate-to vigorous-intensity physical activity (MVPA).The feature and trend of physical inactivity are quite common among Chinese residents.
Epidemiology and Trend
Youth
Physical Activity and Fitness in China-The Youth Study (PAFCTYS) recruited more than 120,000 children in 2016 and more than 130,000 children in 2017 from primary and middle schools across 31 provincial administrative units in China.Analysis of valid data indicated that compared with the prevalence in 2016,estimate from 2017 showed an upward move in the proportion of students meeting MVPA recommendations in the primary and junior middle schools,but not in junior high school (Figure 11).[32,33]In 2017,only 5.12% of the students in primary and junior middle school met the 24 h movement guidelines,i.e.,≥ 60 min of daily MVPA,≤ 2 h of daily leisure screen time,and appropriate sleep duration(9-11 h for age 6-13 years and 8-10 h for age 14-17 years).[34]In 2016,the prevalence of daily screen viewing time ≥ 2 h spent on TV,mobile phone,or computer in the students of primary and middle schools on weekdays was 8.7%,11.5%,and 9.0%,respectively.While on weekends,it increased to 23.7%,27.7%,and 17.5%,respectively.These estimates were higher in boys than in girls.The prevalence of daily screen viewing time ≥ 2 h on weekdays was lower in urban areas than in rural areas,but that of viewing mobile phone or computer on weekends was higher in urban areas than in rural areas.

Figure 11 Prevalence of meeting MVPA recommendations for Chinese students in 2016 and 2017. Meeting physical activity recommendations was defined as MVPA time ≥ 60 min per day.MVPA: moderate-to vigorous-intensity physical activity.
Data of 80,413 children and adolescents from the 2019 PAFCTYS indicated that 39.3% of the students reported engaging ≥ 3 days of muscle-strengthening exercise (MSE) per week and were classified as meeting the MSE recommendations.The prevalence was 45.3% among boys and 34.1% among girls;42.3% in urban areas and 35.5% in rural areas;43.7% in 4th-6th graders,43.4% in 7th-9th graders,and 28.1% in 10th-12th graders.[35]
Six waves of Chinese National Survey on Students’ Constitution and Health (CNSSCH) were conducted from 1985 to 2014 and covered 738,523 Chinese Han students in primary and middle schools aged 13-18 years.[36]Results showed that the overall prevalence of excellent health status and physical fitness decreased on the whole.The differences among years were statistically significant (P< 0.001)(Figure 12).Data of 4341 children aged 6-17 years in CHNS indicated that from 2004 to 2015,the prevalence of physical inactivity among the participants increased by 5.5%.The physical activity volume declined by 5.8 MET ·h/week,and the time spent on sedentary behaviors increased by 1.8 h/week.[37]

Figure 12 Prevalence of excellent health status and physical fitness among Chinese Han students in primary and middle schools from 1985 to 2014.
Adults
Data from CHNS indicated that the total physical activity among Chinese adults fell from 399 MET h/week to 213 MET h/week during 1991-2009.[38]From 1991 to 2011,the occupational physical activity decreased by 31% in male adults,and a similar decline was observed in females.[39]
China Chronic Disease and Nutrition Surveillance (CCDNS) was a periodical cross-sectional survey that was conducted in 298 districts/counties across 31 provincial administrative units in China.[40]In 2015,the prevalence of regular leisure-time physical activity (LTPA) among adult residents aged ≥ 18 years was 12.5%,higher in urban areas (18.1%) than in rural areas (8.5%).The prevalence increased slightly when compared with the estimate in 2010 (11.9%),but remained low in China.Except the population aged ≥ 65 years,the lowest prevalence of regular LTPA was in the group aged 25-34 years,while the highest was in those aged 18-24 years (Figure 13).

Figure 13 Prevalence of regular LTPA among Chinese adults aged ≥ 18 years in 2015. Regular LTPA was defined as engaging moderate or vigorous leisure-time physical activity or an equivalent ≥ 30 min per day and ≥ 3 days per week.LTPA: leisure-time physical activity.
Data from CHNS indicated that the time being sedentary of Chinese adults increased from 15.1 hours per week in 1991 to 20.0 hours per week in 2009.[38]CCDNS showed that the sedentary leisure time of adults aged ≥ 18 years in 2018 was 3.2 hours per day,[41,42]which was close to that in 2013 (3.3 hours per day),but significantly higher than that in 2010 (2.7 hours per day).
Association of Physical Activity with Risk of CVD and Mortality
Impact of physical activity on cardiovascular health
A population-based survey was conducted among 21,571 Chinese children aged 5-6 years from 66 kindergartens in Tianjin during 2016-2018.As compared to physical activity ≥ 2 h/day,physical activity < 1 h/day was associated with a higher risk of abnormal fasting glucose independently of BMI(OR=1.79,95% CI: 1.10-2.91;P< 0.05).[43]
Data of a cross-sectional survey among 214,301 students aged 7-18 years from CNSSCH in 2014 revealed that the prevalence of hypertension,systolic hypertension,and diastolic hypertension declined with the increase of 6 physical fitness indicator (PFI)percentile groups (< P20,P20,P40,P60,P80,and ≥P80).The OR was 0.87-0.68 for hypertension,0.86-0.75 for systolic hypertension,and 0.85-0.59 for diastolic hypertension (allP< 0.001 for trend).[44]
Analysis of data from 26,093 Chinese adult residents in two independent surveys in Nanjing and Hefei during 2011-2013 indicated that the odds of having ≥ 1,≥ 2,and ≥ 3 CVD modifiable risk factors(CVDMRF,including dyslipidemia,hypertension,diabetes,cigarette smoking,and overweight) for moderate physical activity group (600-3,000 MET min/7 day) and high physical activity group (≥3,000 MET ·min/7d) decreased by 12%-19% with low physical activity (< 600 MET min/7 day) as reference group (Table 2).[45]
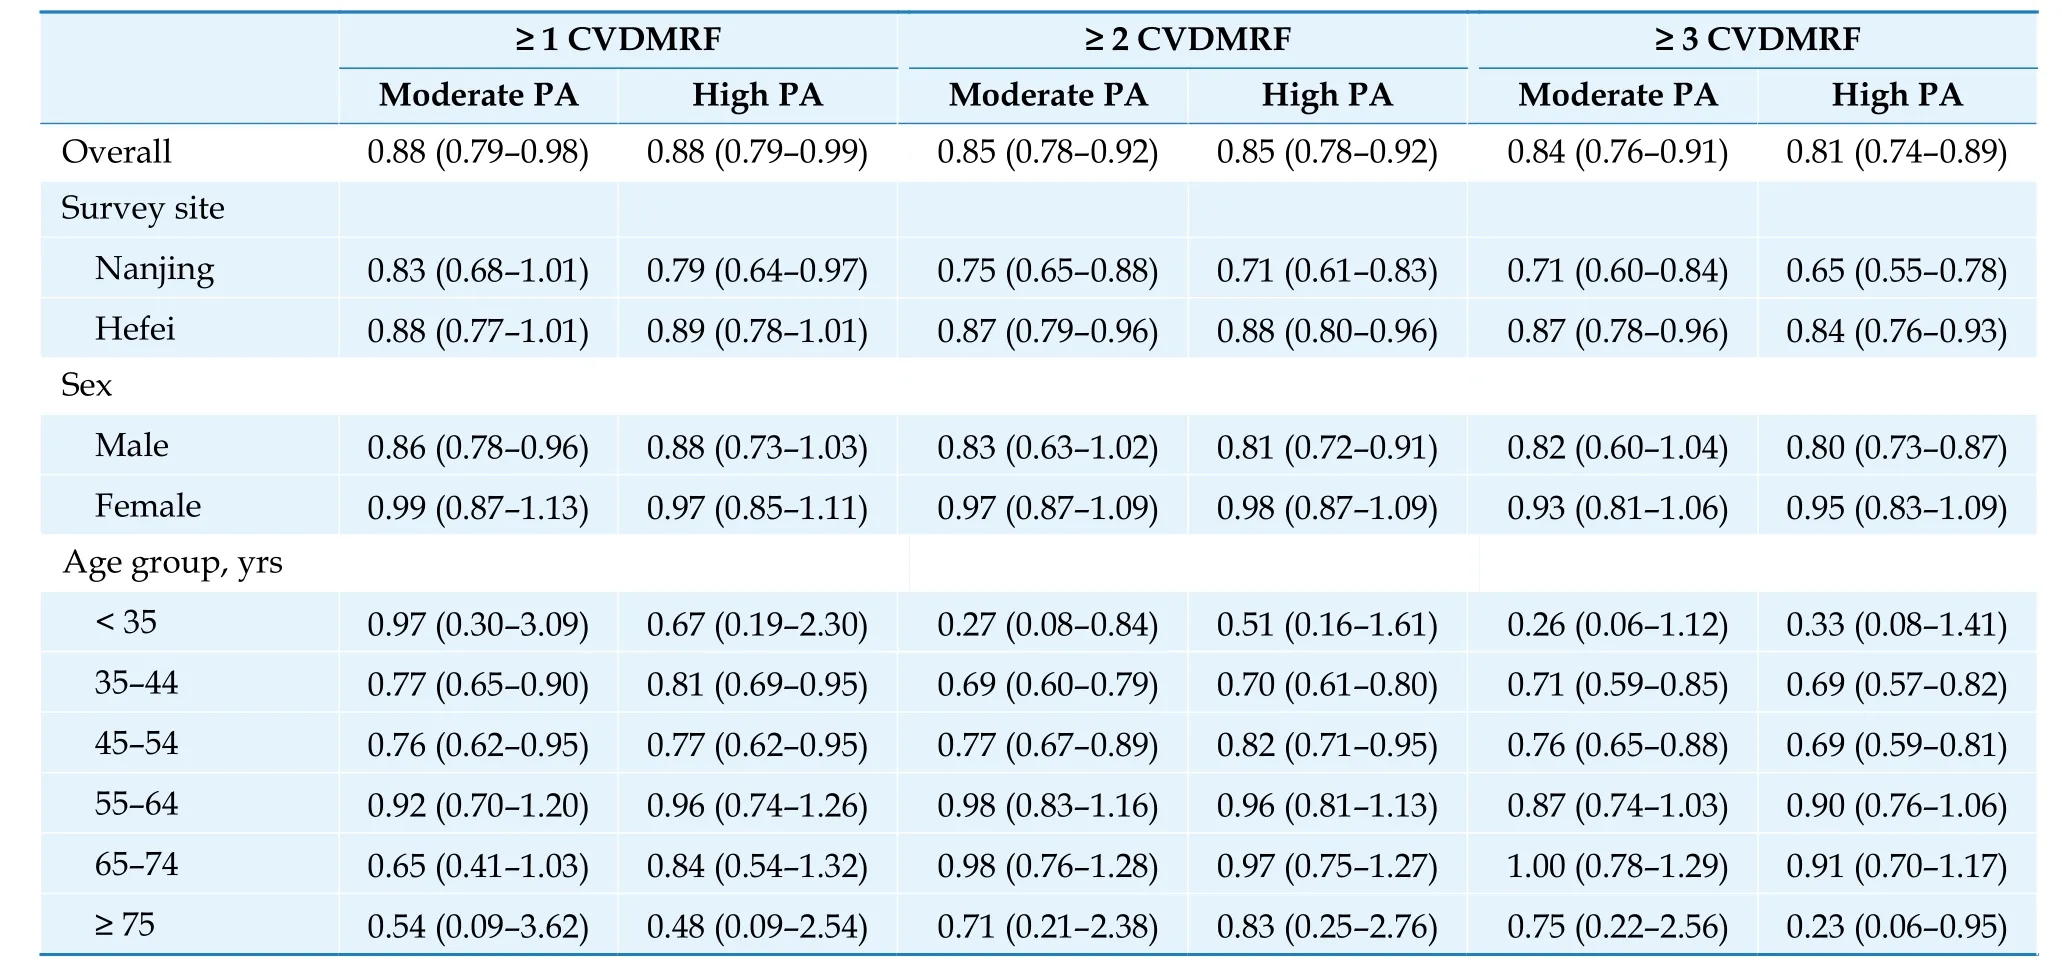
Table 2 Adjusted association between physical activity scores category and odds of having ≥ 1, 2, 3 CVDMRF (OR, 95% CI).
Community Intervention of Metabolic Syndrome in China &Chinese Family Health Study (CIMIC)was conducted during 2007-2008 in rural areas of four provincial administrative units.The follow-up study of incident hypertension was performed during 2012-2015.More than 41,000 participants aged ≥18 years and free from hypertension at baseline were included in the final analysis.[46]There was a significantly negative association between physical activity and incident hypertension (P< 0.001 for trend).Compared with participants in the first quartile (lowest volume) of physical activity,HR of incident hypertension decreased by 8%,28% and 30% for those in the 2nd,3rdand 4thquartile volume of physical activity,respectively (Table 3).
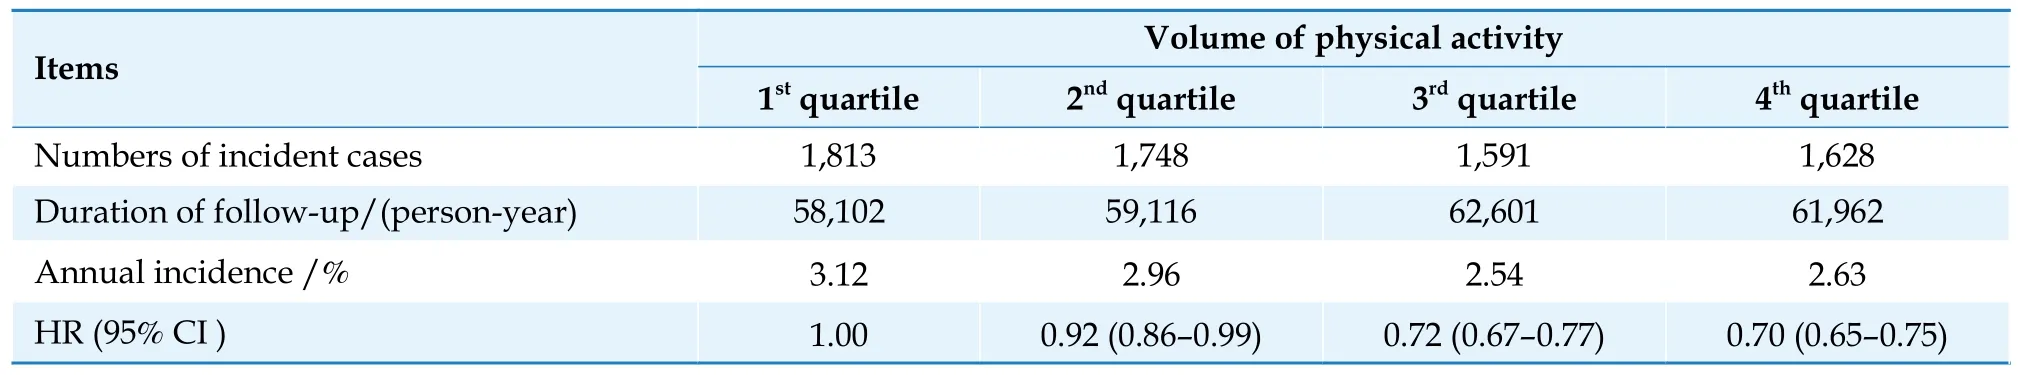
Table 3 Relationship between physical activity and incident hypertension in rural areas of China.
More than 12,000 participants (5986 men and 6525 women) without hypertension-related disease at baseline were followed up in CHNS during 1991-2015.[47]Results demonstrated that after adjustment of confounders and in comparison with the lowest quartile physical activity,the 3rdand 4thquartile physical activity were associated with a decline of SBP by 0.98 and 0.96 mmHg and a decline of DBP by 0.30 and 0.38 mmHg,respectively (allP< 0.05).In addition,the odds of hypertension were reduced by 12% and 15%.
A total of 9,350 adults free of hypertension at baseline were followed up in above cohort study from 1997 to 2015.[48]There was a L-shaped association between the occupational physical activity (OPA)and new-onset hypertension in males and a U-shaped association in females.Accordingly,when OPA was categorized as four groups (< 80,80-160,160-240,and ≥ 240 MET·h/week),in males,the risk of new-onset hypertension was significantly increased only among participants with OPA < 80 MET·h/week;however,in females,the lowest risk of new-onset hypertension was found among those with OPA 80-240 MET h/week.
A prospective cohort in Taiwan was started as a standard medical health screening programme in 1996 and selected 156,314 adults without DM at baseline.[49]Follow-up results during 2001-2016 indicated that compared with high physical activity(> 9.8 MET h),moderate (0.6-9.8 MET·h) and inactive/low physical activity (0.0-0.6 MET·h) were associated with a higher risk of DM (HR=1.31,95% CI: 1.22-1.41 and HR=1.56,95% CI: 1.46-1.68,respectively).
Data of 6,348 participants aged 35-74 years who were free of DM and CVD at baseline were selected from two cohorts: China Multi-center Collaborative Study of Cardiovascular Epidemiology (China MUCA)and China Cardiovascular Health Study.During 7.9 years of follow-up,higher physical activity level (PAL)was found to be associated with substantial reduction in risk of DM.In comparison with participants in the sedentary group (PAL: 1.00-1.39),the risk of DM decreased by 18%,37%,and 53% for those in the group of low active (PAL: 1.40-1.59),active (PAL:1.60-1.89),and very active (PAL > 1.89),respectively.[50]
A total of 44,828 Chinese adults aged 20-80 years with impaired fasting glucose (IFG) at baseline were recruited in the standard medical screening programme in Taiwan and were followed up from 1996 to 2014.[51]An inverse dose-response relationship was observed between LTPA and risk of DM(P< 0.001 for trend).Compared with inactive participants whose LTPA < 3.75 MET h/week,risk of DM in individuals with LTPA ≥ 15.0 MET ·h/ week was reduced by 25% (Table 4).
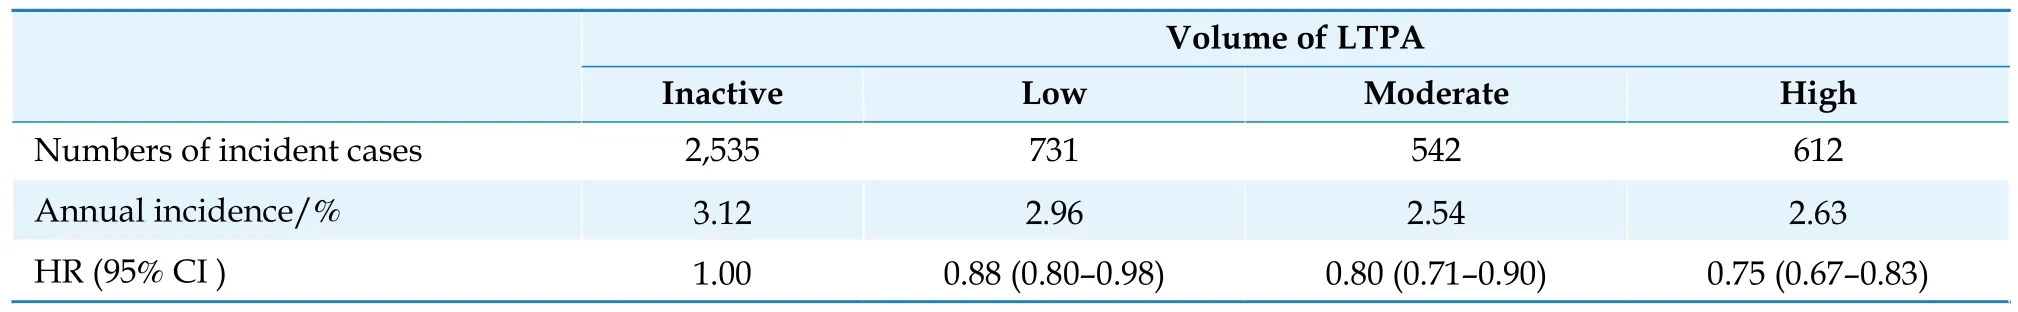
Table 4 Relationship between volume of LTPA and incident T2DM in residents with IFG in Taiwan.
Recruitment of CKB study began in 2004 and ended in 2008.Data of more than 466,000 participants residing in 10 geographically defined areas of China from CKB cohort at baseline showed that a 1-standard deviation (SD) greater physical activity(14 MET h/d) was associated with a 0.15 kg/m2lower BMI,a 0.58 cm smaller waist circumference (WC),and 0.48% less body fat.In contrast,a 1-SD greater sedentary leisure time (1.5 h/day) was associated with a 0.19 kg/m2higher BMI,a 0.57 cm larger WC,and 0.44% more body fat.Lack of physical activity and excess sedentary leisure time were jointly associated with greater adiposity (BMI ≥ 28 kg/m2).[52]A total of 104,170 urban commuters without major chronic diseases at baseline from the CKB study were followed up for a median of 10 years.After adjustment for confounders,walking (HR=0.90,95% CI:0.84-0.96) and cycling (HR=0.81,95% CI: 0.74-0.88)were associated with a lower risk of IHD than nonactive commuting.In addition,cycling was associated with a lower risk of ischemic stroke (HR=0.92,95% CI: 0.84-1.00).These findings suggested that people should be encouraged to adopt a more active mode of commuting,particularly by cycling,which would deliver cardiovascular benefits at the population level.[53]
A total of 100,560 participants without history of CVD from the Prediction for Atherosclerotic Cardiovascular Disease Risk in China (China-PAR) project were followed up for a median of 7.3 years.[54]Compared with participants who were inactive at baseline,the risk of developing CVD was reduced by 26% for those who met recommended MVPA level at baseline (HR=0.74,95% CI: 0.69-0.79).Furthermore,the risk of CVD incidence declined with increment of MVPA (P< 0.001 for trend).It was reduced by 38% for those who were highly active versus inactive category (HR=0.62,95% CI: 0.56-0.68).Compared with individuals who were inactive both at the baseline and follow-up,the risk of incident CVD was reduced by 43% for those keeping active over the period of follow-up (HR=0.57,95% CI: 0.43-0.77) (Table 5).
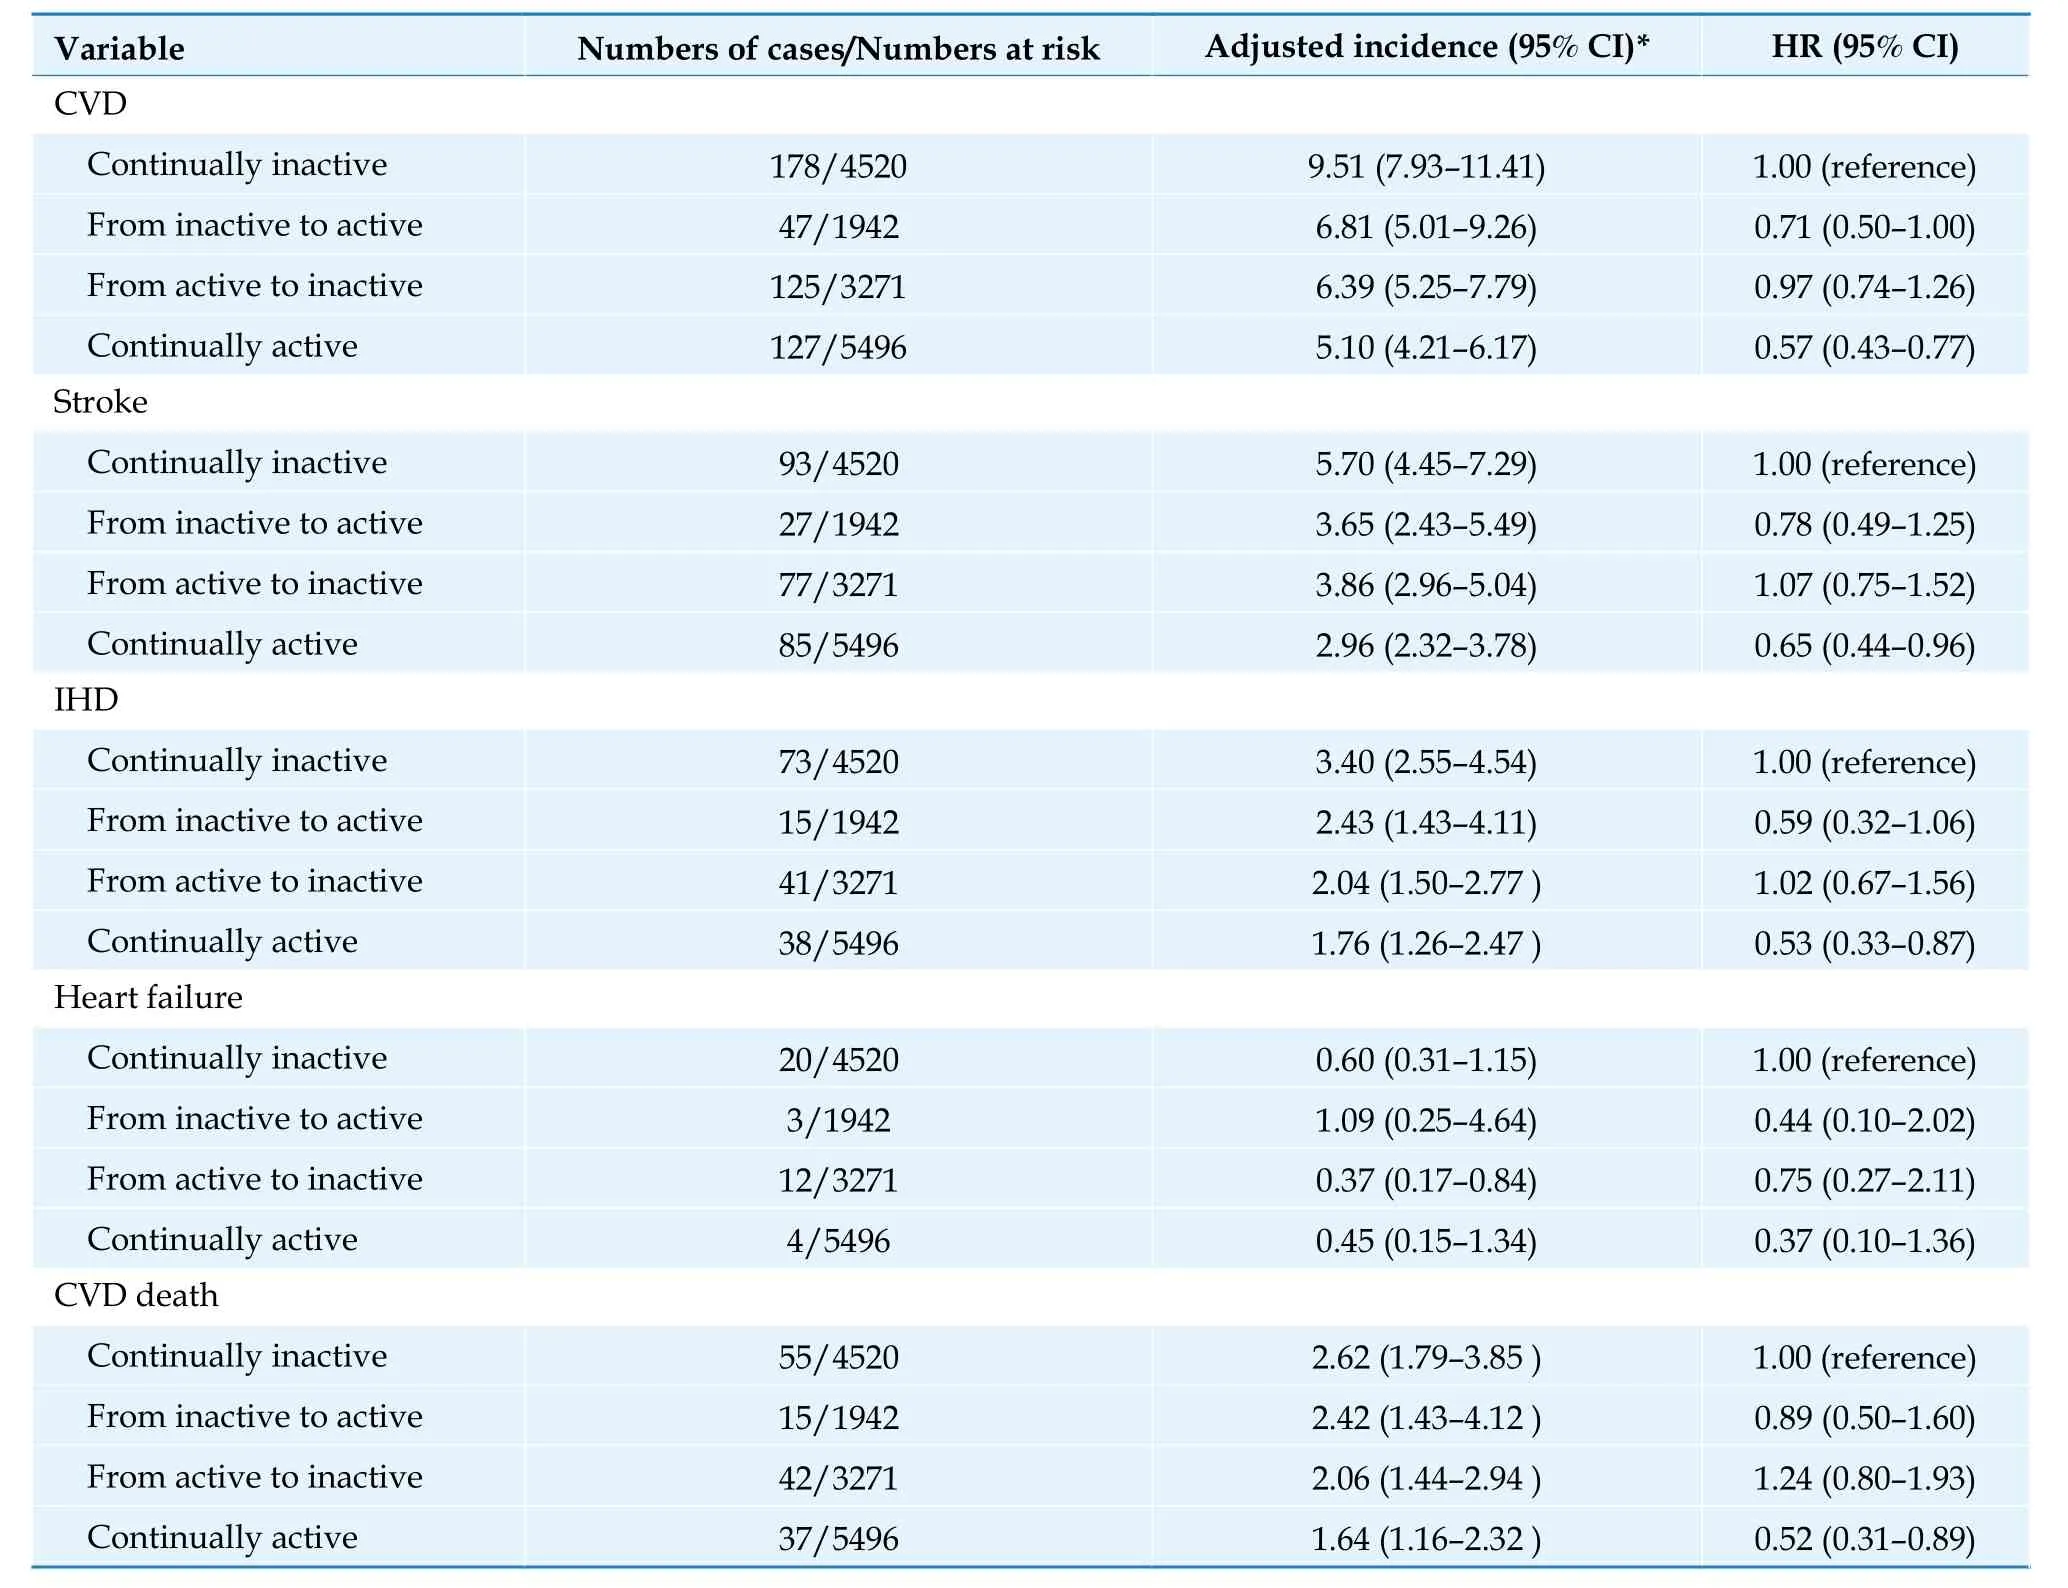
Table 5 CVD outcomes according to changes in MVPA levels from baseline to the 1st follow-up in China-PAR project.
A prospective study enrolled 26,584 retired employees without baseline disease in 2013 from the Dongfeng-Tongji (DFTJ) cohort that was established in 2008.The participants were followed up for a mean of 5 years.Compared with LTPA < 7.5 MET ·h/week,participating LTPA for 22.5-37.5 MET h/week was associated with a 18% lower CVD risk;however,no significant additional benefit was gained when LTPA > 37.5 MET h/week.[55]
A total of 12,107 pairs of same gender twins aged ≥30 years were enrolled by the Chinese National Twin Registry from 11 provincial administrative units in China.Analysis indicated that qualified physical activity (defined as engaging MVPA ≥ 30 min per day and ≥ 5 days per week) could reduce the genetic risk of T2DM.The heritability of T2DM in twin pairs with qualified physical activity was 32% lower than that in twin pairs without qualified physical activity (0.46vs.0.68).[56]
Physical activity and risk of CVD death
More than 487,000 Chinese residents without prior CVD from CKB study were followed up for an average of 7.5 years.[57]Higher total physical activity was associated with significantly lower risk of CVD death.The risk for the top (≥ 33.8 MET h/day)versus bottom (≤ 9.1 MET·h/day) quintile of baseline total physical activity was reduced by 41% for CVD death (HR=0.59,95% CI: 0.55-0.64).Each 4 MET h/day higher usual total physical activity was associated with a 12% lower risk of CVD death.The strength of the associations was similar and independent of each other for occupational and nonoccupational physical activity (Table 6).
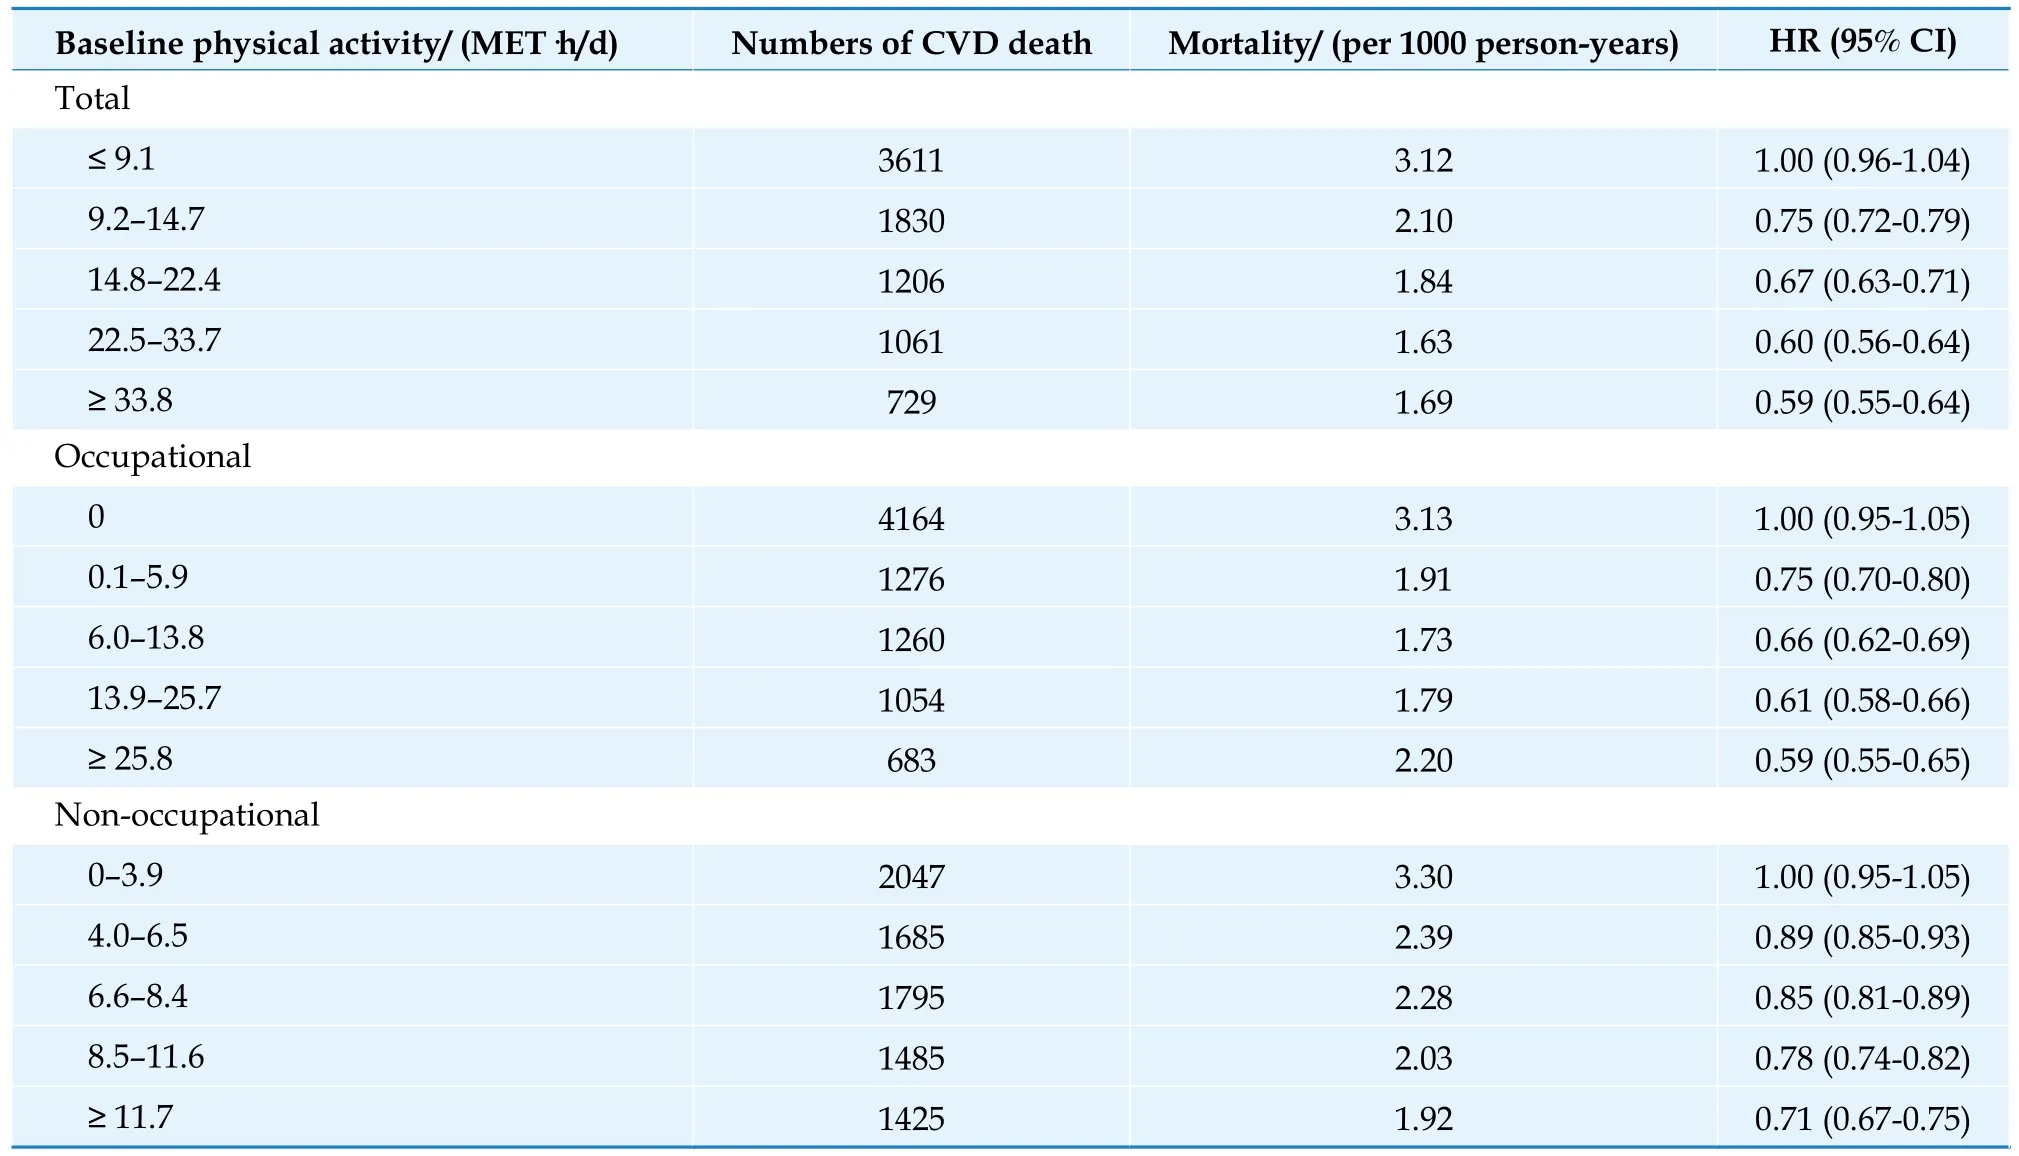
Table 6 Associations of total,occupational and non-occupational physical activity with CVD death.
More than 150,000 hypertensive participants at baseline from the CKB study were followed up for a median of 7.1 years.[58]Compared with the participants in the lowest quartile of total physical activity,the risk for IHD and cerebrovascular disease was decreased by 33% (HR=0.67,95% CI: 0.55-0.83) and 35% (HR=0.65,95% CI: 0.57-0.74),respectively,for those in the highest quartile group(Table 7).
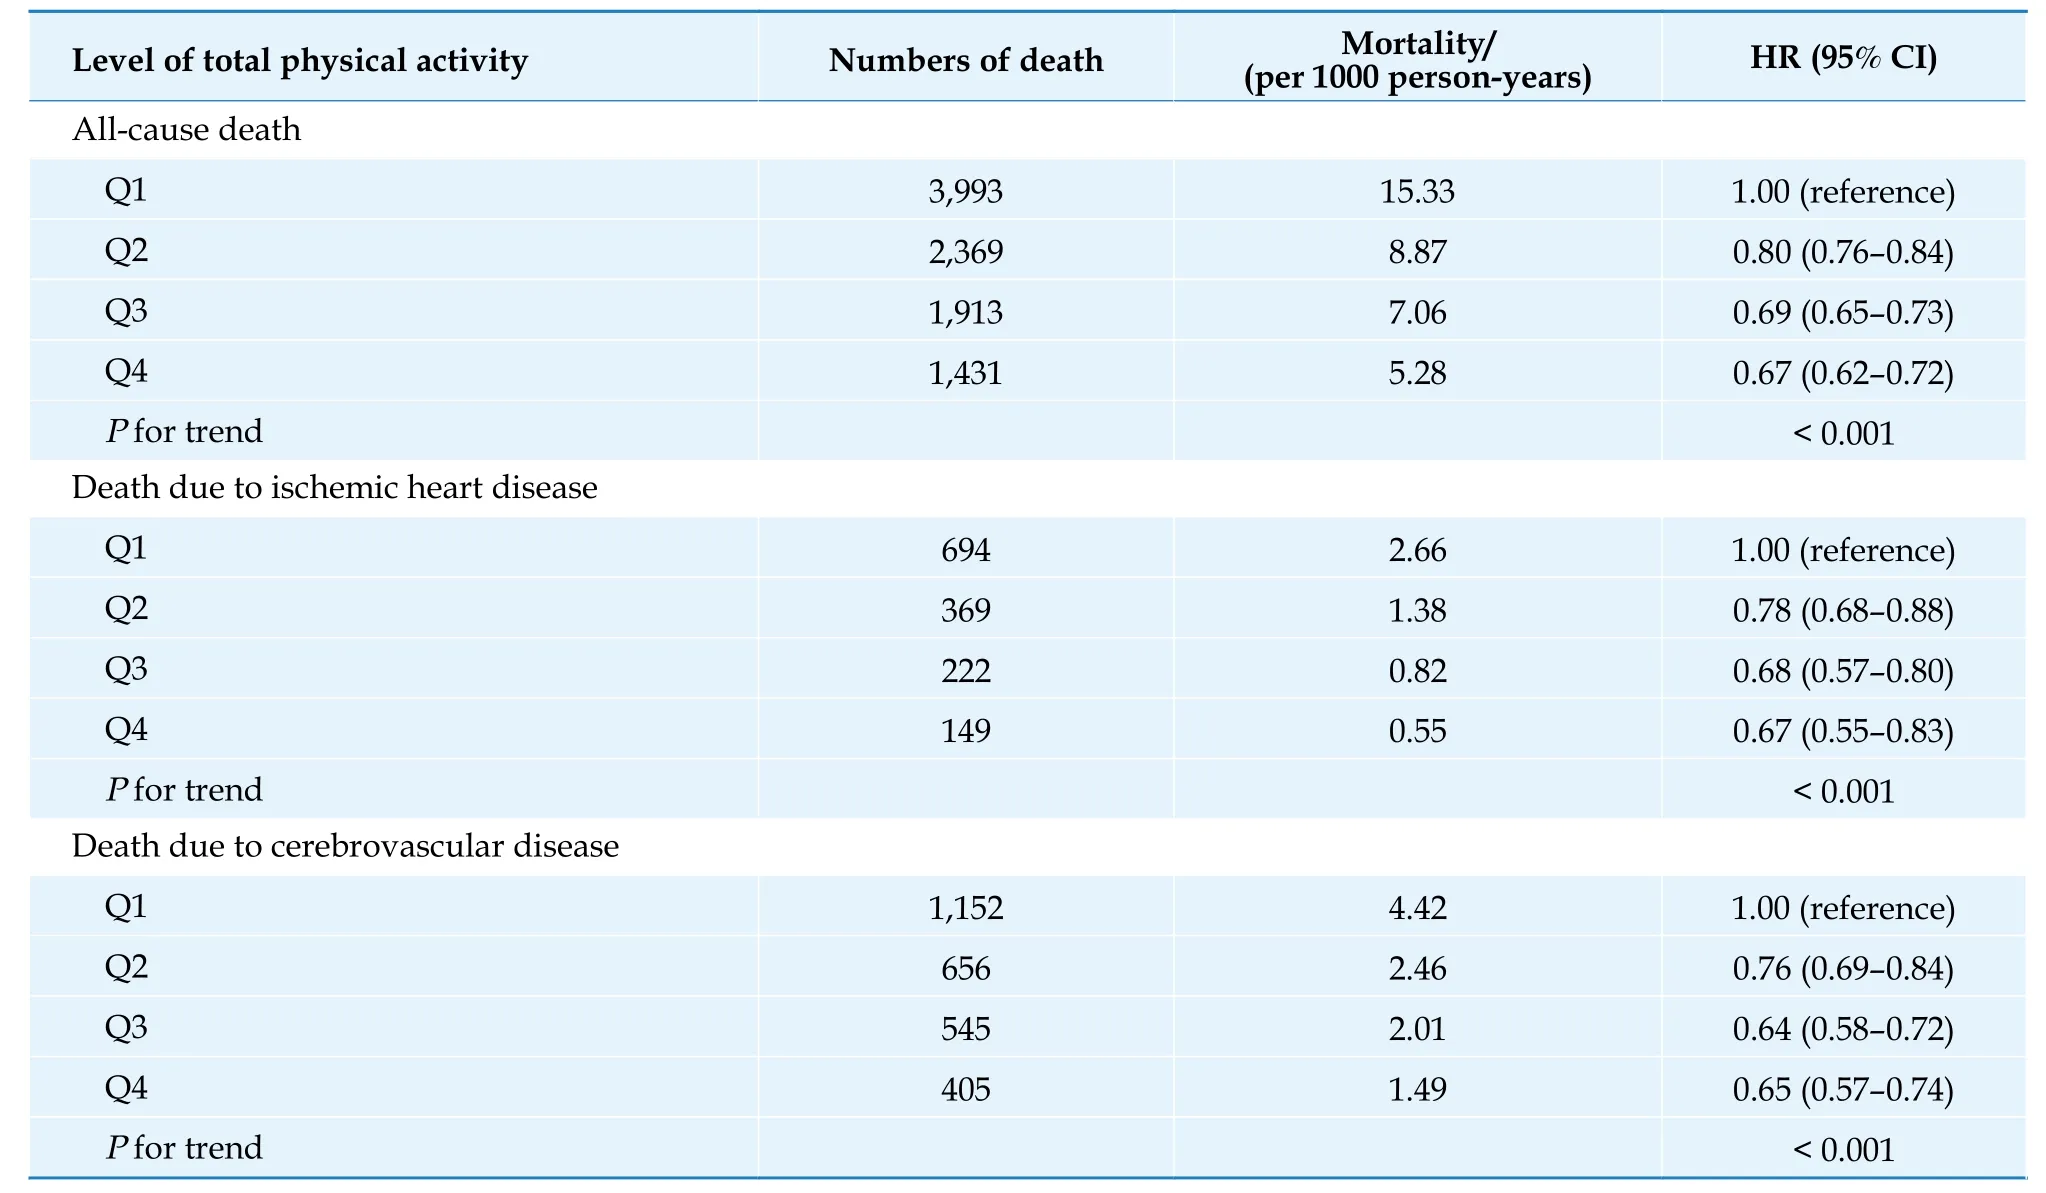
Table 7 Associations of total physical activity with all-cause and cardiovascular mortality among hypertensive patients.
Data of more than 120,000 eligible subjects aged 40-74 years from Shanghai Men’s Health Study and Shanghai Women’s Health Study were evaluated.The male and female participants were followed up for an average of 9.2 and 14.7 years,respectively.Compared with individuals who reported no exercise,a reduction of 25% in CVD mortality (HR=0.75,95% CI: 0.65-0.86) was observed in those who regularly engaged in moderate-intensity LTPA(such as tai chi,dancing and walking),even in those who reported an LTPA level lower than the minimum amount recommended by the current physical activity guidelines (7.5 MET h/week).The association between moderate-intensity LTPA and CVD mortality followed a dose-response pattern.[59]
A total of 18,104 middle-aged and older participants (61.21 ± 6.85 years old) in the Guangzhou Biobank Cohort Study were followed up for an average of 7.8 years.[60]Compared to participants who maintained moderate physical activity,those who decreased physical activity from moderate or high levels to a low level had a higher risk of all-cause mortality (HR=1.47,95% CI: 1.11-1.96).Participants who maintained a high level of physical activity (HR=0.83,95% CI: 0.70-0.98) or increased physical activity from low to high levels (HR=0.71,95% CI: 0.52-0.97) showed a lower risk of all-cause mortality.Those who maintained a low level of physical activity showed a higher risk of all-cause mortality.Similar results were found for CVD mortality (Figure 14).

Figure 14 CVD mortality. Adjusted HR for all-cause and CVD mortality by changes in physical ac-tivity from 2003-2008 (baseline) to 2012 (first repeated examination),and followed up for mortality until 2017 in 18,104 middle-aged and older participants.CVD: cardiovascular disease.
A descriptive study analyzed the data released by WHO in 2016 on physical activity prevalence(2001-2016) for 168 countries and focused on the individuals aged 40-74 years.The burden of premature mortality averted by physical activity in China was estimated to be 18.3%,conservatively equating to 1.0165 million deaths annually.[61]
Policies and Strategies to Promote Physical Activity Among Chinese Population
The “China Healthy Lifestyle for All ” action was launched in 2007,advocating “healthy action one,two,one”,which meant walking 10,000 steps a day,keeping diet and physical activity in balance,and leading a healthy life.“Physical Activity Guideline for Chinese Adults (pilot edition)” was released for the first time in 2010.“Physical Activity Guideline for Chinese Population (2021 edition)” was published in 2021 and updated the pilot edition.“Notification for Implementation of Broadcast Gymnastics” was sent out in 1951 for specific population and made broadcast gymnastics an important way to popularize national physical exercise.Primary and middle schools are explicitly required to have physical education and extracurricular activities and ensure that students have at least one hour of in-school sports every day.The “Health Promotion Action in Primary and Middle Schools” is an important component of “Healthy
At present,the national monitoring programs of physical activity are carried out regularly in the sectors of Sport,Education,and Public health.These programs mainly include China Physical Fitness Surveillance (CPFS),CNSSCH,CNHS,and China Chronic Disease and Risk Factor Surveillance (CCDRFS).CPFS started in 2000.It monitors exercise,physical activity,body shape,fitness and physical function.This program was conducted in 2000,2005,2010,2014 and 2020.Multiple editions of “Report on National Physical Fitness Surveillance” have been delivered.CNSSCH is conducted every 5 years.It monitors the physical education,exercise,body shape,fitness,physical function and other indicators in students.CNHS was started in 1959 and is conducted every 3 years.CCDRFS was started in 2004 and is conducted every 5 years.It focuses on the frequency and intensity of physical activity.Based on the data of national survey and surveillance,National Health Commission released the 2015-and 2020-edition of“Report on the Status of Nutrition and Chronic Diseases of Chinese Residents”,and provided further guidance for relevant research and practice.
Summary
Physical inactivity has become a significant risk factor for public health.The feature and trend of physical inactivity are quite common among Chinese residents.For children and adolescents,the prevalence of meeting physical activity recommendations is < 40%,and the daily screen viewing time is too much.The prevalence of regular LTPA among adult residents aged ≥ 18 years was only 12.5% in 2015,which was slightly higher than that in 2010.The lowest prevalence of regular LTPA was in the group aged 25-34 years.The sedentary leisure time among Chinese adults increased gradually in recent years,and was up to 3.2 hours per day in 2018.Evidence from large sample of study population in China is consistent with the conclusion of research abroad.Adequate physical activity is beneficial for the participants to reduce the risk of metabolic factors,incidence and mortality of CVD.Surveillance and policies are constantly reinforced by Chinese government on the promotion of physical activity in large population,which has become an important aspect of the “Healthy China Action”.
OVERWEIGHT AND OBESITY
Body weight is an important metric to evaluate nutritional status and physical condition.Too high and too low weight are both harmful to health.At present,the situation of underweight (or malnutrition) has been greatly improved among Chinese residents,but overweight and obesity are getting increasingly prominent.They have become a major risk factor for chronic disease outbreaks and impose tremendous burden on the healthcare system of China.
Epidemiological Characteristics of Overweight and Obesity
“Report on the Status of Nutrition and Chronic Diseases of Chinese Residents 2020” described the overall status of overweight and obesity among Chinese residents in 2018.In general,the prevalence rates of overweight and obesity among boys are significantly higher than those in girls.They are not significantly different between rural and urban areas for the dwellers aged 0-5 years and ≥ 18 years,but higher among the children aged 6-17 years in urban areas than those in rural areas.[17]“Report on the Surveillance of Nutrition and Health of Chinese Residents 2015-2017 ” reviewed 3 nationally representative data between 2002 and 2017,[62]and the CCDRFS program analyzed relevant data from six consecutive nationally representative health surveys between 2004 and 2018.[63]Both findings indicated that the prevalence rates of overweight and obesity among Chinese residents took on an increasing trend (Table 8,Figure 15,Figure 16).It is projected that,by 2030,the prevalence of overweight and obesity might reach 65.3% in adults (according to the Chinese sex-age-specific BMI cutoff points),31.8% in school-aged children and adolescents (according to the Chinese sex-age-specific BMI cutoff points),and 15.6% in preschool-aged children (according to the WHO standards),while the number of people with overweight and obesity might reach 789.95 million,58.92 million,and 18.19 million,respectively.[64]Obesity has not received much attention in China.In 2018,59.2% of Chinese residents aged ≥ 18 years measured their body weight in the past month (Figure 17).[17]
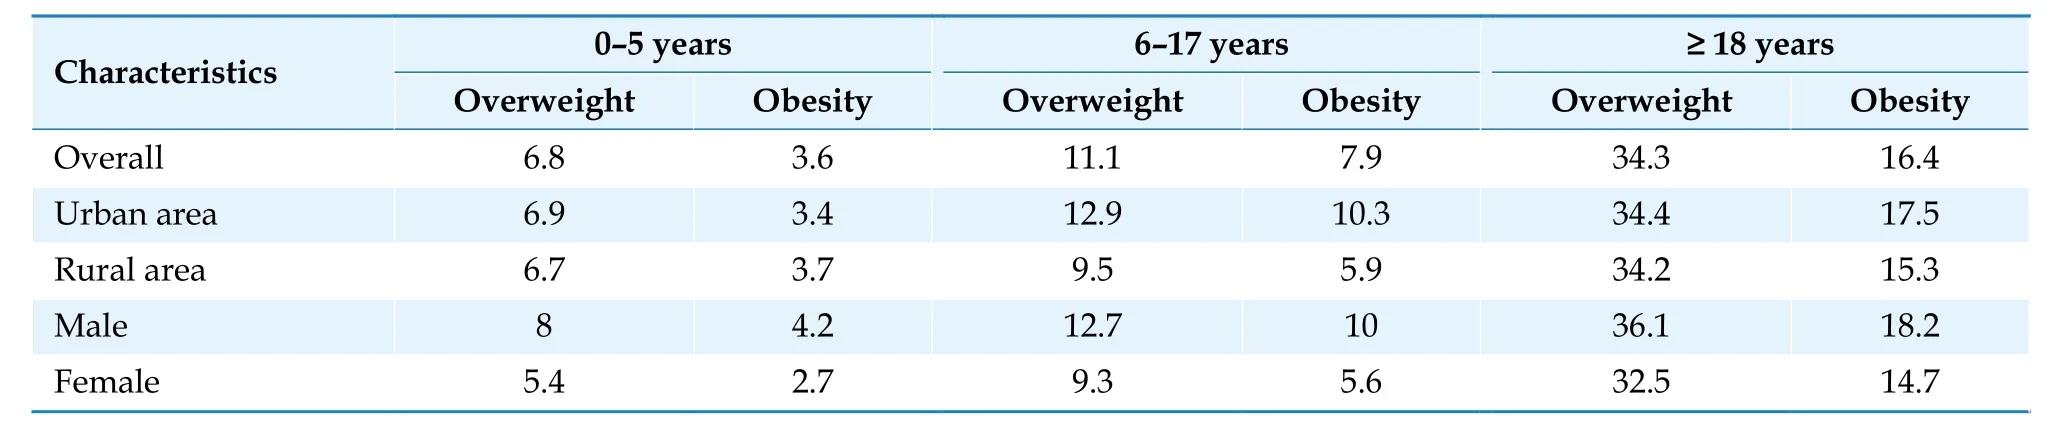
Table 8 Prevalence of overweight and obesity in different Chinese populations.

Figure 15 Trends in the prevalence of overweight and obesity among Chinese residents between 2002 and 2017. For better comparability,the same standard was used for the Surveillance of Nutrition and Health of Chinese Residents in 2002,2010-2013,and 2015-2017 to assess overweight and obesity,which were defined according to the “WHO growth standard in children”for children aged < 6 years,the “Screening for overweight and obesity among school-age children and adolescents (The health standard of China.WS/T 586-2018)” for adolescents aged 6-17 years,and the “Criteria of weight for adults (The health standard of China.WS/T 428-2013)” for adults aged ≥ 18 years.All the data are cited from the “Report on the Surveillance of Nutrition and Health of Chinese Residents 2015-2017 ”.
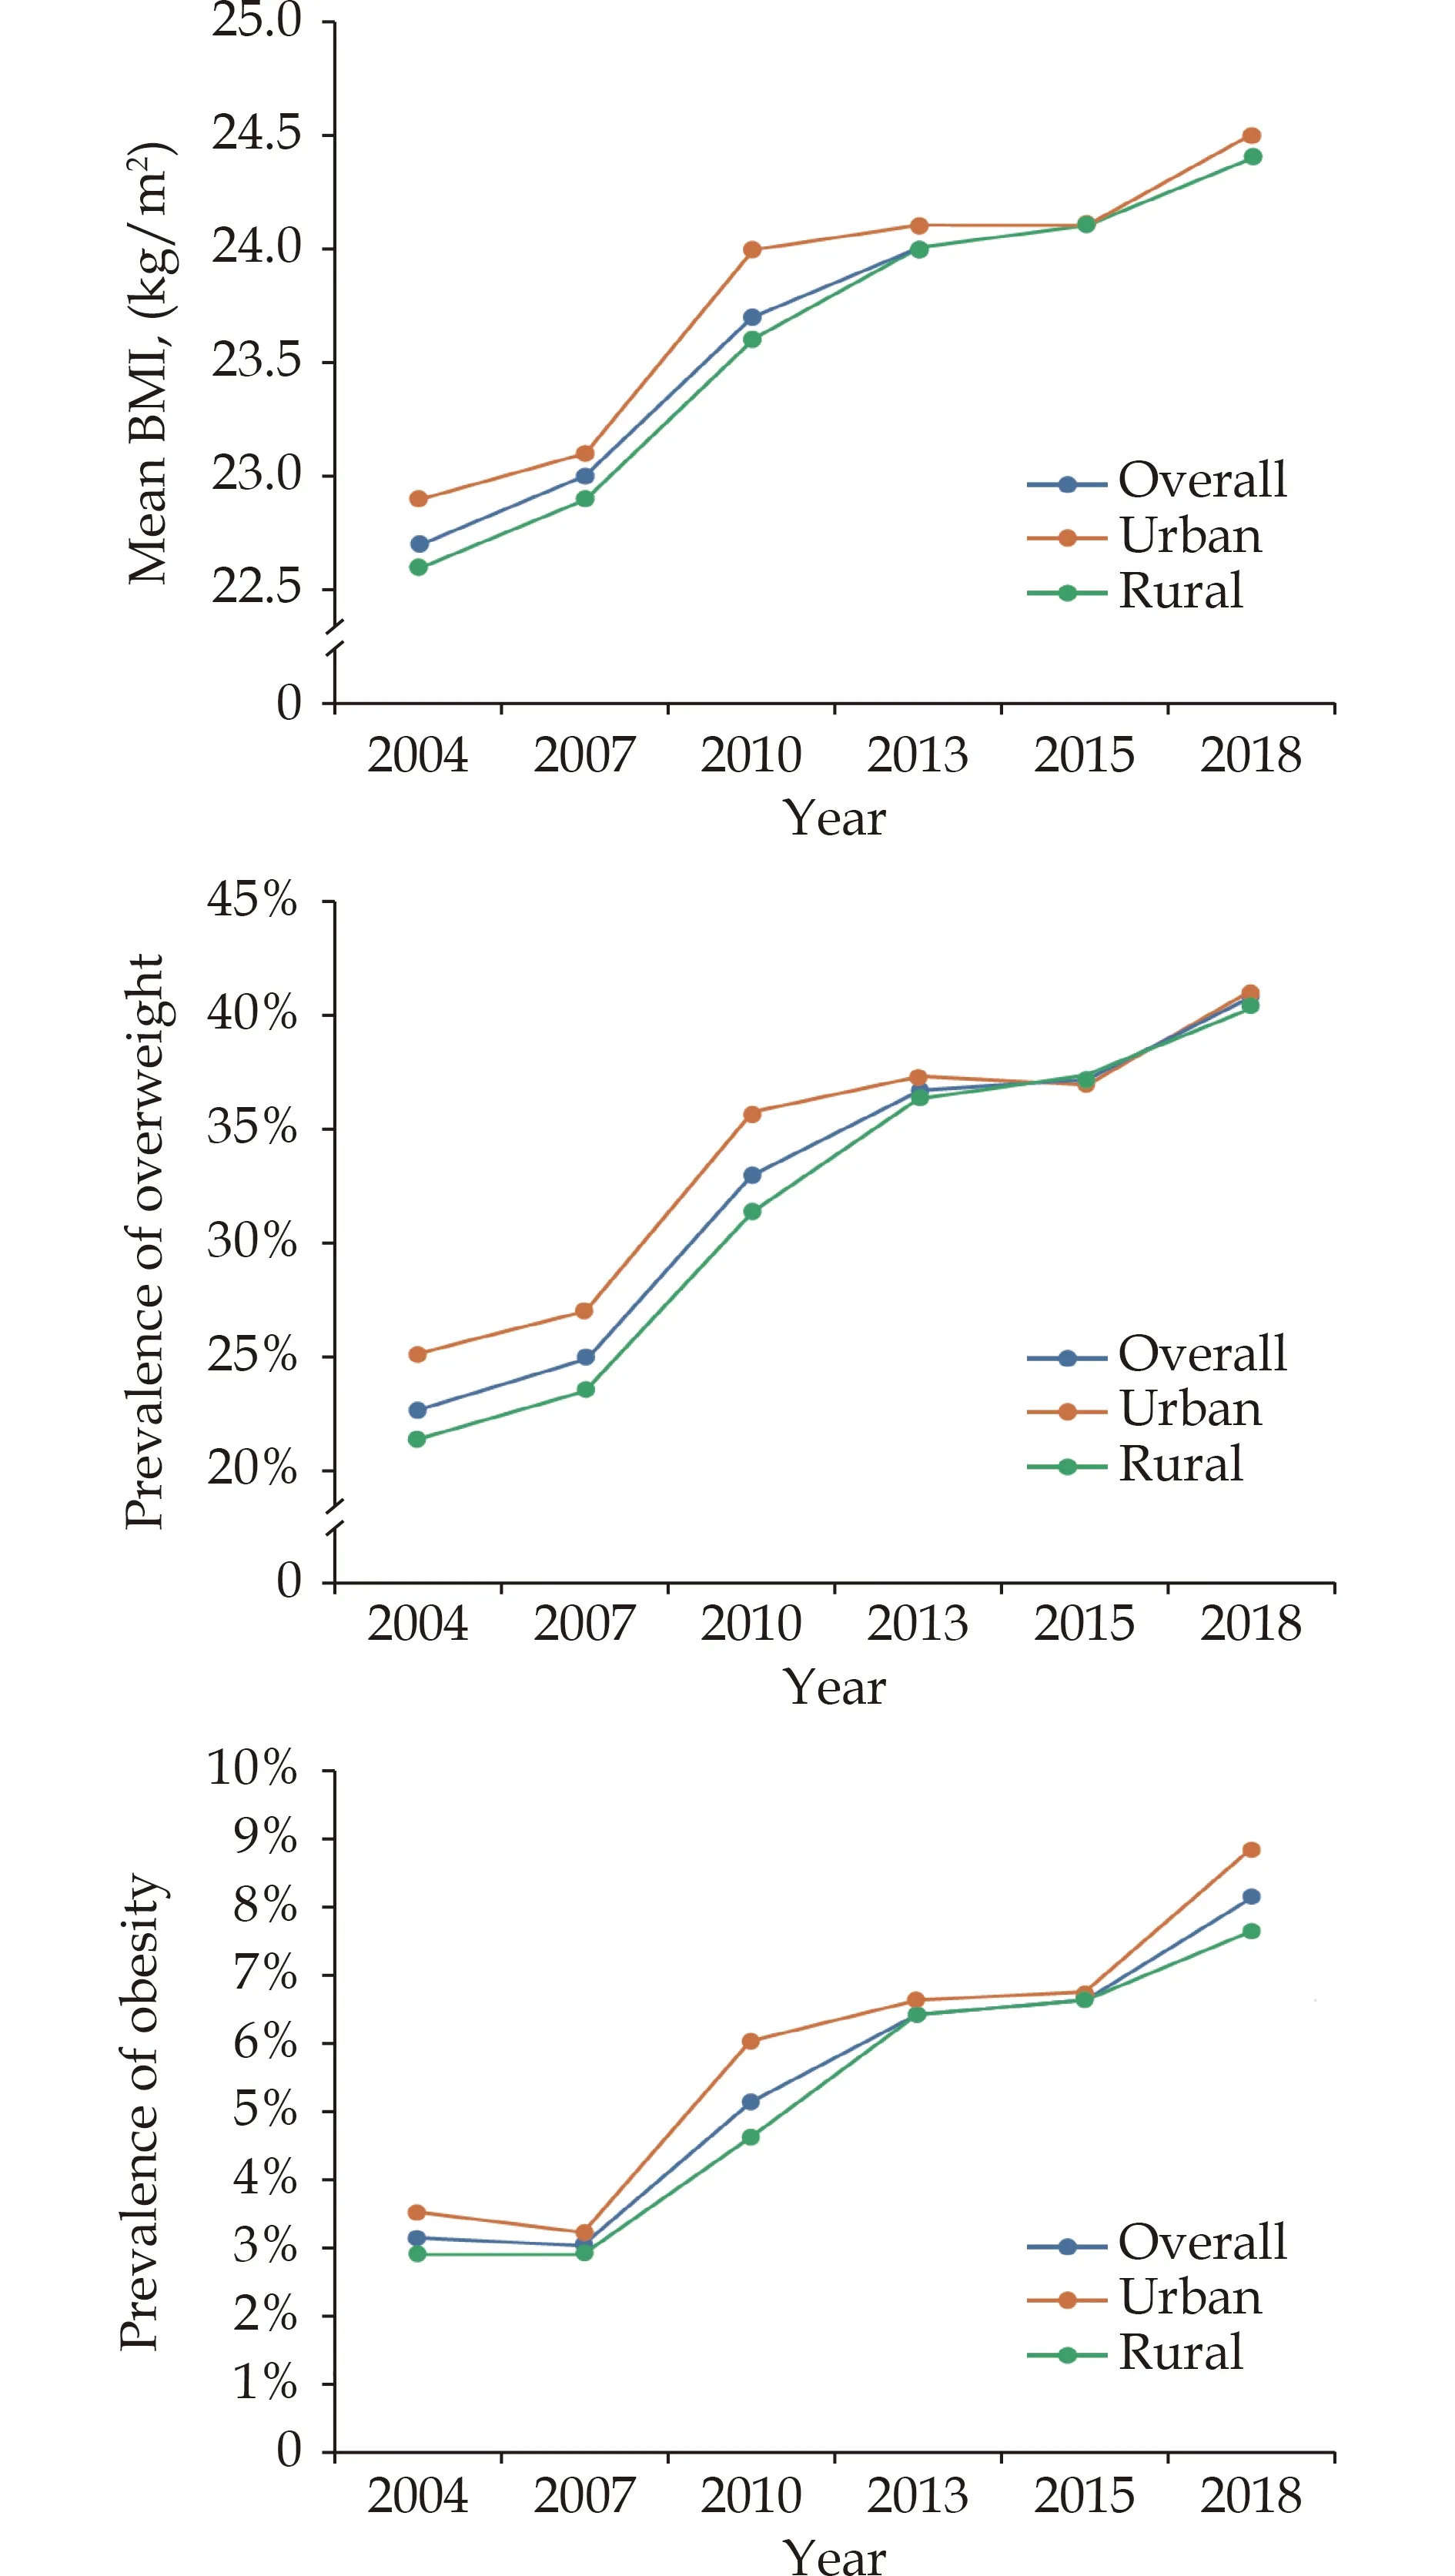
Figure 16 Standardized mean BMI,prevalence of overweight,and prevalence of obesity among Chinese residents aged 18-69 years from 2004 to 2018. Overweight and obesity were defined according to the WHO criteria.Data were cited from the CCDRFS program.BMI: body mass index.

Figure 17 Prevalence of body weight measurement in the past month among Chinese residents aged ≥ 18 years in 2018.
Association of Overweight and Obesity with Risk of Cardiovascular Diseases
It has been demonstrated in different studies that the risk of CVD will be increased by overweight and obesity,which are assessed with a variety of indicators,such as BMI,waist circumference (WC),body fat percentage,and visceral fat index.A total of 22,793 subjects aged ≥ 35 years were randomly selected in the Chinese hypertension survey (CHS)from 262 districts/counties across 31 provincial administrative units in China.During an average follow-up of 4.56 years (104,005.34 person-year),1109 participants had at least one cardiovascular event.After adjustment for age,education level,smoking,drinking and other risk factors,almost all obesity indicators were statistically associated with the increased risk of CVD.Their adjusted HRs and PAFs were listed in Table 9.In general,the PAF of WC is higher than other obesity indicators.[65]

Table 9 The HR and PAF of CVD for different obesity indicators.
Overweight and obesity increase the risk of hypertension.A total of 2,531 residents aged 35-74 years from urban communities and natural villages in Jiangsu were included in a prospective cohort study in 1999.They did not have hypertension at baseline and were followed up during 2002-2003 and 2006-2007 with a median interval of 3.8 years.By the end of follow-up,469 new hypertension were diagnosed.Compared to the participants with the lowest quartile value of BMI,WC,waist to hip ratio (WHR),and waist to height ratio (WHtR),those with the third and the highest quartile value of the four indicators had a significantly higher risk of hypertension and the HRs ranged from 1.46 to 2.62 (Table 10).BMI and WC had a combined effect on the incidence of hypertension.[66]

Table 10 Multivariate Cox proportional hazard regression analysis on the association of BMI,WC,WHR and WHtR with hypertension incidence.
Overweight and obesity increase the risk of ischemic stroke.A total of 26,907 adults from China Chronic Disease Surveillance Project in 2010 were selected for a follow-up study from 2016 to 2017.During the follow-up period,1128 ischemic stroke events were observed (491 in men and 637 in women).In men and in men with CVD risk factors,taking normal BMI/normal WC group as the reference,the risk of ischemic stroke increased in normal BMI/abdominal obesity group,overweight/abdominal obesity group,and obesity/abdominal obesity group.In women and women with CVD risk factors,taking normal BMI/normal WC group as the reference,the risk increased in overweight/abdominal obesity group and obesity/abdominal obesity group (Table 11).It was suggested that BMI and WC should be used jointly to evaluate obesity in population.[67]

Table 11 Association of body mass index and waist circumference with the risk of ischemic stroke.
Burden of Disease
Data from GBD study indicated that in 2019,the high BMI-attributable CVD deaths were 549,500 in China.The age-standardized CVD mortality due to high BMI was 38.64 per 100,000 population,and 11.98% of CVD deaths could be attributed to high BMI.[68]
Overweight and obesity increase the risk of CVD mortality among young and middle-aged population.In the Guangzhou Biobank Cohort Study,after excluding ever smokers and the individuals with poor health,19,405 participants aged ≥ 50 years were recruited during 2003-2008 and were followed up until 2017 for an average of 11.5 years.In those with BMI ≥ 22.5 kg/m2,an increase of 5 kg/m2was associated with 37% higher CVD mortality after adjustment for potential confounders.[69]A study analyzed the data of 48,377 women and 35,989 men aged 40-59 years from 2 prospective cohort studies (Shanghai Men’s Health Study and Shanghai Women’s Health Study) in China.Per 5kg weight gain from early to middle adulthood was associated with a greater than 20% (HR=1.26,95% CI: 1.16-1.38 for men;HR=1.23,95% CI: 1.14-1.33 for women) CVD mortality in later life among individuals who reached a BMI ≥ 23 kg/m2at middle adulthood.[70]Analysis was performed on the data of 27,026 community-dwellers aged ≥ 80 years from the Chinese Longitudinal Healthy Longevity Study(CLHLS) 1998 -2018 with 98,487 person-years of follow-up.Nonlinear curves showed reverse Jshaped associations of BMI with CVD,non-CVD and all-cause mortality,with a monotonic decreased risk up to BMI of approximately 26.5 kg/m2,30.6 kg/m2and 29.3 kg/m2,respectively,and flat hazard ratios thereafter.Compared to normal weight,overweight and obesity were significantly associated with decreased non-CVD and all-cause mortality.Underweight was associated with higher risk of CVD,non-CVD and all-cause mortality.[71]
Genetics and Family History
The genetic predisposition of obesity has been demonstrated in a variety of investigations.With the application and development of genome-wide association study,a lot of obesity-associated loci,including those in the genes ofFTO,GPR120,andCRTC3,have been identified.In addition,obesity has considerable genetic components,but the allele frequencies are more likely affected by race and sex.A total of 1,982 participants born in the year of 1960-1961 and 1963 were selected from CNHS that was conducted during 2010-2012.Single nucleotide polymorphism (SNP) was screened in 10 known obesity-associated genes.No gender difference was observed.Significantly higher frequencies for the risk allele ofrs11030104andrs6265were detected among ethnic participants than among Han participants (bothP< 0.001).[72]
Many studies indicated that the occurrence of obesity might be affected by appropriate environmental factors and could be attributable to the interaction between genes and lifestyle.A total of 2,216 subjects with a mean age of 49.7 years were included in a study based on the CNHS 2010-2012.Engaging in physical activity could reduce the effect ofMC4R rs12970134on BMI (β=-0.16 kg/m2,P=0.030) as well as the effect ofTRHRrs7832552andBCL2 rs12454712on WC.Sedentary behaviors increased the effects ofFTO rs9939609andFTO rs8050136on obesity and central obesity.A higher socioeconomic status aggravated the influence of SNP on BMI and WC as well as the influence ofSEC16B rs574367on central obesity.TheMC4R rs12970134association with BMI (β=0.140 kg/m2,P=0.049) and theFTO rs8050136association with central obesity (OR=1.77,P=0.004) appeared to be more pronounced with higher energy intake.[73]
Policies for Intervention
In order to reduce the rapidly increasing prevalence of overweight and obesity among residents,China has issued and implemented a couple of policies and actions.“Healthy China 2030” Plan was released by the Central Committee of the Communist Party of China and the State Council of the People’s Republic of China on October 25,2016.It proposed to advocate healthy diet and increase physical activity.The General Office of the State Council of the People’s Republic of China published “National Nutrition Plan (2017-2030)” [Document Numbers: (2017) Numbers 60] on June 30,2017 and set out the goals to prevent and control obesity among adults and students in “Healthy China Action (2019-2030)”.In 2017,the “China Healthy Lifestyle for All” action put forward a slogan “Three Reductions and Three Health Benefits(salt reduction,oil reduction,sugar reduction,healthy bones,healthy weight,and healthy oral cavity)” and gave priority to “healthy weight ”.
To ensure that each policy could be carried out effectively,“Implementation Plan for the Prevention and Control of Obesity among Children and Adolescents” was jointly released by the National Health Commission,the Ministry of Education,the State Administration for Market Regulation,the General Administration of Sport of China,the Central Committee of the Communist Youth League of China,and the All-China Women’s Federation in October 2020.The National Bureau of Disease Control and Prevention is an internal organization of National Health Commission of the People’s Republic of China.It invited experts to edit and publish the “Chinese Guidelines for the Prevention and Control of Obesity in Children 2021” and the“Chinese Guidelines for the Prevention and Control of Overweight and Obesity in Adults 2021”.[74,75]In addition,“Expert Consensus on Obesity Prevention and Treatment in China” was developed by the Chinese Nutrition Society Obesity Prevention and Control Section and other professional organizations.[76]
For the overweight and obese population,a panel of experts wrote the “Chinese Guidelines on Medical Nutritional Therapy for Overweight/Obesity 2021” on the invitation of the Nutrition and Metabolism Management Branch of China International Exchange and Promotive Association for Medical And Healthcare,Clinical Nutrition Branch of Chinese Nutrition Society,Chinese Diabetes Society of Chinese Medical Association,Chinese Society of Parenteral and Enteral Nutrition of Chinese Medical Association,and Chinese Doctor for Nutrition Association (CDNA) of Chinese Medical Doctor Association.Other experts wrote the “Consensus of Chinese Experts on Medical Nutrition Treatment for Overweight/Obesity 2016” on the invitation of the Nutrition and Metabolism Management Branch of China International Exchange and Promotive Association for Medical and Healthcare,CDNA of Chinese Medical Doctor Association,and Chinese Nutrition Society.These guidelines provided efficient,evidence-based,and practical weight-loss approach of medical nutrition for clinical dietitians.
Summary
The status of overweight and obesity is striking in China.The prevalence keeps growing among the residents living in urban or rural areas for all ages,and has become a major public health problem.However,this situation has not received enough attention in China.It is urgently needed for the whole society to act together and adopt effective measures to pay more attention to obesity,implement selfmonitoring,and take relevant actions.In addition,it is imperative to create a supportive and healthy environment of food and physical activity for prevention of obesity,therefore to reduce the risk and burden of diseases due to overweight and obesity.
PSYCHOLOGICAL FACTORS
Epidemiology
Mental disorders are increasing year by year in China.By the end of 2017,5.81 million Chinese adults had been registered as having severe mental disorders.[77]From 1990 to 2017,the all-age prevalence of depression per 100,000 population rose from 3,224.6 to 3,990.5,and the disability-adjusted life years (DALY) per 100,000 population rose from 525.1 to 607.4.According to a cross-sectional epidemiological study published in 2019,the weighted lifetime prevalence was 6.8% for depressive disorders,3.4% for major depressive disorder,and 7.6% for any anxiety disorder in China.[78]
The presence of anxiety or depression varies among individuals with different ages and genders.During 1990-2017,the prevalence of depression decreased in the Chinese population aged 5-54 years,but increased in those aged ≥ 55 years.A cross-sectional study that was published in 2022 recruited 9020 participants (2206 non-elderly adults aged 18-60 years and 6,814 elderly adults aged ≥ 60 years)from 105 communities of Shanghai.The prevalence of somatic symptom disorder (SSD) in the elderly was higher than that in the non-elderly (63.2%vs.45.3%).The elderly suffered more severe SSD (20.4%vs.12.0%) and were 1.560 times (95% CI: 1.399-1.739,P< 0.001) more likely to have the disorder than the non-elderly.The prevalence of SSD in patients with combined depressive and anxiety disorders was 3.7 times higher than would be expected in the general population.[79]According to the findings from the GBD study 2017,the prevalence of depression among females (5,039.6 per 100,000 population) was significantly higher than that among males (2,984.9 per 100,000 population).[80]
A web-based cross-sectional survey was conducted to assess the mental health burden of Chinese public during the outbreak of Coronavirus Disease 2019 (COVID-19).Data from 7,236 self-selected volunteers showed that the overall prevalence of generalized anxiety disorder and depressive symptoms were 35.1% and 20.1%,respectively.[81]A crosssectional survey was conducted among 435 patients with CVD through opportunistic and snowball sampling in Southeast China from October to November in 2020.The prevalence of anxiety and depression were 11.72% and 9.20%,respectively.[82]
The common mental disorders in patients with CVD include dysthymia,anxiety and/or depression,panic attack and delirium.They interact with each other as both cause and effect.According to the data of cardiovascular outpatients in tertiary general hospitals of 5 Chinese cities in 2014,the adjusted prevalence was 14.27% for depressive and/or anxiety disorder,16.91% for lifetime depressive and/or anxiety disorder,4.05% for depressive and anxiety disorder,and 5.37% for lifetime depressive and anxiety disorder.[83]
INTERHEART study was a case-control study and enrolled 3,030 patients with first acute myocardial infarction (AMI) and 3,056 age-and sex-matched controls without a history of CVD from 26 centers in China (including Hong Kong).The prevalence of depression was 21.66% among patients with AMI and 10.36% among controls.Although it was lower than that in 51 other countries,the associated risk of AMI was significantly higher in the Chinese residents (China: OR=2.27,95% CI: 1.95-2.65;other countries: OR=1.37,95% CI: 1.28-1.47;P< 0.001).In addition,the associated risk of AMI due to depression in China was higher in the North than in the South (2.70vs.1.09,P< 0.001).[84]A meta-analysis of 23 hospital-based studies found that among hospitalized patients with coronary artery disease(CAD) in China,the prevalence of depression was 51% (95% CI: 0.43-0.58) and that of severe depression was from 0.5% to 25.44%.[85]Among patients with CAD in community,the prevalence of depression ranged from 34.6% to 45.8% and that of the severe depression ranged from 3.1% to 11.2%.[86,87]Among 782 patients with acute coronary syndrome(ACS) in coronary care unit,122 (15.6%) were diagnosed with major depressive disorder (MDD) according to the Diagnostic and Statistical Manual of Mental Disorders,Fourth Edition (DSM-IV) criteria by interviewing with the Mini International Neuropsychiatric Interview (MINI).[88]“Guideline for Primary Care of Major Depressive Disorder (2021)” indicated that the prevalence of depression was about 15%-30% in the patients with ACS and 20% in those with CAD or congestive heart failure (CHF).[89]A total of 190 newly diagnosed CAD patients were followed up for 36 months.The incidence of anxiety and depression showed a rising trend with time.It increased from 42.6% at baseline to 51.1% at the 36thmonth for anxiety and from 33.3% to 43.7% for depression.[90]
A meta-analysis of 41 studies on the association between hypertension and depression indicated that the summarized prevalence of depression among hypertensive patients was 26.8%.It was statistically higher in China than in other regions (28.5%vs.22.1%,P< 0.001).[91]
Impact on Cardiovascular Diseases
Mental disorders or psychological problems,such as depression,persistent mental stress,and anxiety,increase the risk of cardiometabolic disorders,while positive emotions improve cardiovascular health.[92]
A total of 6,810 participants free of CVD were included in the China Health and Retirement Longitudinal Study (CHARLS) with assessment of depressive symptoms.Participants with persistent depressive symptoms had an elevated risk of CVD(RR=1.77,95% CI: 1.38-2.26) and mortality (RR=1.63,95% CI: 1.01-2.64) compared with those without any depressive symptoms.[93]CHARLS was conducted in 10,722 community-dwelling adults aged ≥ 45 years from 2011 to 2018.During 7 years of follow-up,1080 heart disease cases were identified.Central obesity and depressive symptoms were associated with a substantially increased risk of heart disease.Compared with people without central obesity and depressive symptoms,the multivariateadjusted HRs were 1.39 (95% CI: 1.18-1.64) for those who had central obesity alone,1.44 (95% CI: 1.18-1.77) for those who had depressive symptoms alone,and 1.88 (95% CI: 1.55-2.30) for those who had both central obesity and depressive symptoms.[94]A prospective cohort study in Southwest China was conducted among 7,735 adults aged ≥ 18 years from 2010 to 2020.It also found that depression was associated with a higher risk of incident CVD events.During an average follow-up of 7.07 years,215 CVD cases (including 28 AMI and 197 stroke cases)were identified.Patient Health Questionnaire-9 (PHQ-9)with a 9-question depression scale was used to screen the presence and severity of depressive symptoms.In the multivariate-adjusted model,baseline PHQ-9 score was associated with risk of incident CVD,AMI,and stroke.The HR per 1-SD increase of PHQ-9 score was 1.14 (95% CI: 1.03-1.26) for CVD,1.26 (95% CI: 1.01-1.57) for AMI,and 1.12 (95% CI:1.01-1.25) for stroke.Compared with participants without depression,those with any mild or more advanced depression had a higher risk of incident CVD (HR=1.69,95% CI: 1.08-2.64) and AMI (HR=3.36,95% CI: 1.17-10.56).[95]
According to the data of 486,541 Chinese adults aged 30-79 years in the final analysis of CKB study,the overall prevalence of major depression was 0.61%.Over a median follow-up of 7.2 years,higher incidence of IHD was observed in participants with major depression compared with those without (HR=1.32,95% CI: 1.15-1.53).This association was even more significant in the urban residents (HR=1.72,95% CI: 1.39-2.14).[96]
Analysis of data from 2 prospective cohort studies,CKB and DFTJ,indicated that depression was associated with an increased risk of all-cause and CVD mortality (Table 12),particularly in men.[97]

Table 12 Association of depression with all-cause and CVD mortality in CKB and DFTJ study.
A longitudinal study to investigate anxiety and depression in CAD patients indicated that baseline/1-year depression,but not anxiety,were correlated with increased cumulative major adverse cardiovascular events (MACE) occurrence.[90]A single-center prospective study showed that peri-procedure anxiety was associated with the prognosis in CAD patients who underwent elective percutaneous coronary intervention (PCI).Anxiety in one day after procedure was an independent risk factor for the angina frequency at 6 months after PCI (P=0.005).[98]Another study also found that among CAD patients who underwent PCI,both anxiety (HR=3.181;P<0.01) and depression (HR=5.434;P< 0.01) were associated with a higher risk of developing MACE.They were independent predictors of cumulative MACE (P< 0.01).The risk of MACE in patients with comorbidity of anxiety and depression was significantly higher than that in those without (HR=4.642;P< 0.01).[99]A total of 647 patients with ACS were recruited in a prospective longitudinal study and were followed up for 12 months.Baseline comorbidity of anxiety and depression strongly predicted poor quality of life (OR=1.77,95% CI: 1.22 -2.52;P=0.003).Regarding non-fatal myocardial infarction (MI) and cardiac re-hospital-ization,baseline anxiety (OR=2.83,95% CI:1.33-5.89,P< 0.01;OR=4.47,95% CI: 1.50-13.00,P< 0.01),major depression (OR=2.58,95% CI:1.02-6.15,P< 0.05;OR=5.22,95% CI: 1.42-17.57,P< 0.03),and comorbidity (OR=6.33,95% CI: 2.96-13.79,P< 0.0001,OR=14.08,95% CI: 4.99-41.66,P< 0.0001) were all independent predictors.[100]A prospective cohort study was conducted in 633 patients who had MI with non-obstructive coronary arteries (MINOCA) and followed them up for 3 years.The new diagnosis of depression was identified as an independent prognostic factor for allcause mortality (adjusted HR=7.250,95% CI: 4.735-11.100;P< 0.001) and cardiovascular events (HR=3.411,95% CI: 2.490-4.674;P< 0.001).[101]
Expert Consensus on Psycho-cardiology in China
The impact of mental disorders on CVD gets increasing attention.Since 2016,Chinese experts have written and published a series of consensus on the comorbidity of CVD and mental disorders,which provide helpful reference and guidance for the diagnosis and treatment of CVD patients with mental disorders by cardiologists in clinical practice (Table 13).
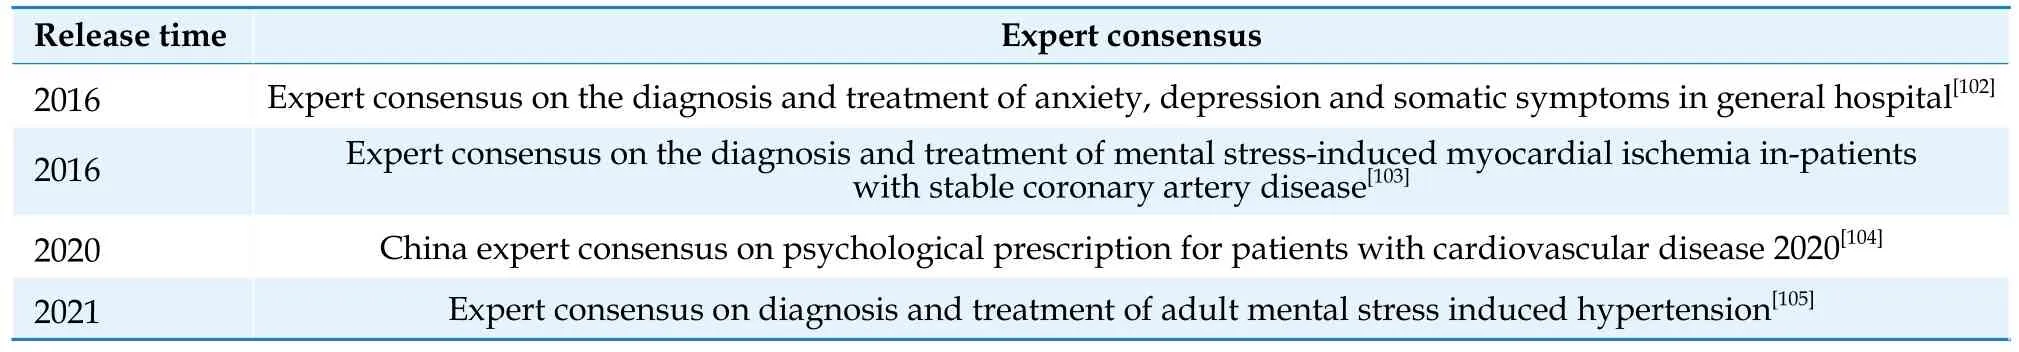
Table 13 Expert Consensus on psycho-cardiology released during 2016-2021 in China.
Summary
This chapter discussed mental health in terms of its epidemiology,impact on CVD,and expert consensus on psycho-cardiology in China.Mental disorders and psychological problems are increasing year by year in China,especially among the elderly and women.The incidence of mental disorders is higher in patients with CVD.Meanwhile,depression,persistent mental stress,anxiety and other psychological problems,increase the risk of cardiometabolic disorders and MACE.Therefore,great attention should be paid to the diagnosis and treatment of the comorbidity of CVD and mental disorders.At present,we are still short of large-scale epidemiological data on the mental health,and much more researches are urgently needed.
 Journal of Geriatric Cardiology2024年1期
- Journal of Geriatric Cardiology的其它文章
- Development and validation of a model integrating clinical and coronary lesion-based functional assessment for longterm risk prediction in PCI patients
- Interaction between systemic iron parameters and left ventricular structure and function in the preserved ejection fraction population: a two-sample bidirectional Mendelian randomization study
- Role of intravascular ultrasound and optical coherence tomography in intracoronary imaging for coronary artery disease:a systematic review