
Degradation Diagnostics from the Subsurface of Lithium-Ion Battery Electrodes
2022-07-04 09:12XuhuiYaoTomSamorilJiDluhoJohnWattsZhijiaDuBohangSongRaviSilvaTanSuiandYunlongZhao
Energy & Environmental Materials 2022年2期
Xuhui Yao, Tom′aˇs ˇSamoˇril , Jiˇr′? Dluhoˇs , John F. Watts , Zhijia Du, Bohang Song,S. Ravi P. Silva , Tan Sui* , and Yunlong Zhao*
1. Introduction
Modern society has witnessed the rapid development of emerging technologies,such as electric vehicles, advanced robotics, and implantable devices. With an increase in population that demands modern conveniences, an increase in the highly integrated device and equipment is expected. Therefore, the requirements for reliable and highperformance energy supplies become imperative.[1–4]As one of the most promising candidates, lithium-ion batteries (LIBs) have received much attention from the very outset.[5–7]The conventional collocation of layered ternary transition-metal oxide cathode with graphite anode enables highly competitive output voltage, large capacity, and energy density, thus ushering an era of high-performance LIBs.[8–11]Nevertheless,commercialized LIBs based on the established collocation have a limited lifespan due to the inevitable capacity fade. One of the significant reasons for capacity fade is the degradation of electrodes associated with the deactivation of active materials and the irreversible parasitic reaction.[12–14]Therefore,tracking the deactivation and parasitic reaction is always a research hot spot, and investigating the degradation mechanism is the foundation on which improving the durability of LIBs can be enabled.[15–19]Li et al.[19]summarized the diagnostic methodologies including physical,chemical, and electrochemical techniques that significantly facilitate the investigation of degradation mechanisms. Generally, due to the direct correlation with degradation products, the chemical survey targeting solid electrolyte interphase (SEI), cathode electrolyte interphase (CEI), and active ingredient has been considered as the key to reflecting the components and distributions of degradation products.[20–22]
In order to achieve the chemical survey, mass spectrometry technologies have stepped into the spotlight.[16,23–30]Mass spectrometry is one of the widely accepted techniques to detect light elements including lithium.Among the commonly used mass spectrometry techniques,the secondary-ion mass spectrometry (SIMS) technique can preserve the spatial information of samples due to the direct ionization processes to generate analyte ions,while other techniques need two steps in time or space to evaporate (atomize) and ionize separately.[31]For instance,the gas chromatography-mass spectrometry and the inductively coupled plasma mass spectrometry (ICP-MS) require the full dissolution of the samples before ionization.[32]Particularly, glow discharge-mass spectrometry (GD-MS) has the ability to analyze solid surface directly with good depth resolution, but only poor lateral resolution can be obtained. Even the laser ablation (LA)-ICP-MS technique can provide better lateral resolution compared with GD-MS,its resolution is still at least several times lower than SIMS owing to the very small diameter of the primary ion beam in SIMS analysis.[33]In addition, the mechanism of SIMS characterization is through counting the ionized fragments from the sample surface,which determines the mass resolution at ppm-level.[34]However,only the ions with specific mass can be acquired by secondary-ion mass analyzers at one time, which strictly limits the visual field and correlated species in SIMS. To breakthrough this bottleneck,time-of-flight (ToF)-SIMS has been introduced based on the ToF spectrometer, featuring the simultaneous recording for all the secondary ions.[35]Manthiram and co-workers investigated the CEI evolution using ToF-SIMS technology, demonstrating the substantial repercussion of interphases on electrochemical properties.[36]They also reported the formation mechanism of lithium metal on the surface of graphite anode based on direct and quantitative ToFSIMS analysis. Their results show that the formation of lithium metal is highly correlated with the migrated transition-metal ions from the cathode.[37]However, due to the intrinsic thermodynamic instability and air sensitivity of electrodes, the chemical survey along the depth of electrodes rather than on the external surface could reflect more credible and adequate results.[38–40]Unlike the focused ion beam (FIB) milling progress, the sputtering yield in ToF-SIMS characterization is commonly layer by layer at the atomic scale to realize high resolution, which means the depth profile of the chemical survey is generally available at the nanoscale. To extend the depth profile to the micron scale, the FIB with scanning electron microscopy (FIB-SEM) technique provides more versatility on sample preparation. A specific cross-section of the sample can be obtained by FIB milling process and then be transferred to the chamber of ToF-SIMS equipment. Thus, the underlying chemical information is achievable by the ToF-SIMS.[41,42]To get more reliable results, avoiding air exposure has been the most significant factor that should be taken into account in the characterization process. In our previous work, we demonstrated a ToFSIMS attached Gallium ion (Ga+) source-based FIB-SEM setup, possessing the capability of simultaneous characterization of the crosssectional morphology and the corresponding chemical composition.[43]To reduce the invasiveness to the sample during the milling process and improve the signal sensitivity and intensity during the chemical survey, the emerging Xenon ion (Xe+) plasma is introduced as the ion source used in this work. According to the stopping and range of ions in matter profile of the five most common used FIB (Figure S1a), the heavier the primary ion mass is, the closer to the surface it is stopped, resulting in a smaller damaged zone under the target area. In addition, compared with Ga+, the 30 keV Xe+performs lower penetration in depth, less longitudinal straggling, and higher secondary ion yield rate for lithium target. This leads to a significant improvement in the sensitivity and intensity of chemical mappings, especially for light elements, such as lithium. This has been proved by both experimental observations (Figure S1b) and theoretical simulations(Figure S1c) from our recently published paper.[44]
In this study, commercial lithium nickel manganese cobalt oxide(NMC532, LiNi0.5Mn0.3Co0.2O2)/graphite, conductive carbon black,and polyvinylidene fluoride (PVDF) with a mass ratio of 90:5:5 were adopted for the cathode/anode electrodes preparation (See details of battery assembly and cycling performance in the Experimental Section and Figure S2). Electrode materials with a depth of more than 50 μm were sputtered away from the top by a Xe+plasma FIB (PFIB)milling technique(Figure 1a).The cross-sectional morphology of electrode materials was observed by SEM. After the milling, Xe+plasma was applied again to bombard the cross-sectional surface for 8 min to ionize sufficient secondary ions (Figure 1b). Simultaneously, the mass spectra were obtained when the secondary ions were extracted and passed through the ToF-SIMS analyzer. Each peak in mass spectra is indexed to a specific species according to the isotope and specific mass(Figure 1c).The chemical mappings of specific ion or groups from the detection region (e.g., Li+mapping shown in Figure 1d) are created by integrating the tomographic frames. Through the chemical surveys for both NMC cathode and graphite anode electrodes,every trace of the degradation product is found. This solid chemical evidence could promote the diagnosis and understanding of battery degradation,thus paving the way for better design of LIBs to remove the capacity fade.
2. Results and Discussion
2.1. Comparison of ToF-SIMS Mass Spectra Before and After Cycling
To track and identify the chemical components, the ToF-SIMS mass spectra obtained from cross-sectional interfaces were indexed (Figure 2). The mass spectra were collected at the cathode and anode electrodes interfaces in pristine (without contact with electrolyte) and after 1000 cycles (under C/3 rate). The negative mode (Figure 2a,b) mainly reflects the concentrations and coordination states of oxygen and fluorine negative ions, while the positive mode (Figure 2c,d) has higher sensitivity to lithium and transition metal positive ions.[45]
In the negative mode (Figure 2a), a very weak O- bump (16 a.m.u., black trace) is observed from the detection area of the pristine anode, which is originated from the metal oxides impurity in natural graphite.[46]After cycling, emerging carbon/oxygen-based fragments such as C2O-and C2HO-(40 and 41 a.m.u., orange trace) appear, which represent a diversity of organic deposition products from the decomposition of penetrating electrolyte solvent.Same peaks of CO2-and CHO2-(in red traces) are also observed from the cycled cathode, while the other peaks of oxygen in the cathode side mainly come from the NMC. Figure 2b shows the representative negative fluorine-based fragments. The F-and C2Ffragments (19 and 43 a.m.u., black trace) at the pristine anode interface originate from the PVDF binder. After cycling, an emerging7LiF2-fragment (in the orange trace) appears at the interface.Combining with the appearance of a series of emerging fluoriderelated fragments in positive mode (6Li7LiF+,7Li2F+,6Li27LiF2+,6Li7Li2F2+, and7Li3F2+: 32, 33, 57, 58, and 59 a.m.u., orange traces) at the cycled graphite interface in Figure 2c,d, we can conclude that the lithium fluoride generates on the cycled graphite anode side after the electrochemical operation. Interestingly, on the cathode side, lithium fluoride fragments appear at both pristine and cycled samples (blue and red traces). Considering that there is no contact with the electrolyte and no electrochemical operation for the pristine cathode, the only origin for the ingredients of lithium fluoride is from the NMC and PVDF, which contain lithium and fluorine elements, respectively. The generation of irreversible lithium fluoride can cause loss of lithium inventory and capacity fade. Furthermore, the most promising opportunity for this degradation occurrence could be during electrode preparation, and the further analysis and systematic investigation of the degradation mechanism are described in the following section.

Figure 1. Integrated Xenon ion plasma FIB milling and ToF-SIMS technique. a) The schematic diagram of the first step Xe+ PFIB milling for the cycled NMC electrode, and the SEM image of the cross-sectional interface (inset, blue box, scale bar: 40 μm). (Gray layer: external surface with SEI, Yellow layer: subsurface underneath the external SEI.)b) The schematic diagram of the integrated ToF-SIMS characterization for the selected area (red box) on the crosssectional interface of cycled NMC cathode, and the SEM image of the selected area (inset, red box, scale bar:10 μm). c) The mass spectrum survey obtained by ToF-SIMS characterization, and the index illustration of secondary ions. d) The lithium chemical mapping of the above detected area on the cross-sectional interface of cycled NMC electrode (integrated from 100 tomographic frames, equivalent to a total lengthways depth of 30 nm from the cross-sectional interface).
In the positive mode (Figure 2c), there is no lithium signal (in the black trace) at the pristine graphite anode, while after cycling,emerging6Li+,7Li+fragments (6, 7 a.m.u., orange trace) appear,corresponding to the deposited lithium-containing degradation compounds. The relatively weak6Li7LiO+,7Li2O+, and7Li2OH+fragments (29, 30, and 31 a.m.u., orange trace) represent the lithium oxides and/or alkoxides deposition at the cycled anode interface.On the cathode side, the high-dense intensities of6Li+,7Li+fragments (blue and red traces) are observed whether or not it is cycled, which is attributed to the main component of NMC. For the analysis regarding transition-metal fragments (Figure 2d), the influence of soluble transition metal on the SEI composition has always been a research hotspot since first confirmed experimentally in 2012.[47]The soluble transition metal could migrate to the anode side driven by the concentration gradient and/or electric field and then deposit (reduction reaction) on the surface of anode.[13]These deposited compounds could accelerate the irreversible decomposition of the electrolyte due to their electrocatalysis properties, which leads to a decrease in columbic efficiency and an increase in anode impedance. However, all these studies were based on the characterization for the surface of anode electrode, and the evidence from the subsurface has not been studied yet.From our results, no significant transition-metal fragments are observed from the detection region of the pristine or cycled anode subsurface, indicating that no transition-metal products could deposit or accumulate inside the anode. This result has guiding significance for the regeneration of the battery electrode, especially for the graphite anode.[37]The observable transition-metal signals of Mn+,58Ni+,Co+, and60Ni+fragments (55, 58,59, and 60 a.m.u., blue and red traces) are observed at the cathode interface, which is also attributed to the dominated component of NMC. In addition, the comparison of SEM images obtained on the cross-sectional interface of both pristine and cycled cathode shows that many micro cracks initiate from inside of the NMC particles after cycling (Figure S3). The cracking can lead to poor connections between particles in the electrode and new surfaces exposed to the electrolyte, which could result in parasitic side reactions and further accelerates the degradation of electrodes.
2.2. Degradation During the Cathode Electrode Preparation
To investigate the degradation mechanism regarding the lithium fluoride generation in the pristine cathode, the morphology of electrode and the chemical mappings of7Li2O+, OH-, C2-, F-,6Li7LiF2+, and7Li2F+secondary ions are compared (Figure 3). As shown in Figure 3a, the SEM image indicates the detection region on the crosssectional interface. The vertical fringes are due to the “curtain effect”after FIB milling.[48]The contrast of this SEM image mainly reflects the atomic number sensitivity,where bright regions are NMC and the dark regions around NMC particles are the mixture of conductive carbon black and PVDF, which has been confirmed by previously reported work.[49,50]This could also be confirmed by the SEM images of NMC particles only (Figure S4a) and conductive carbon only (Figure S4b).To show the outline of NMC particles,a false-colored SEM image with adjusted contrast(Figure 3b)is made from Figure 3a.The red outlines indicate the profiles of NMC particles. In the chemical mappings(Figure 3c–h), the high-intensity7Li2O+region and the representative ion group of alkaline species (OH-) overlap well with NMC regions,while the C2-from carbon black is located around NMC regions uniformly. The secondary ion of F-from PVDF binder is mainly distributed at the juncture between NMC and carbon materials. The emerging lithium fluoride fragments (6Li7LiF2+and7Li2F+) distribute at the interphase less uniformly. In previous works, Amine et al. and Tarascon et al.noticed a dehydrofluorination reaction of PVDF through FTIR, DSC, and XPS characterization.[51,52]The dehydrofluorination of PVDF is known to occur in alkaline medium readily as follows:[39,52,53]
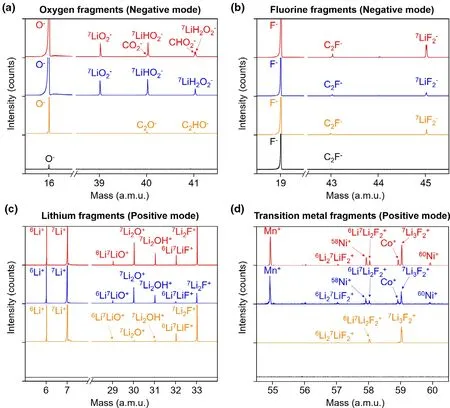
Figure 2. The ToF-SIMS mass spectra obtained from the cross-sectional interfaces. (Black trace: pristine anode, Orange trace: cycled anode, Blue trace: pristine cathode, Red trace: cycled cathode. The a.m.u.refers to the atomic mass unit.) a) The negative mode of oxygen-based fragments, including 7LiO2- from NMC and C2O- from electrolyte decomposition. b) The negative mode of fluorine-based fragments,including C2F- from PVDF and 7LiF2- from lithium fluoride. c) The positive mode of lithium-based fragments, including 7Li2O+ from NMC (cathode) / lithium oxides (anode) and 7Li2F+ from lithium fluoride. d) The positive mode of transition-metal-based fragments, including Mn+, 58Ni+, Co+, and 60Ni+from NMC.

From our results, the presumptive degradation mechanism of pristine NMC electrode has been concluded and illustrated in Figure 3i. Unlike the ideal condition that NMC particle, carbon black and PVDF binder mixed well without interaction, the NMC particles were hydrolyzed by moisture during the slurry preparation process,generating plenty of alkaline medium of OH-.[54]In addition, the excessive LiOH that has been added as a reactant to product active material could also provide a small part of the alkaline medium.[55]The PVDF binder underwent a defluorination process then, leading to the loss of binding functionality and generation of hydrogen fluoride. The highly reactive hydrogen fluoride acts as the donor of fluoride radical, which reacts with the lithium ions to generate the stable lithium fluoride at the interphase between PVDF and NMC.This spontaneous degradation results in about 3.5% loss of lithium inventory based on the quantitative analysis of lithium isotope ratio (details are shown in Figure S5). Based on the above understanding, reducing the moisture content in the slurry preparation process of the NMC electrode could significantly avoid the hydrolysis of NMC and the formation of the alkaline medium. Besides, removing the excessive LiOH in the NMC material could also contribute to reducing the content of the detrimental alkaline medium. Both procedures could help to remove the dehydrofluorination of the PVDF binder and improved the durability of the batteries.
In addition to the analysis of chemical composition and distribution, the isotope labeling and the analysis of the isotope effect is an established approach to study the chemical reactions.[56]Here, the proportion of lithium isotopes is determined through the integral area of specific secondary ion in the mass spectra. In the pristine NMC cathode, the integral area ratio of6Li+/7Li+is 7.6/92.4, which agrees well with the primordial nuclide ratio of lithium in nature (7.59/92.41). As for the isotopes in lithium fluoride,the ratio is determined through the representative secondary ions of6LiF2-and7LiF2-. Notably, the concentration of6Li+/7Li+in lithium fluoride is 31.3/68.7, increasing by 23.7% than that in NMC cathode (detailed results are shown in Table S6).These results further indicate that the lithium fluoride is the newly formed component, and the high level of lighter6Li isotope is attributed to the higher reaction rate and/or faster migration speeds due to the kinetic isotope effect.[57,58]
2.3. Deposition of Inactivated Transition-Metal Ions

Figure 3. SEM and ToF-SIMS chemical mapping of pristine NMC cathode at the cross-sectional interface.All scale bars:10 μm.a)The SEM image of the detection region on the cross-sectional interface of the pristine cathode,where the contrast mainly reflects the atomic number sensitivity.b)False-colored SEM image with adjusted contrast from the original SEM image.The red outlines indicate the profiles of NMC particles.c–h)ToF-SIMS chemical mappings of representative secondary ions, corresponding to the NMC active material(7Li2O+),alkaline medium(OH-),conductive carbon black(12C-),PVDF binder(F-),and the lithium fluoride(6Li7LiF2+ and 7Li2F+). Here, the isotopes of 6Li and 7Li are used to ensure the reliability of spectrum assignment. i) The schematic diagram of the dehydrofluorination reaction of PVDF and the generation of lithium fluoride during electrode preparation.
Here,we compare and analyze the chemical mapping and mass spectra of transition-metal relevant fragments obtained from the cross-sectional interface of the pristine and cycled cathode (Figure S7 and Figure 4).The transition-metal-oxygen (TM-O) secondary ions (MnO-, CoO-,and60NiO-) and transition-metal-fluorine (TM-F) secondary ions(MnF3-, CoF3-, and60NiF3-) are selected to identify the NMC active material and deposition products, respectively. In pristine cathode, the chemical mappings of TM-O secondary ions display the uniform distribution of NMC material (Figure S7a–c), while very weak signal of the TM-F secondary ions with random distribution are detected at the entire cross-sectional interface (Figure S7d–f). After 1000 cycles, the TM-O secondary ions(MnO-,CoO-and60NiO-)are still evenly distributed,outlining the profiles of NMC particles clearly (Figure 4a–c). Notably,there are observable regions of MnF3-secondary ions around the profiles of NMC particles (Figure 4d), while no substantive NiF3-and CoF3-secondary ions is detected(Figure 4e,f).To further quantify the emerging TM-F secondary ions,the mass spectra of MnF3-,NiF3-and CoF3-fragments are compared(Figure S8).The mass spectra of cycled cathode clearly show that the MnF3-secondary ion intensity is significant,while only negligible peaks of NiF3-or CoF3-secondary ions are detected.The weak MnF3-peak in pristine cathode could be attributed to the reaction with fluoride radical originated from the dehydrofluorination reaction of PVDF binder.This experimental regularity regarding the concentration gradient (MnF3-?CoF3-> NiF3-) is in accordance well with the difference of electropositivity between manganese(1.55),nickel(1.91),and cobalt(1.88).[37]Interestingly,there is an exceptional high-intensity spot in the MnF3-chemical mapping(highlighted in the orange box,Figure 4d).To find out what caused this high-intensity spot,the corresponding SEM image of the cross-sectional interface(Figure 4g)and the zoom-in view of the same orange box region (Figure 4h) are carefully observed. The zoom-in SEM shows that there is no “curtain effect”at the high-intensity spot,confirming that this area is the original surface below the fresh milling interface(previously as an interior cavity).This evidence indicates that the manganese fluoride degradation product accumulates on the surface of electrode particles.
2.4. The Irreversible Parasitic Reaction at the Graphite Anode
The irreversible parasitic reaction at the anode side is another significant reason for the capacity fade.[59,60]To study the irreversible degradation products created by the parasitic reaction,the ToF-SIMS chemical mappings of cycled graphite anode at fully de-intercalated state are investigated. The12C-chemical mapping outlines the pebble-shaped natural graphite clearly (Figure S9), which is overlapped well with the graphite regions in the SEM image(Figure S10).7Li2F+and7Li2O+are observed at the juncture between each graphite pebbles(Figure S11), corresponding to the irreversible lithium compounds. Besides, the large lithium atom cluster(7Li3+),which normally generated from the lithium metal, cannot be detected at the entire interface(Figure S12). These results indicate that the irreversible lithium compounds at the subsurface of graphite anode consist of lithium fluoride and oxidic/carbonated lithium and have the ability to exist stably at the fully deintercalation (oxidation) state. In addition,the mass spectra of the pristine and cycled anode are compared.As shown in Figure 5a,the6LiF2-and7LiF2-represent the emerging precipitated lithium fluoride. One of the well-known insights for the origin of lithium fluoride is the decomposition of the organic electrolyte. The PO-fragment supports the precipitation of POF3, and the C2O-and C2OH-represent the carbonated products that decomposed from the electrolyte solvents. Considering the above result, from the mass spectra perspective, the experimental proof of precipitation products is in accord with the widely accepted degradation products of the electrolyte, as illustrated in the schematic illustrates shown in Figure 5b.[61,62]
3. Conclusion
In summary, the integration of two techniques in one system enables the chemical survey for the cross-sectional interface of LIB electrodes, not only featuring higher sensitivity and extended depth resolution but also avoiding the side reactions caused by the ambient atmosphere during the sample transfer process. Based on this ToF-SIMS attached PFIB-SEM setup, the investigation toward the degradation of electrodes can be progressed with the aid of chemical analyses on the deactivation and parasitic reactions. Particularly, a series of original evidence for diagnosing degradation products and understanding degradation mechanisms are obtained as follows: 1) The degradation during the cathode electrode preparation: the hydrolysis of cathode material creates plenty of alkaline medium; the PVDF binder decomposes in alkaline medium and offers fluoride radical then; the lithium fluoride forms, leading to the loss of lithium inventory. 2) The transition-metal deposition: the manganese is more dominant than cobalt and nickel in the newly formed inactive fluoride deposition on the cathode side; no significant transition metal could deposit inside the anode electrode. These chemical analysis results obtained from the depth of electrodes offer new insights into understanding the degradation mechanism in LIBs. Furthermore, the in situ chemical information characterization is technically achievable based on this integrated system, because no transfer process is required throughout the test. The in situ cycling of the cell can be realized by introducing an external potentiostat via a manipulator that has already been integrated into the system.[63]The morphology and chemical information of the cell can be obtained in real time then. Besides, by stacking the 2D layers in a 3D space and aligning the pixels in the slicing direction, a 3D reconstruction or a serial sectioning tomography consisting of voxels can be derived, featuring extended resolution along the depth direction. This Xe+PFIB-SEM/ToF-SIMS technique enables high-sensitivity and high-precision observations of chemical information in cross-sectional interfaces,especially paving an effective foundation for lithium characterization in LIBs electrodes.

Figure 4. ToF-SIMS chemical mapping and SEM of cycled NMC cathode at the cross-sectional interface. All scale bar: 10 μm. a–f) ToF-SIMS chemical mappings of representative secondary ions obtained from the cross-sectional interface of the cycled cathode, corresponding to the NMC active material(MnO-, CoO- and 60NiO-) and transition-metal fluorides (MnF3-, CoF3-, and 60NiF3-). g) SEM image of the detection region on the cross-sectional interface of the cycled cathode. h) The zoom-in view of the orange box in (d) and (g), which comprises the high-intensity MnF3- spot, corresponding to the original surface (interior cavity) without “curtain effect.”

Figure 5. The ToF‐SIMS mass spectra at the graphite anode in fully de‐intercalation state and the reaction routes of irreversible parasitic reaction.a)The mass spectra comparison between pristine(blue trace)graphite anode and cycled(red trace)graphite anode at the fully de‐intercalation state.b)The schematic illustration shows the reaction routes of multi‐step decomposition of electrolyte at graphite anode.
4. Experimental Section
Electrode Preparation: Lithium nickel cobalt manganese oxide (NMC532, LiNi0.5Mn0.3Co0.2O2)powder (Toda America), graphite (Superior Graphite,1520 T),conductive carbon black(Denka,Li-100), PVDF (Solef?5130, Solvay), and N-methyl-2-pyrrolidone (NMP) were used in the electrode formulation.1.2 M LiPF6in EC/EMC 30/70 wt%solvent was purchased from Soulbrain MI as the electrolyte.All chemicals were used directly as purchased. The water content in electrolyte is below 15 ppm, and water content in NMP solvent is below 50 ppm.The lithium residuals in the raw NMC532 powder includes Li2CO3at 0.05%and LiOH at 0.03%.For the preparation of the electrode,the NMC532 cathode and graphite anode were mixed with conductive carbon black and PVDF(mass ratio:90:5:5)in NMP solvent to form a homogeneous slurry,respectively.Then,the slurries were coated onto Al foil(Cu foil for graphite anode)and dried using a slot-die coating equipment(Frontier Industrial Technology)at ORNL Battery Manufacturing R&D Facility(BMF).The drying was conducted by blowing hot air at 90°C for 20 min.Then,a secondary drying procedure of the NMC532 cathodes was carried out in a vacuum furnace(maintaining 30 in Hg vacuum)at 90°C for 2 h.The humidity of the drying room was kept below 0.5%(-53°C dew point maintained).The mass loading of the NMC532 is 2.5 mg/cm2and the negative/positive ratio is 1.15.
Characterization: The electrochemical measurements were carried out with a pouch cell. The pouch cell assembly was conducted in a dry room with a dew point of less than -50°C (0.1% RH) at the BMF. The nominal capacity of the pouch cell is 170 mAh. The cells were cycled between 2.5 and 4.2 V at C/3 charging-discharging rates for 1000 cycles. The cycling performance is shown in Figure S2 with the initial specific capacity of over 160 mAh g-1. The capacity retention of 75%has been achieved after 1000 cycles.Then,the cell was disassembled in an Ar-filled glove box and the electrodes were rinsed three times with DMC solvent. Both electrodes were mounted onto a FIB-SEM sampler holder,and the holder was sealed in a bag in the glovebox. To reduce the influence of the air during the transfer process,the sealed bag with the holder was kept inside another Ar-filled bag, which was used to blow Ar flowing while inserting the holder into the FIB-SEM chamber.
For the implementation of the chemical survey procedure,the PFIB-SEM/ToF-SIMS system was composed of the Xe+source-based PFIB-SEM platform(TESCAN XEIA3 instrument) and high-resolution orthogonal scanning ToFSIMS analyzer(H-TOF type from TOFWERK AG),which is developed collaboratively by EMPA(Swiss Federal Laboratories for Materials Science and Technology,Thun)and TESCAN company.(Brno, CZ).[64]The physical sputtering of ion beam and ionization was the source for both PFIB milling and SIMS.In this work,the accelerating voltage of 30 kV for Xe+beam with a corresponding beam current of 220 pA was used.The incident angle of the primary Xe+beam was 55° degree off the normal. ToF-SIMS measurements over 30 × 30 μm2sample area of the cathode(40 × 40 μm2for the anode)were carried out, corresponding to 100 × 100 × 100 pixels on the mapping. The chemical mapping is obtained by scanning a FIB across the sample surface,and the depth profile is obtained by integrating each scanning along the depth direction. The resolution of the chemical mapping is 300 × 300 nm2(400 × 400 nm2for the anode)per pixel,and the depth resolution is about 0.2 nm per frame. The influence of ion-beam mixing is excluded during the analysis. The fragmentation and/or recombination of species are dismissed due to the low ion flux and minimal combination opportunity.Both positive and negative modes were applied on cathode and anode samples to detect positive and negative secondary ions,respectively.
Acknowledgements
The electrochemical part of the research done at Oak Ridge National Laboratory,managed by UT Battelle, LLC, for the U.S. Department of Energy (DOE) under contract DE-AC05-00OR22725, was sponsored by the Office of Energy Efficiency and Renewable Energy(EERE)Vehicle Technologies Office.T.S.acknowledges the support from the EPSRC project (EP/P001521/1) “Integrated Plasma Source Focused Ion Beam with Scanning Electron Microscope.” Y.Z. acknowledges support from EPSRC project(EP/V002260/1),UK National Measurement System and ISCF Measurement Fellowship. X.Y. and Y.Z. would like to thank Dr Juyeon Park from National Physical Laboratory(UK)for the discussion and suggestions.
Conflict of interest
The authors declare no conflict of interest.
Supporting Information
Supporting Informationis available from the Wiley Online Library or from the author.
Keywords
degradation, lithium-ion battery, mass spectrometry, plasma focused ion beam, subsurface
Received: April 14, 2021
Revised: May 17, 2021
Published online: May 20, 2021
[1] J. Twidell, T. Weir, Renewable Energy Resources, Routledge, London 2015.
[2] S. J. Davis, N. S. Lewis, M. Shaner, S. Aggarwal, D. Arent, I. L. Azevedo,S. M. Benson, T. Bradley, J. Brouwer, Y.-M. Chiang, Science 2018, 360,eaas9793.
[3] F. F. Nerini, J. Tomei, L. S. To, I. Bisaga, P. Parikh, M. Black, A. Borrion,C. Spataru, V. C. Broto, G. Anandarajah, Nat. Energy 2018, 3, 10.
[4] M. R. Lukatskaya, B. Dunn, Y. Gogotsi, Nat. Commun. 2016, 7, 1.
[5] M. Winter, B. Barnett, K. Xu, Chem. Rev. 2018, 118, 11433.
[6] M. Li, J. Lu, Z. Chen, K. Amine, Adv. Mater. 2018, 30, 1800561.
[7] R. Schmuch, R. Wagner, G. H¨orpel, T. Placke, M. Winter, Nat. Energy 2018, 3, 267.
[8] A. Manthiram, J. C. Knight, S. T. Myung, S. M. Oh, Y. K. Sun, Adv.Energy Mater. 2016, 6, 1501010.
[9] P. K. Nayak, E. M. Erickson, F. Schipper, T. R. Penki, N. Munichandraiah,P. Adelhelm, H. Sclar, F. Amalraj, B. Markovsky, D. Aurbach, Adv. Energy Mater. 2018, 8, 1702397.
[10] J. W. Choi, D. Aurbach, Nat. Rev. Mater. 2016, 1, 16013.
[11] J. Liu, Z. Bao, Y. Cui, E. J. Dufek, J. B. Goodenough, P. Khalifah, Q. Li, B.Y. Liaw, P. Liu, A. Manthiram, Nat. Energy 2019, 4, 180.
[12] S. K. Jung, H. Gwon, J. Hong, K. Y. Park, D. H. Seo, H. Kim, J. Hyun, W.Yang, K. Kang, Adv. Energy Mater. 2014, 4, 1300787.
[13] C. Zhan, T. Wu, J. Lu, K. Amine, Energy Environ. Sci. 2018, 11, 243.
[14] M.Sathiya,A.M.Abakumov,D.Foix,G.Rousse,K.Ramesha,M.Sauban‵ere,M.Doublet,H.Vezin,C.Laisa,A.Prakash,Nat.Mater.2015,14,230.
[15] T. Kim, L. K. Ono, N. Fleck, S. R. Raga, Y. Qi, J. Mater. Chem. A 2018, 6,14449.
[16] Y. Zhou, M. Su, X. Yu, Y. Zhang, J.-G. Wang, X. Ren, R. Cao, W. Xu, D.R. Baer, Y. Du, Nat. Nanotechnol. 2020, 1.
[17] H. Maleki Kheimeh Sari, X. Li Adv. Energy Mater. 2019, 9, 1901597.
[18] L. Mai, M. Yan, Y. Zhao, Nature 2017, 546, 469.
[19] T. Li, X.-Z. Yuan, L. Zhang, D. Song, K. Shi, C. Bock, Electrochem. Energy Rev. 2020, 3, 43.
[20] Y. Xu, K. Wood, J. Coyle, C. Engtrakul, G. Teeter, C. Stoldt, A. Burrell, A.Zakutayev, J. Phys. Chem. C 2019, 123, 13219.
[21] J. Wandt, P. Jakes, J. Granwehr, R.-A. Eichel, H. A. Gasteiger, Mater.Today 2018, 21, 231.
[22] K. Kitada, O. Pecher, P. C. Magusin, M. F. Groh, R. S. Weatherup, C. P.Grey, J. Am. Chem. Soc. 2019, 141, 7014.
[23] R. V¨ali, A. J¨anes, T. Thomberg, E. Lust, Electrochim. Acta 2017, 253, 536.
[24] K.B.Dermenci,H.Tesa?rova,T.Samo?ril,S.Turan,J.Microsc.2020,277,42.
[25] H. Xu, S. Wang, A. Manthiram, Adv. Energy Mater. 2018, 8, 1800813.
[26] C. Jiao, L. Pillatsch, J. Mulders, D. Wall, Microsc. Microanal. 2019, 25, 876.
[27] H. Masuda, N. Ishida, Y. Ogata, D. Ito, D. Fujita, J. Power Sourc. 2018,400, 527.
[28] C. Dellen, H.-G. Gehrke, S. M¨oller, C.-L. Tsai, U. Breuer, S. Uhlenbruck, O. Guillon, M. Finsterbusch, M. Bram, J. Power Sourc. 2016,321, 241.
[29] P. Shearing, D. Brett, N. Brandon, Int. Mater. Rev. 2010, 55, 347.
[30] D. P. Finegan, A. Vamvakeros, C. Tan, T. M. Heenan, S. R. Daemi, N.Seitzman, M. Di Michiel, S. Jacques, A. M. Beale, D. J. Brett, Nat. Commun. 2020, 11, 1.
[31] J.Pisonero,B.Fern′andez,D.G¨unther,J.Anal.At.Spectrom.2009,24,1145.
[32] H. Ota, T. Sato, H. Suzuki, T. Usami, J. Power Sourc. 2001, 97, 107.
[33] A. L. Gray, Analyst 1985, 110, 551.
[34] N. Yabuuchi, K. Yoshii, S.-T. Myung, I. Nakai, S. Komaba, J. Am. Chem.Soc. 2011, 133, 4404.
[35] B. Chait, K. Standing, Int. J. Mass Spectrom. Ion Phys. 1981, 40, 185.
[36] W. Li, A. Dolocan, P. Oh, H. Celio, S. Park, J. Cho, A. Manthiram, Nat.Commun. 2017, 8, 14589.
[37] W. Li, U.-H. Kim, A. Dolocan, Y.-K. Sun, A. Manthiram, ACS Nano 2017,11, 5853.
[38] K. J. Harry, D. T. Hallinan, D. Y. Parkinson, A. A. Macdowell, N. P. Balsara, Nat. Mater. 2014, 13, 69.
[39] B. Xiao, X. Sun, Adv. Energy Mater. 2018, 8, 1802057.
[40] R. F. Ziesche, T. Arlt, D. P. Finegan, T. M. Heenan, A. Tengattini, D.Baum, N. Kardjilov, H. Mark¨otter, I. Manke, W. Kockelmann, Nat. Commun. 2020, 11, 1.
[41] M.-S. Song, R.-H. Kim, S.-W. Baek, K.-S. Lee, K. Park, A. Benayad, J.Mater. Chem. A 2014, 2, 631. https://doi.org/10.1039/C3TA12728A
[42] J. T. Lee, N. Nitta, J. Benson, A. Magasinski, T. F. Fuller, G. Yushin, Carbon 2013, 52, 388.
[43] T. Sui, B. Song, J. Dluhos, L. Lu, A. M. Korsunsky, Nano Energy 2015, 17,254.
[44] K. Dermenci, H. Tesa?rov′a, T.?Samo?ril, S. Turan, J. Microsc. 2020, 277, 42.
[45] R. Wilson, Int. J. Mass Spectrom. Ion Process. 1995, 143, 43.
[46] K. Zaghib, X. Song, A. Guerfi, R. Rioux, K. Kinoshita, J. Power Sourc.2003, 119, 8.
[47] M. Ochida, Y. Domi, T. Doi, S. Tsubouchi, H. Nakagawa, T. Yamanaka,T. Abe, Z. Ogumi, J. Electrochem. Soc. 2012, 159, A961.
[48] N. Nan, J. Wang, Adv. Mater. Sci. Eng. 2019, 2019, 1. https://doi.org/10.1155/2019/8680715
[49] M. Wang, J. Hu, Y. Wang, Y.-T. Cheng, J. Electrochem. Soc. 2019, 166,A2151.
[50] S. Thiberge, O. Zik, E. Moses, Rev. Sci. Instrum. 2004, 75, 2280.
[51] A. Andersson, D. Abraham, R. Haasch, S. MacLaren, J. Liu, K. Amine, J.Electrochem. Soc. 2002, 149, A1358.
[52] A. Du Pasquier, F. Disma, T. Bowmer, A. Gozdz, G. Amatucci, J. M.Tarascon, J. Electrochem. Soc. 1998, 145, 472.
[53] K. Edstr¨om, T. Gustafsson, J. O. Thomas, Electrochim. Acta 2004, 50,397.
[54] L. Zou, Y. He, Z. Liu, H. Jia, J. Zhu, J. Zheng, G. Wang, X. Li, J. Xiao, J.Liu, Nat. Commun. 2020, 11, 1.
[55] J. H. Park, J. K. Park, J. W. Lee, Bull. Korean Chem. Soc. 2016, 37, 344.
[56] J. P. Klinman, FEBS J. 2014, 281, 489.
[57] P. Atkins, J. De Paula, Atkins’ Physical Chemistry, 8th ed., Oxford University New York 2006.
[58] Y. Fujii, H. Kakihana, M. Okamoto, T. Oi, Y. Sakuma, Isotopenpraxis Isotopes Environ. Health Stud. 1979, 15, 203.
[59] F. Holtstiege, A. Wilken, M. Winter, T. Placke, PCCP 2017, 19, 25905.
[60] C. Daniel, J. O. Besenhard, Handbook of Battery Materials, Wiley-VCH,Weinheim 2011.
[61] V. A. Agubra, J. W. Fergus, J. Power Sourc. 2014, 268, 153.
[62] J. Ming, Z. Cao, W. Wahyudi, M. Li, P. Kumar, Y. Wu, J.-Y. Hwang, M.N. Hedhili, L. Cavallo, Y.-K. Sun, ACS Energy Lett. 2018, 3, 335.
[63] J. Z. Lee, T. A. Wynn, Y. S. Meng, D. Santhanagopalan, J. Vis. Exp. 2018,133, e56259.
[64] J. A. Whitby, F. ¨Ostlund, P. Horvath, M. Gabureac, J. L. Riesterer, I. Utke,M. Hohl, L. Sedl′a?cek, J. Jiru?se, V. Friedli, Adv. Mater. Sci. Eng. 2012, 2012,1. https://doi.org/10.1155/2012/180437
 Energy & Environmental Materials2022年2期
- Energy & Environmental Materials的其它文章
- Progress of Pb-Sn Mixed Perovskites for Photovoltaics:A Review
- Development Strategies in Transition Metal Borides for Electrochemical Water Splitting
- Polymer-/Ceramic-based Dielectric Composites for Energy Storage and Conversion
- Controllable Construction of Bifunctional CoxP@N,P-Doped Carbon Electrocatalysts for Rechargeable Zinc–Air Batteries
- Unveiling the Underlying Mechanism of Transition Metal Atoms Anchored Square Tetracyanoquinodimethane Monolayers as Electrocatalysts for N2 Fixation
- Rational Design of High-Performance Bilayer Solar Evaporator by Using Waste Polyester-Derived Porous Carbon-Coated Wood