
Pre-Processing, Quality Assurance, and Use of Global Atmospheric Motion Vector Observations in CRA
2023-01-16 12:06MinyanWANGShuangYAOLipengJIANGTaoZHANGChunxiangSHIandTingZHU
Minyan WANG, Shuang YAO, Lipeng JIANG,2, Tao ZHANG, Chunxiang SHI, and Ting ZHU,2
1 National Meteorological Information Centre, China Meteorological Administration, Beijing 100081
2 CMA Earth System Modeling and Prediction Centre, China Meteorological Administration (CMA), Beijing 100081
ABSTRACT Assimilation of atmospheric motion vectors (AMVs) is important in the initialization of the atmospheric state in numerical weather prediction models, especially over oceans and at high latitudes where conventional data are sparse.This paper presents a detailed description of the pre-processing, quality assurance, and use of global AMVs in China’s first generation of the 40-yr (1979–2018) CRA global atmospheric reanalysis product. A new AMV archive is integrated from near real-time operational Global Telecommunication System data and reprocessed AMV datasets released or produced mainly during 2014–2016 according to a priority principle. To avoid the misuse of data with systematic quality problems, the observations of all 18 types of AMVs from 54 satellites are pre-evaluated over the whole time series. The pre-evaluation system developed by the CRA team is based on the NCEP Gridpoint Statistical Interpolation (GSI) three-dimensional variational assimilation system and the ERA-Interim reanalysis product. The AMVs in the new AMV archive are denser than the AMVs prepared for the Climate Forecast System Reanalysis product, the bias and root-mean-square values are smaller, and the time series are steadier. The new AMV archive is assimilated in the CRA product based on the NCEP GSI assimilation procedure and quality control configuration with reference to the pre-evaluation results. This is the first time that the reprocessed AMVs from Fengyun-2 satellites from June 2005 to July 2017 are assimilated in a reanalysis product. The assimilation features inspire confidence in the accuracy and stability of these data. The mean root-mean-square values of the observation minus analysis infrared, water vapor, and visible AMV were 1.5–3.4, 2.7–3.6, and 1.3–2.1 m s?1, respectively. This experience of integrating, pre-evaluating, and assimilating AMV observations is valuable for the next generation of reanalysis products.
Key words: reanalysis, CRA (China’s first generation of 40-yr global atmospheric ReAnalysis product), atmospheric motion vector, integration, assimilation, reprocessed data
1. Introduction
Knowledge of winds in the upper atmosphere is essential to our understanding of the earth’s general circulation. Atmospheric motion vectors (AMVs) are wind observations derived by tracking clouds or water vapor(WV) features in consecutive satellite images. The assimilation of AMVs is an important prerequisite for the initialization of the state of the atmosphere in numerical weather prediction (NWP) models (Schmetz et al., 1993;Nieman et al., 1997), especially over oceanic regions and high latitudes where conventional data are sparse. A significant positive impact on forecast skills has been identified after the routine assimilation of AMVs by operational NWP centers (Pu et al., 2008). AMVs are now the third to fourth most important satellite observations based on the forecast sensitivity to observations method (Forsythe et al., 2016; Eyre, 2020).
The retrieval of AMVs has been evolving in most satellite data centers since the early 1970s (Kuhlow and Chatters, 1978). Traditionally, AMVs are derived from geostationary meteorological satellite images around 55°S–55°N. Operational AMV products are mainly from the Meteorological satellite series (METEOSAT) operated by the European Organisation for the Exploitation of Meteorological Satellites (EUMETSAT), the Geostationary Operational Environment Satellite (GOES) series operated by the NOAA/National Environmental Satellite,Data, and Information Service (NESDIS), the Geostationary Meteorological Satellite (GMS)/Multifunctional Transport Satellite (MTSAT)/Himawari series operated by the Japan Meteorological Agency/Meteorological Satellite Center (JMA/MSC), and the Fengyun-2 (FY-2)satellite series operated by the China Meteorological Administration/National Satellite Meteorological Centre(CMA/NSMC). The observational scopes of the geostationary satellite AMVs from the METEOSAT series are larger, whereas the spatial resolutions from the GOES series are finer. The quality and stability of the near realtime operational AMVs are better in most recent years(www.ecmwf.int/en/forecasts/charts/obstat).
In recent decades, sequences of images from lowearth-orbit satellites—for example, the Terra, Aqua,NOAA, and Meteorological Operational (MetOp) satellites and the Suomi National Polar-Orbiting Partnership(SNPP) satellite—have also been used to retrieve polar winds over high latitudes (Santek, 2010; Huckle and Schulz, 2012; Lazzara et al., 2014). The spatial resolutions of polar winds from the new generations of satellites are finer, decreasing from the traditional 60 km(Terra, Aqua, and NOAA) and 30.8 km (MetOp) resolutions to 14.25 km (SNPP).
The development of satellite instruments has been rapid: from the METEOSAT Visible and Infrared Imager (MVIRI) to the Spinning Enhanced Visible and Infrared Imager (SEVIRI); from the Visible-Infrared Spin Scan Radiometer (VISSR) to the Japanese Advanced Meteorological Imager (JAMI) and the Advanced Himawari Imagery (AHI); and from the Advanced Very High Resolution Radiometer (AVHRR) to the Moderate Resolution Imaging Spectroradiometer (MODIS) and Visible Infrared Imaging Radiometer Suite (VIIRS). In addition to the traditional infrared (IR) channels, the radiance from WV, WV in clear sky (WVCS), visible (VIS),and shortwave infrared (SWIR) channels have also been used to derive AMVs.
Aside from their usage in NWP models, AMVs are also one of the established observational datasets for long time series of reanalysis products. The collection, integration, evaluation, and assimilation of historical AMV data are also essential in the third generation of reanalysis products, such as the NCEP Climate Forecast System Reanalysis (CFSR) product (Saha et al., 2010), the NASA Modern-Era Retrospective analysis for Research and Applications (MERRA) product (Rienecker et al.,2011), the ECMWF Interim reanalysis (ERA-Interim)product (Dee et al., 2011), and the JMA Japanese 55-year Reanalysis (JRA-55) (Kobayashi et al., 2015) product.Reprocessed AMVs with sustained, coherent approaches are required for new reanalysis products, as requested by Core-Climax (Poli, 2013).
In 2014, the CMA initiated a project to produce CRA:China’s first generation 40-yr global atmospheric reanalysis product (Liu et al., 2017). This reanalysis product has been available to the public since May 2021. It aims to enhance the accuracy of historical synoptic analyses and facilitate in-depth investigations of various weather and climate systems. The CRA product covers from January 1979 to December 2018 at 6-h intervals and continues to be extended forward in near real-time. It is based on the Global Spectral Model of the NCEP Global Forecast System (GFS) and the Community Gridpoint Statistical Interpolation (GSI) three-dimensional variational data assimilation system with a resolution of T1534 (about 34 km) and 64 levels (about 55 km) to 0.1 hPa. In contrast with other reanalysis products, multiple types of high-quality data are assimilated into the CRA product, such as integrated aircraft datasets (Liao et al.,2018, 2021), bias-corrected radiosonde data (Chen et al.,2021), ground observations over the Tibetan Plateau,newly released reprocessed observations of AMVs,ocean vector winds, and global positioning system occultation observations (Wang et al., 2018). The data quality of the CRA product is generally equivalent to that of the international third generation global reanalysis products (Liu et al., 2020). The CRA product has been validated by research institutes through multiple trial evaluations and compared with other reanalysis products,such as the ERA5 and CFSR products (Zhao et al., 2019;Ye et al., 2021; Yu et al., 2021; Zhao et al., 2021; Shen et al., 2022).
This paper describes the pre-processing, quality assurance, and use of integrated AMV datasets from 1979 to 2018 in the CRA product. Data sources and coverage are summarized in Section 2. Data pre-processing is discussed in Section 3, including data reformatting for assimilation and integration. The data assurance is introduced in Section 4. The results are given in Section 5, including the pre-evaluation and use of the data in the CRA product. A summary and perspectives are given in Section 6.
2. Data
2.1 Data sources
The historical AMV observations for the CRA reanalysis product (CRA_OBS) are from reprocessed AMV datasets and near real-time operational Global Telecommunication System (GTS) data. Tables 1 and 2 list basic information about the reprocessed AMV datasets from geostationary and polar-orbiting satellites, respectively.The data suppliers include EUMETSAT (Doutriaux-Boucher et al., 2014; navigator.eumetsat.int), the University of Wisconsin/Cooperative Institute for Meteorological Satellite Studies (UW/CIMSS) (Velden et al.,2005; ftp.ssec.wisc.edu/velden/winds/wind_files, ftp://stratus.ssec.wisc.edu/pub/winds/histavhrr/version2015),the JMA/MSC (Oyama, 2007, 2010), and the CMA/NSMC (Xu et al., 2014; Zhang et al., 2014). The time periods of the reprocessed AMVs are different for different channels—for example, the GMS VIS and WV AMVs have been available since March 1987 and June 1995, respectively, and the METEOSAT First Generation (MFG)High-Resolution Visible (HRVIS) wind dataset (0°) ends one year later than the MFG wind dataset (0°). The data formats of the reprocessed datasets are the World Meteorological Organization (WMO) FM94-IX Binary Universal Form for the Representation of Meteorological Data (BUFR), TXT, the MFG OpenMTP (a new format developed for the METEOSAT Transition Programme),and the FY-2 Advanced Weather satellite eXchange format (AWX). The time series of these homogeneousreprocessed AMVs and polar winds are steadier and their coverage is wider. The high-quality datasets are assimilated into the fifth generation ECMWF atmospheric reanalysis of the global climate (ERA5) product (Eyre,2020; Hersbach et al., 2020), except the reprocessed FY-2 AMVs, which are produced later.
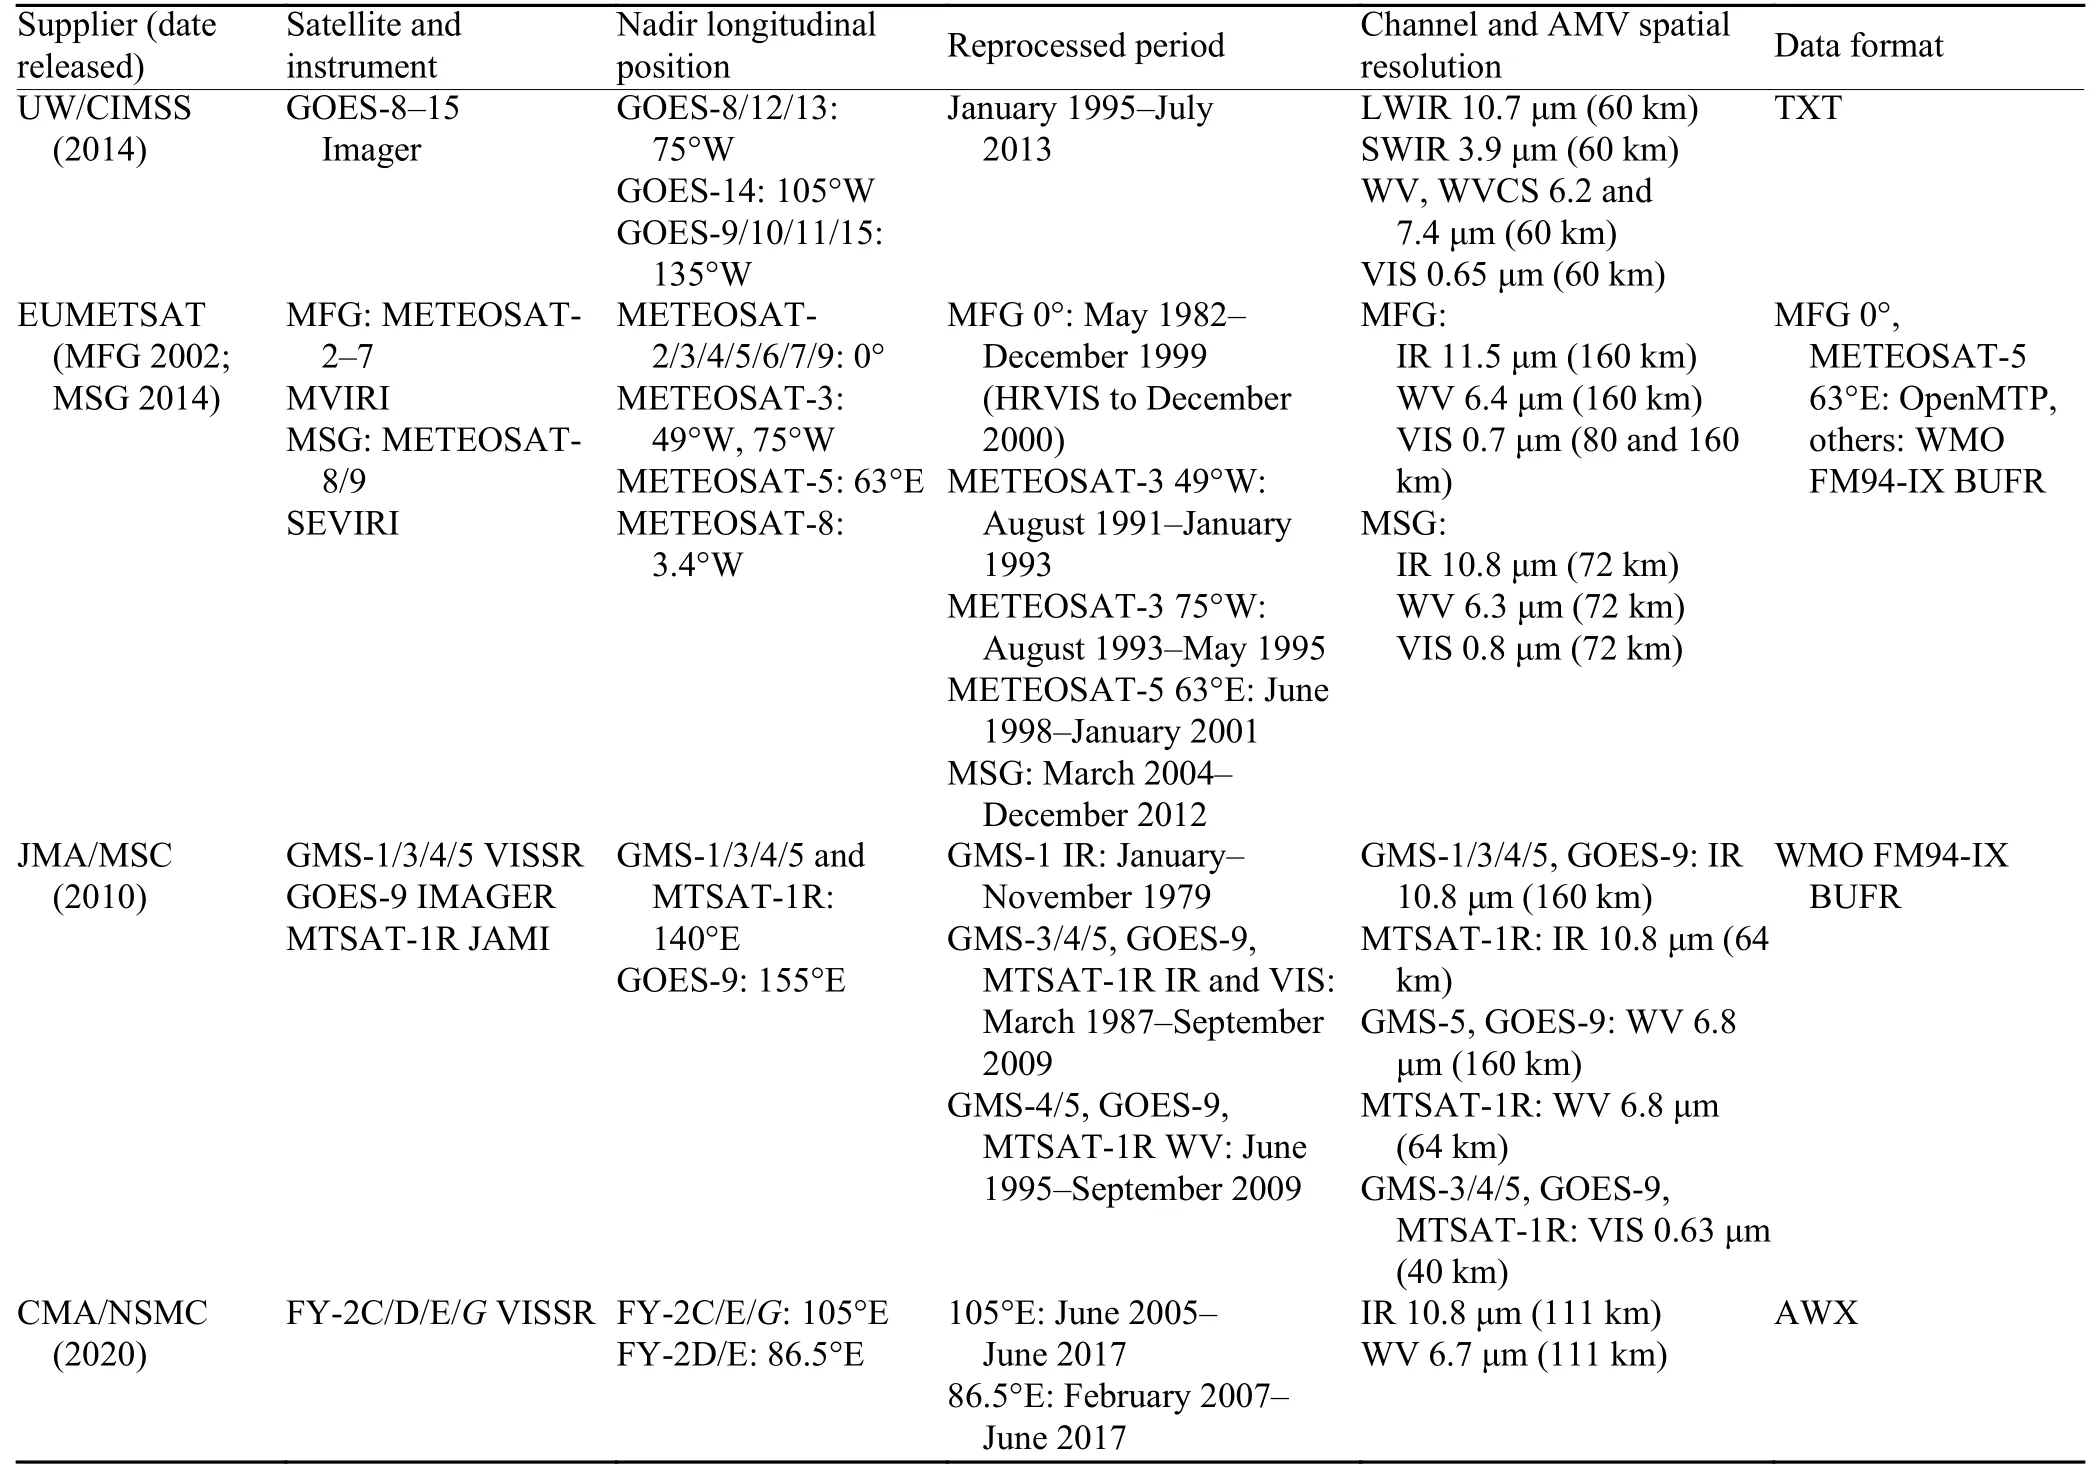
Table 1. Data sources and basic information about the reprocessed AMV datasets from geostationary satellites used in the CRA product
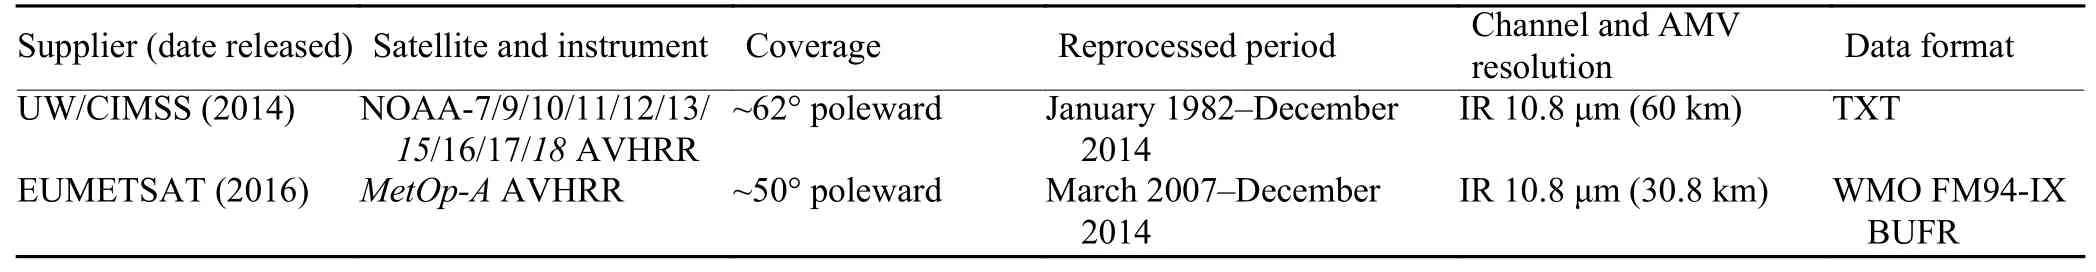
Table 2. Data sources and basic information about the reprocessed AMV datasets from polar-orbiting satellites used in the CRA product
The observations prepared for the CFSR reanalysis product from 1979 to 2014 are a complete dataset (CFSR_OBS). The primary data source of the AMVs from CFSR_OBS is the near real-time operational GTS data.A small part of the reprocessed AMV datasets released before 2010 have been replaced. The reprocessed GMS-3/4/5 AMVs from 1987 to 2003 prepared for JRA-25 are included in CFSR_OBS (Saha et al., 2010). The data format of the AMVs is the NCEP PrepBUFR for GSI to assimilate conventional wind observations and AMVs.
The GDAS_OBS consists of observations prepared for the NCEP GFS and the Global Data Assimilation System (GDAS). The data used in the CRA product have been collected since May 2013 and the data source is also the near real-time operational products from the GTS. The data format of the AMVs is the NCEP BUFR(dump) for GSI.
2.2 Data coverage
Figure 1 shows the timeline of the AMVs from 54 satellites prepared for the CRA product from 1979 to 2018. The observations are from 38 geostationary satellites and 16 polar-orbiting satellites. Some early satellite sources were not correctly identified when they were originally received, so these are labeled as GOES-X and GMS-X, representing GOES-1–8 and GMS-1–3, respectively.
The AMV observations cover over most of the globe(Fig. 2) from low levels (below 700 hPa), midlevels(400–700 hPa), to high levels (above 400 hPa). The number of AMVs from the CRA_OBS (Figs. 2b, d) is more than the number of AMVs from the CFSR_OBS (Figs.2a, c) because the CRA_OBS is based on the integration of reprocessed datasets and CFSR_OBS data. A case comparison of spatial distribution shows that the number of AMVs in 2009 (Figs. 2c, d) is more than the number of AMVs in 1994 (Figs. 2a, b). With the development of observing systems and the AMV retrieval algorithms, the frequency is increased from 2 times per day to 4–24 times per day for AMVs from geostationary satellites and the spatial resolutions are finer (Tables 1, 2). The density of AMV wind observations is much greater than the density of conventional wind observations from radiosondes, pilot balloons, aircraft, dropsondes, or wind profiles. The statistical results show that the number of assimilated zonal (u) and meridional (v) winds in the CRA product is 5.8 times the number in the conventional wind observations.
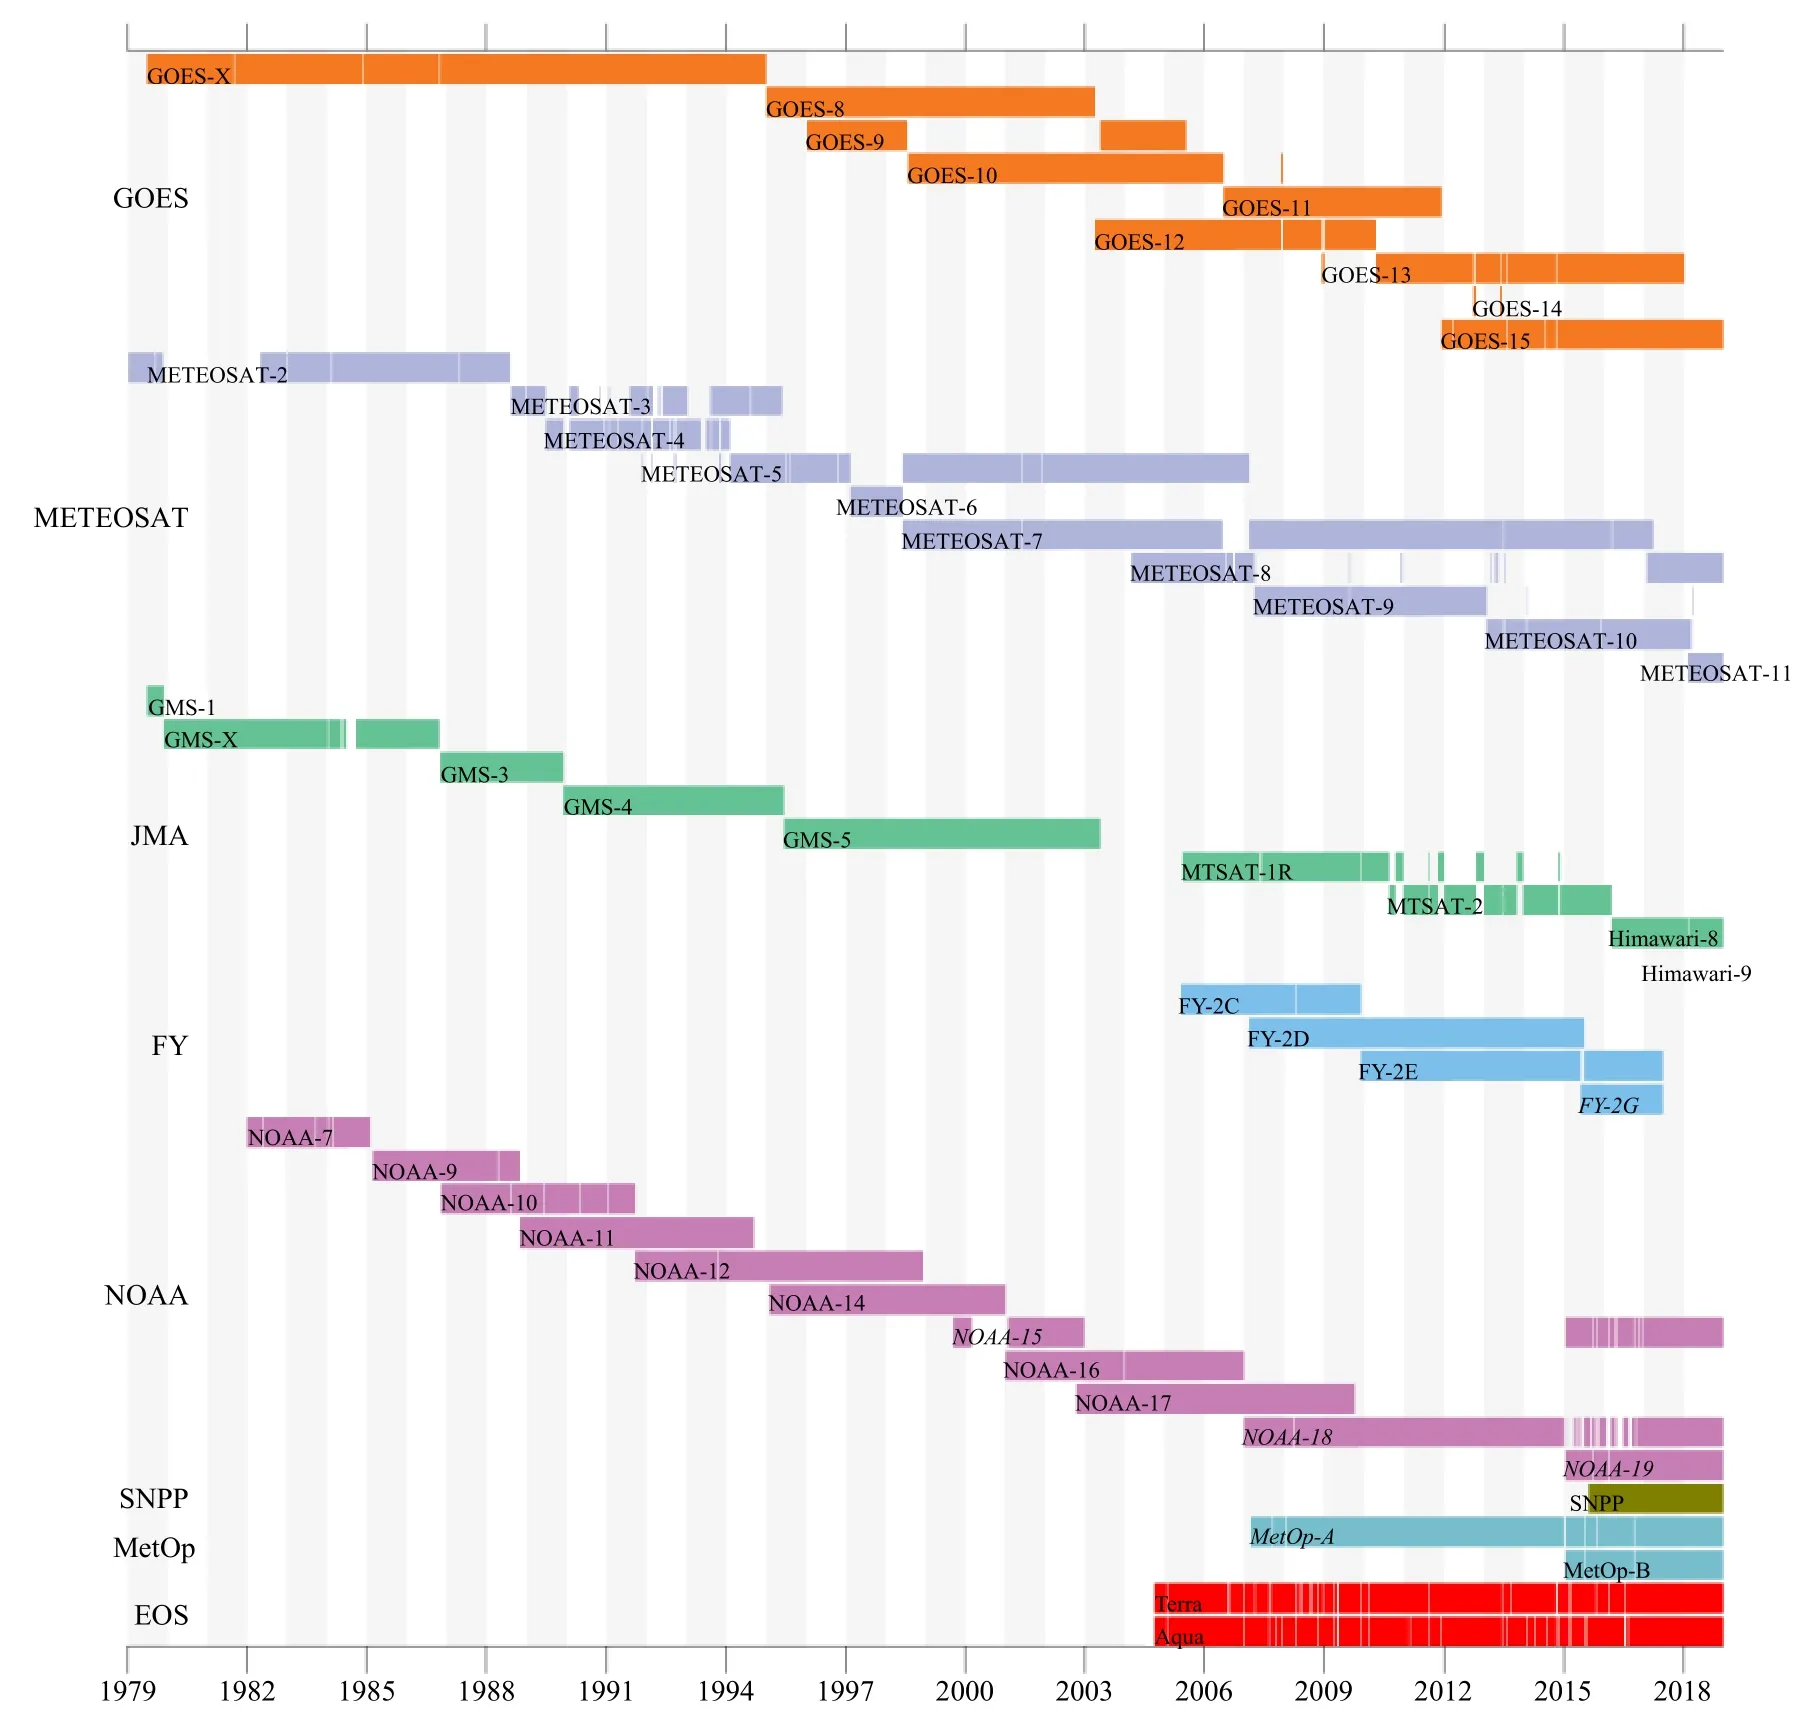
Fig. 1. Timeline of the AMVs from 54 satellites prepared for the CRA product.

Fig. 2. Spatial distributions of the IR AMVs from the (a) CFSR_OBS (19940928 0000 UTC), (b) CRA_OBS (19940928 0000 UTC), (c) CFSR_OBS (20090928 0000 UTC), and (d) CRA_OBS (20090928 0000 UTC) data. The number of observations is given in parentheses.
3. Data pre-processing
Two steps are used to prepare the AMVs for the CRA product from 1979 to 2018: (1) reformatting the AMV observations into a common data format based on the requirement of the assimilation system and (2) integration of the AMVs from different data sources based on a priority principle.
3.1 Data reformatting for assimilation
To simplify the integration process, the AMV observations from all the data sources are first reformatted into a common data format for the NCEP GSI: the NCEP BUFR (dump) format. Eighteen AMV types (Table 3) are prepared for the CRA product based on the GSI configuration, classified by satellite series and the satellite-derived wind computation method (SWCM).

Table 3. AMV types prepared for the CRA product
Some key parameters for assimilation need to be supplemented or computed. Although satellite identifications from the CFSR_OBS are invalid in the early years(GOES before May 1997, METEOSAT and GMS before 1998), they can be reckoned based on historical metadata. When the satellite zenith angle for geostationary satellites is unavailable, it can be computed based on geometrical relations. The zonal (u) and meridional (v)AMV winds from the CFSR_OBS are converted to wind speed and wind direction.
3.2 Data integration
The AMV observations are grouped into four files per day with a 6-h assimilation time window ingested by the GSI for assimilation: 0000 ± 0300, 0600 ± 0300, 1200 ±0300, and 1800 ± 0300 UTC. Information such as the identification of the satellite and the data source is included in the file name extensions. Based on the quality and homogeneity of the data, the priority of the reprocessed AMVs is higher than that of the AMVs from the GDAS_OBS and CFSR_OBS for the same satellite in the same assimilation time window. For the AMVs obtained after May 2013, the AMV files from the GDAS_OBS are selected rather than the files from the CFSR_OBS if reprocessed data are not available. For multi-reprocessed AMV datasets from a single data supplier, the priority is higher for the datasets with a finer spatial resolution—for example, the reprocessed MFG HRVIS AMVs with a spatial resolution of 80 km are selected and the MFG VIS AMVs with a spatial resolution of 160 km are excluded in the new AMV archive. For the reprocessed MetOp/AVHRR dataset, polar winds based on the EUMETSAT algorithm rather than the UW/CIMSS algorithm are selected as advised by the data supplier and the geographical coverage is larger.
In contrast with the CFSR_OBS, the reprocessed GOES SWIR WVDL, FY-2 IR WV, NOAA, and MetOp/AVHRR IR are new AMV types integrated into the new AMV archive. The monthly mean number of observations of the SWIR for the reprocessed GOES AMVs is 1.2 times that of the LWIR AMVs and the number of WVDL observations is 70% of the number of WVCT AMVs. The numbers of reprocessed FY-2 IR and WV AMVs are 2.1 and 1.5 times, respectively, the number of reprocessed METEOSAT IR and WV AMVs from June 2005 to December 2012 as a result of the overall adjustment and improvement algorithm (Wan et al., 2017;Zhang et al., 2017a, b). The number of reprocessed Met-Op/AVHRR IR polar winds is 20 times the number of reprocessed NOAA/AVHRR IR polar winds from March 2007 to December 2014.
The reprocessed AMVs are denser than those from the CFSR_OBS, especially for the IR AMVs from the geostationary satellites (Fig. 3). Compared with the CFSR_OBS, the reprocessed GOES LWIR, WVCT, VIS AMVs increased 9.6, 4.6, and 3.5 times, respectively,from January 1995, March 1998, and October 1998 to July 2013 (Figs. 3a, d, g) and the time series are longer.The number of reprocessed METEOSAT IR AMVs is 28.3 times that of the number of AMVs from the CFSR_OBS from August 1982 to December 2012(Fig. 3b). The number of reprocessed GMS/MTSAT IR AMVs increased 15.3 and 7.6 times from January to November 1979 and from March 1987 to September 2009, respectively, compared with the CFSR_OBS(Fig. 3c). The time series of the reprocessed GOES IR WV VIS, METEOSAT VIS, and GMS/MTSAT WV VIS AMVs are steadier (Figs. 3a, d, f–i).
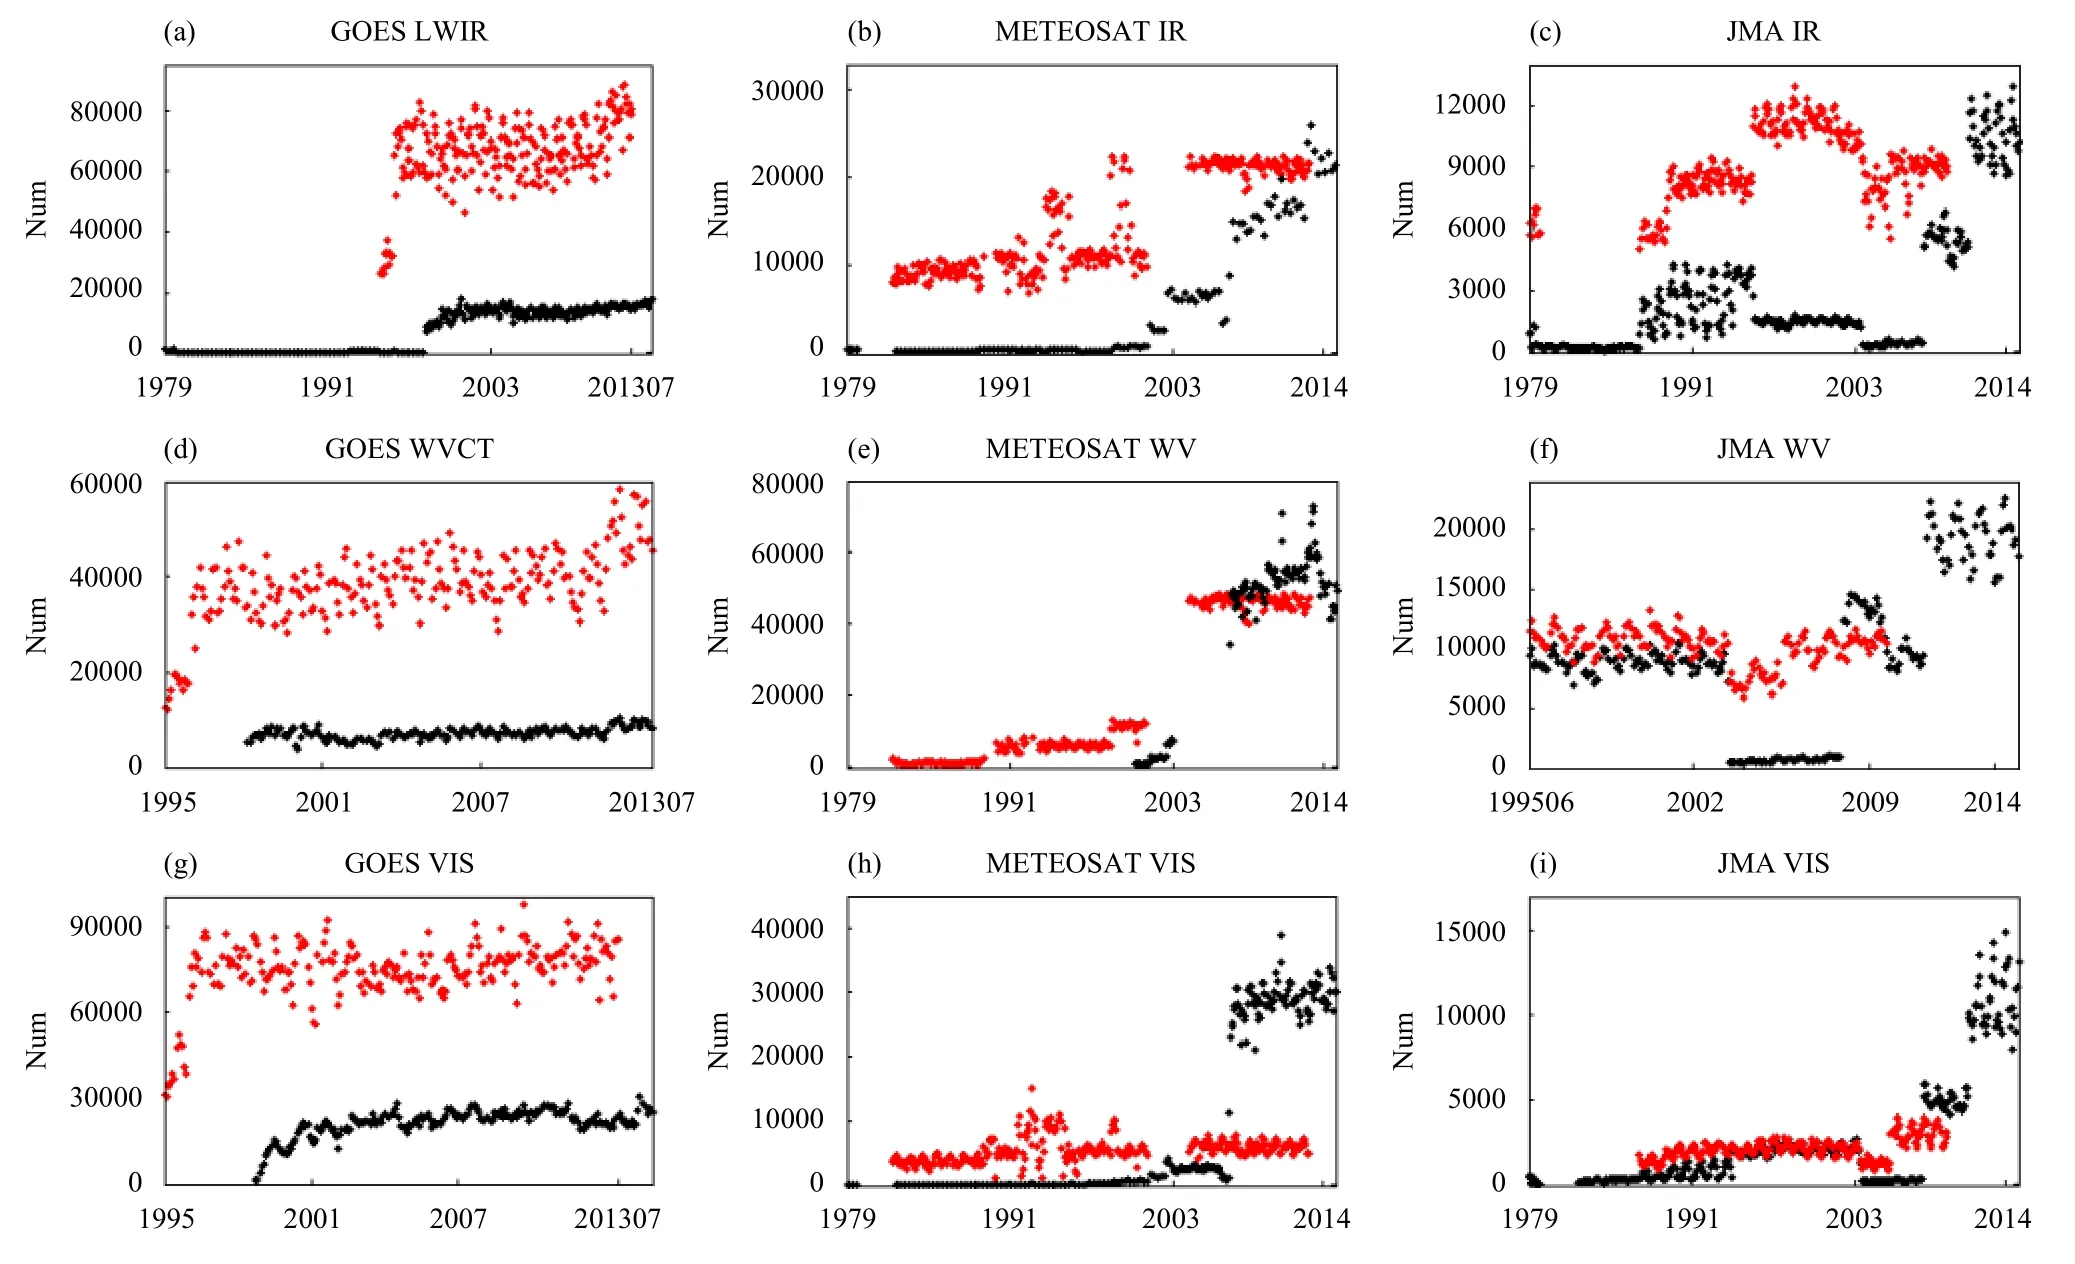
Fig. 3. Comparison of the monthly mean number of (a–c) IR, (d–f) WV, and (g–i) VIS AMV observations from the reprocessed AMV datasets(red) and the CFSR_OBS (black).
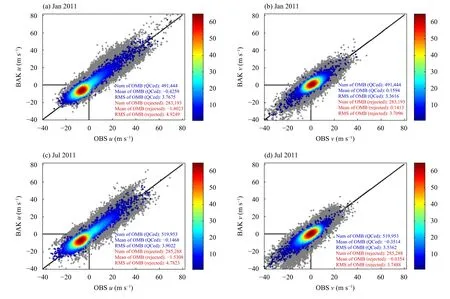
Fig. 4. Scatterplots of the wind observations (OBS) passing (colored with data density) and rejected (gray) by the quality control procedures versus the winds calculated from the 6-h forecast result (BAK) for the reprocessed FY-2D/E IR AMVs in (a, b) January and (c, d) July 2011.OMB is observation minus background. The wind speed of the background is from the 6-h forecast result (BAK). The unit of wind speed is m s?1.
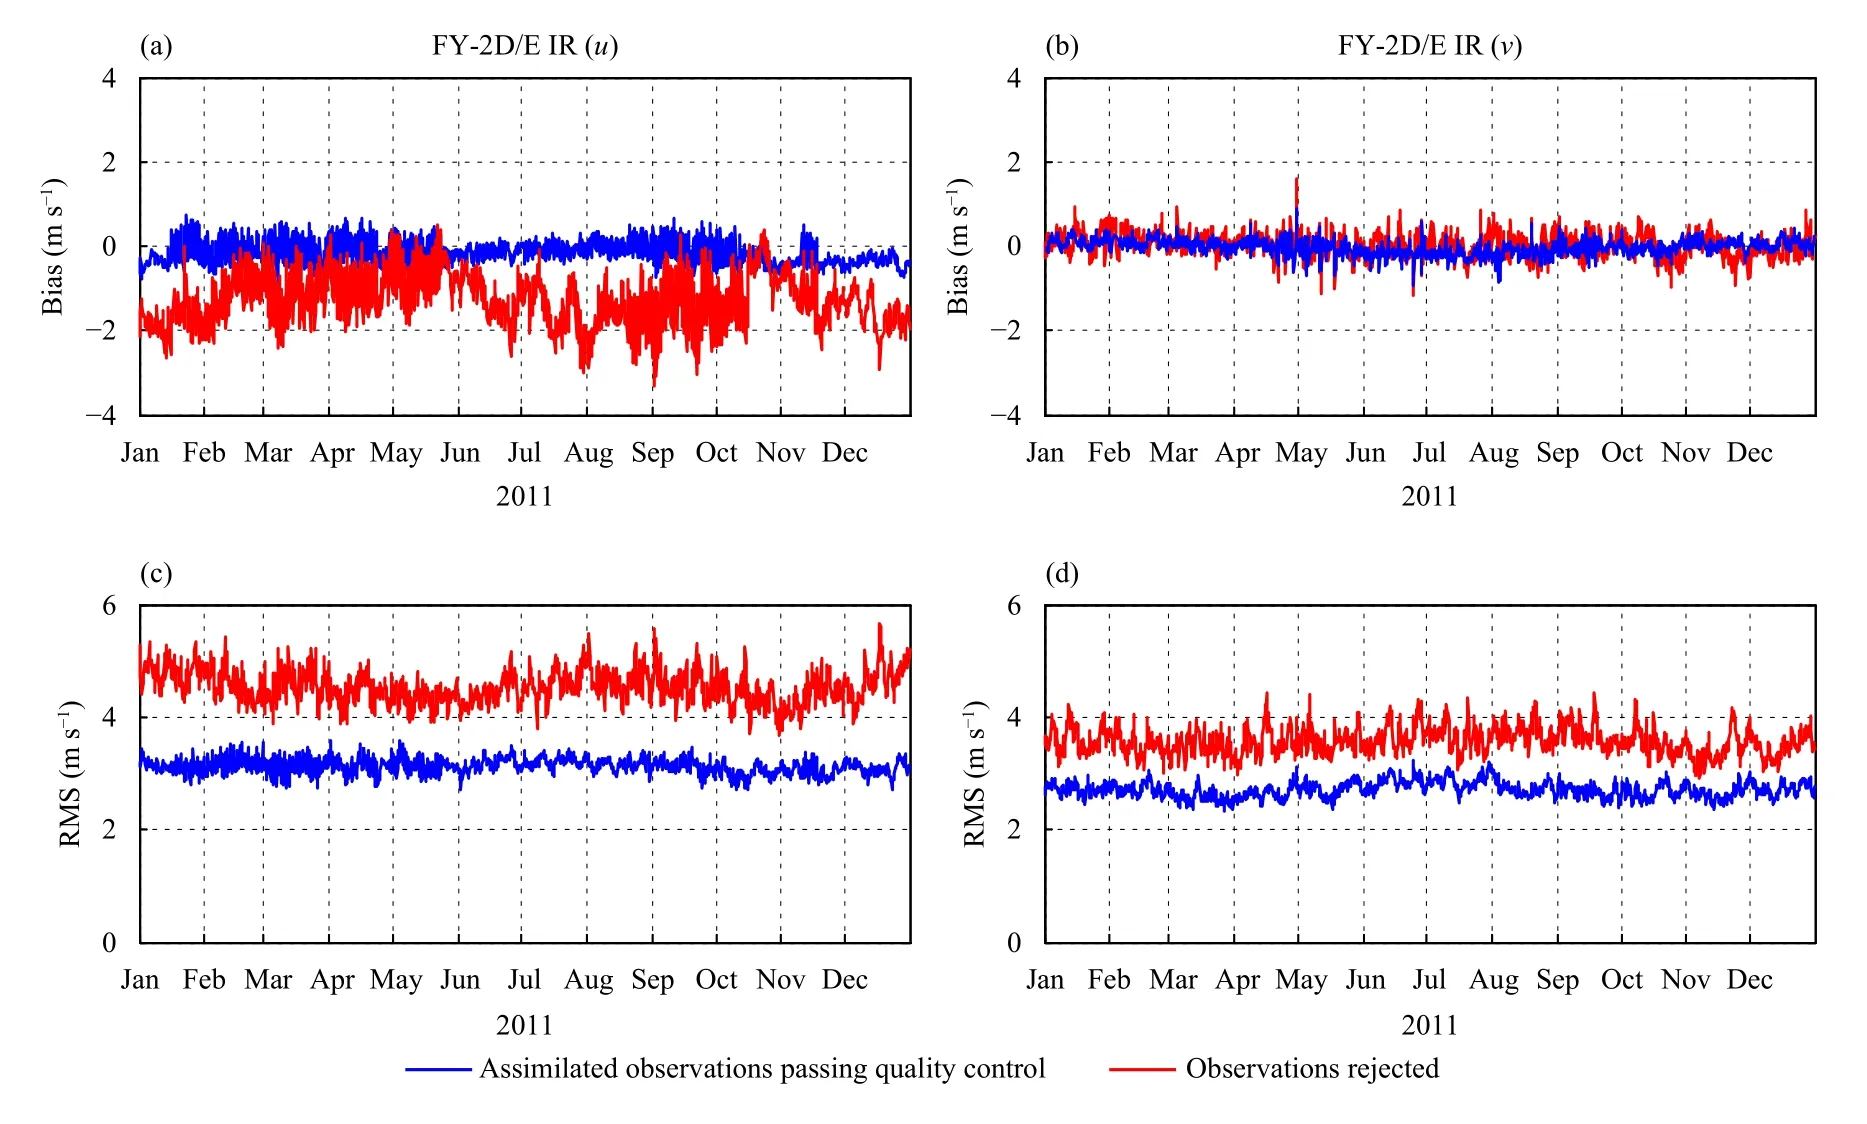
Fig. 5. Time series of mean OMA (a) u wind bias, (b) v wind bias, (c) u wind RMS, and (d) v wind RMS of the reprocessed FY-2D/E IR AMVs in 2011. OMA is observation minus analysis. The unit of wind speed is m s?1.

Fig. 6. Pre-evaluation comparison of the GMS-1 IR AMVs between the reprocessed (blue) and the CFSR_OBS (black) datasets against the ERA-Interim products for (a, b) number of observations, (c, d) bias, and (e, f) RMS. The unit of wind speed is m s?1.
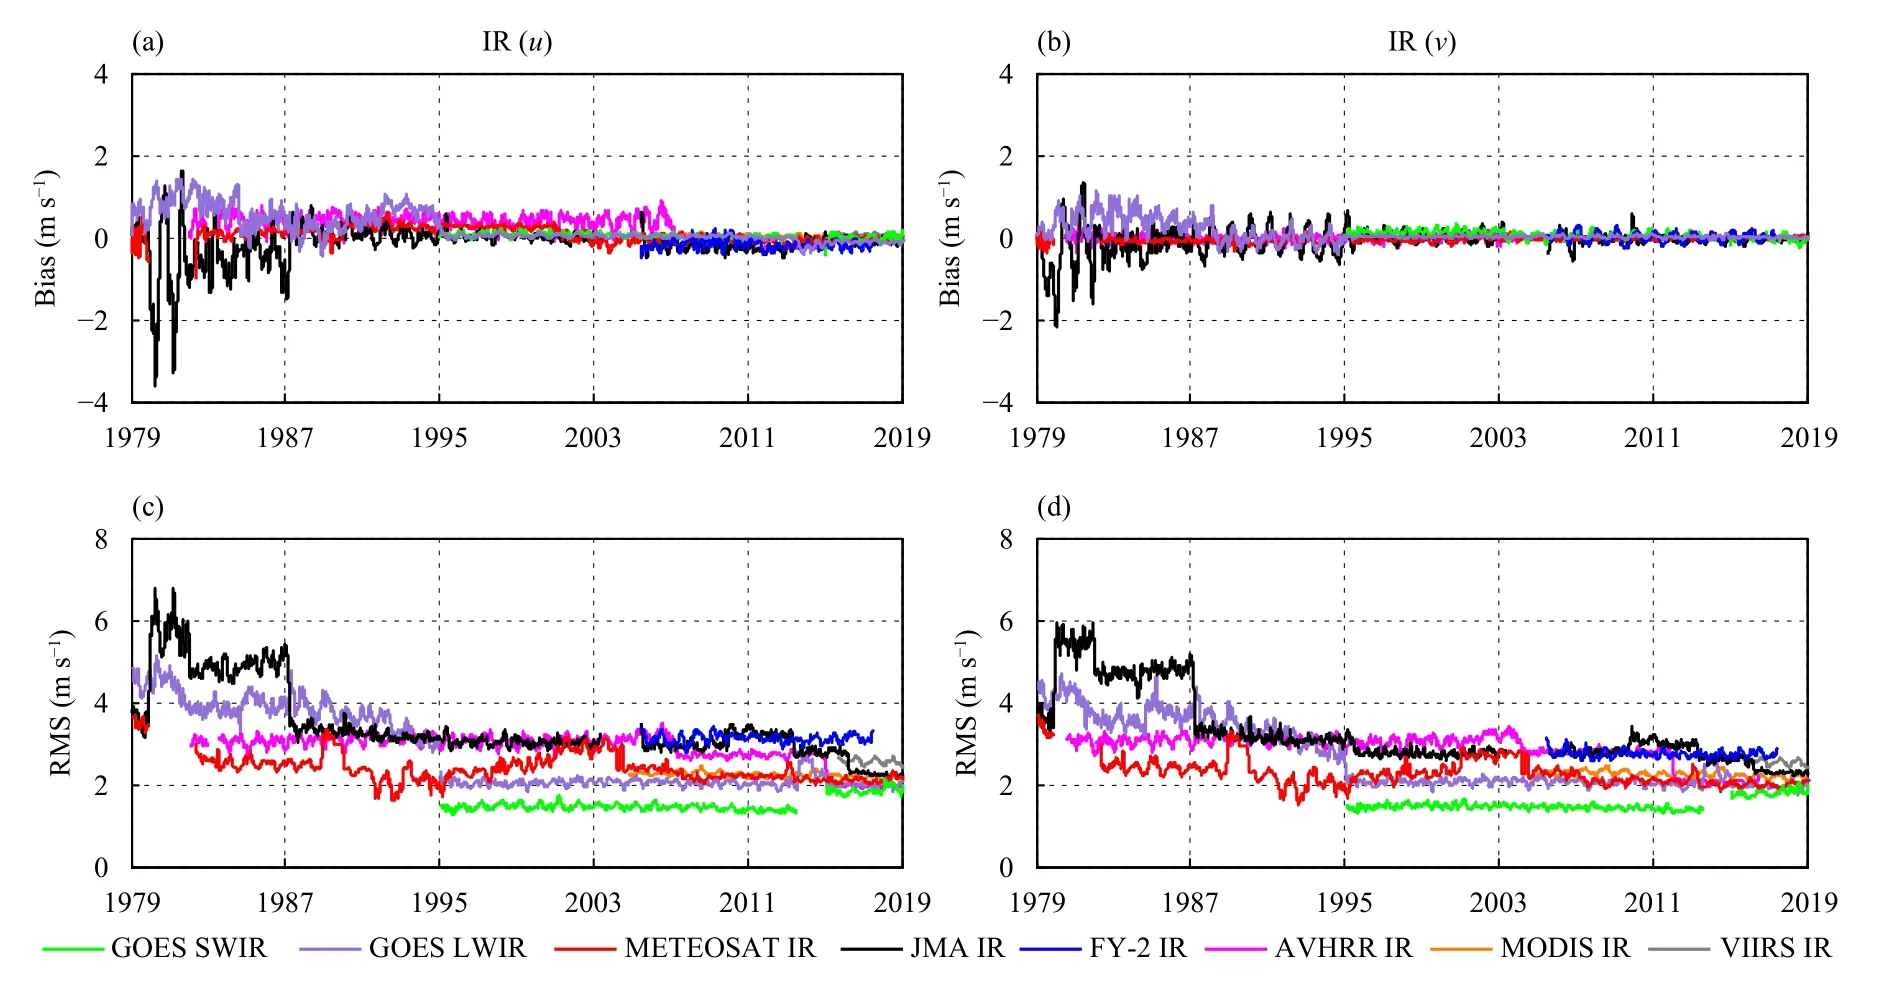
Fig. 7. Time series of the mean OMA (a) u wind bias, (b) v wind bias, (c) u wind RMS, and (d) v wind RMS of the GOES SWIR (green), GOES LWIR (purple), METEOSAT IR (red), JMA GMS/MTSAT/Himawari IR (black), and FY-2 IR (blue) AMVs and the NOAA/AVHRR IR(magenta), Terra and Aqua/MODIS IR (orange), SNPP/VIIRS IR (gray) polar winds assimilated in the CRA product. The unit of wind speed is m s?1.
As the result of artificial imperfect and late recognition, the GOES-9 AMVs from May 2003 to June 2005 are not assimilated in the new AMV archive. The satellite GOES-9 (nadir position 155°E) was used to replace the JMA’s operational satellite in this period, while its identification should be, but is not adjusted to the identifications of the JMA’s satellite series in the NCEP BUFR files. This problem is resolved in the preparation of the next generation of the CRA product.
4. Quality assurance
To improve the performance of the AMVs, the AMV fields are scrutinized using a stringent quality control procedure in the retrieval process. The AMV data assimilation quality control includes: (1) blacklisting observations; (2) applying quality indicator thresholds; (3) thinning the data; and (4) a background check. The AMV assimilation procedure and quality control configuration are incorporated in the GSI system. Table 4 gives the blacklist for the CRA application, including different categories of AMV type, space, satellite zenith, and quality indicator. The AMV quality indicator is usually in the range 0–100. For the AMVs from geostationary satellites, the AMVs with quality indicator values < 85 are rejected if the quality indicator is available. Data suppliers use different methods to summarize the consistency of the derived wind vectors compared with the winds in NWP models. Quality indicator values from methods without forecast dependence are selected. The AMVs are thinned to a lower horizontal resolution of 200 km × 200 km at 100 hPa (vertical) boxes to avoid overfitting. In the background check procedure in the GSI, AMVs are re-jected when a ratio (the quotient of the difference between the observation minus background and observation error) is larger than the gross check limit. The background is the 6-h forecast result from the previous time.Table 5 lists the AMV observation errors. The configurations of the observation errors are different for the different AMV types in different pressure layers. The same AMV assimilation procedure and quality control configuration as the NCEP GSI are adopted in the first generation of the CRA product. Minor updates on the quality control configuration are based on the pre-evaluation results. Improvements and updates are planned in the next generation of the CRA product.
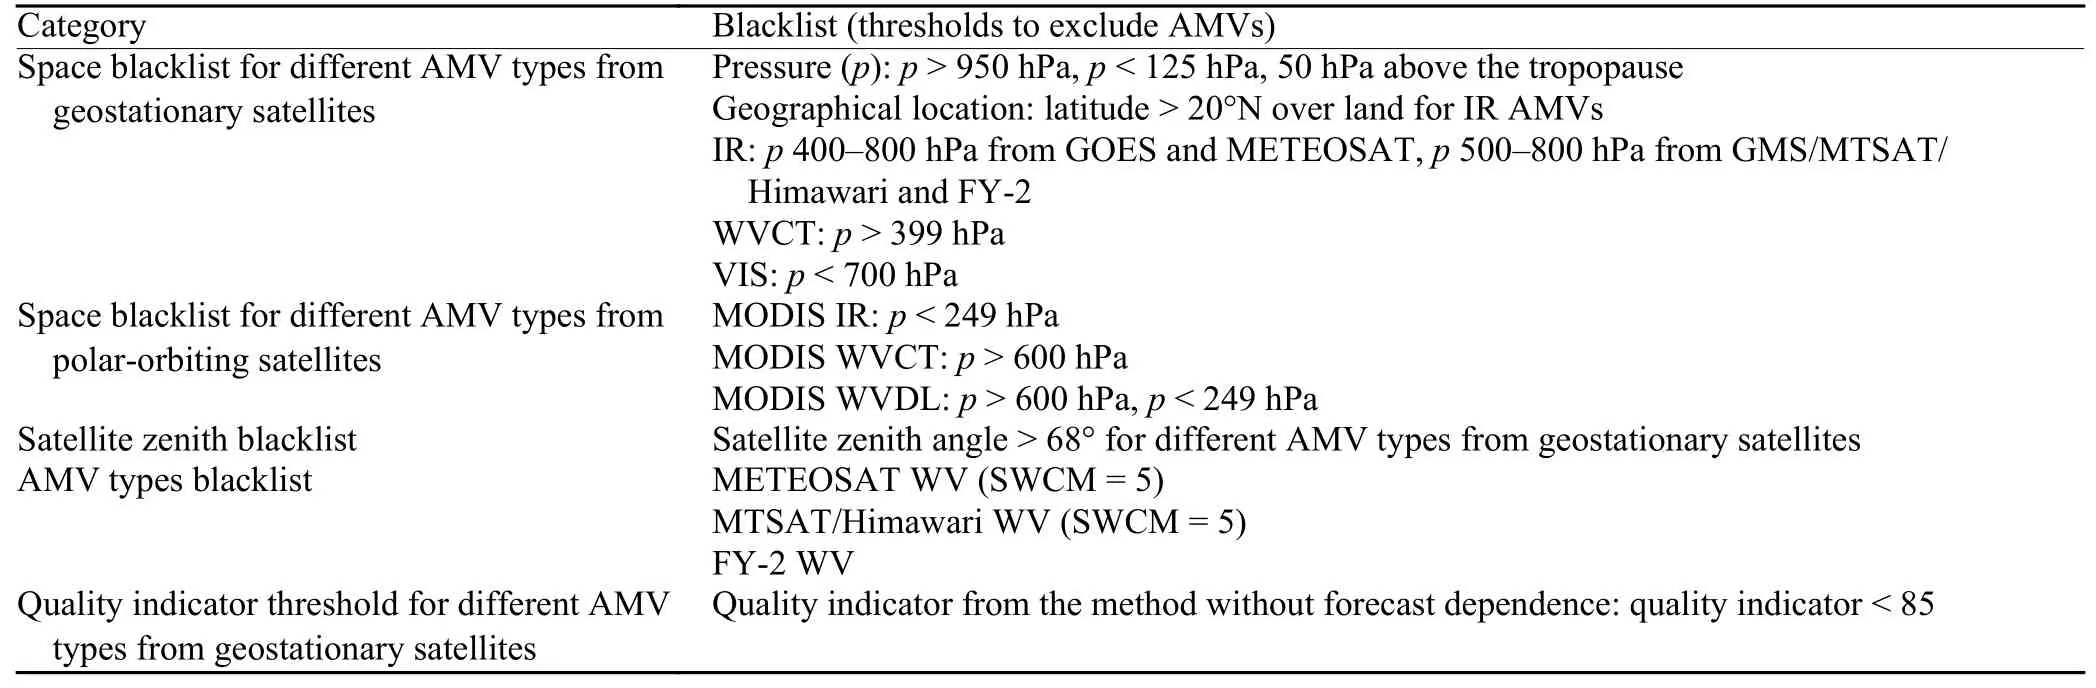
Table 4. AMV observation blacklist for the CRA product
Figure 4 shows the performance of AMVs passing and rejected by the quality control (QC) procedures for the reprocessed FY-2D/E IR AMVs assimilated in the CRA product in January and July 2011. The wind speed of the background is from the 6-h forecast result. The observations passing the quality control fall in the area near the diagonal line, whereas those rejected by the quality con-trol procedures are far away from this line and the rootmean-square (RMS) values of the observation minus background are larger. Theuwinds are mainly negative because the IR AMVs located north of 20°N over land are rejected (Table 4), so most of the AMVs passing the quality control procedures are easterly winds located in the northeast and southeast trade wind zones.
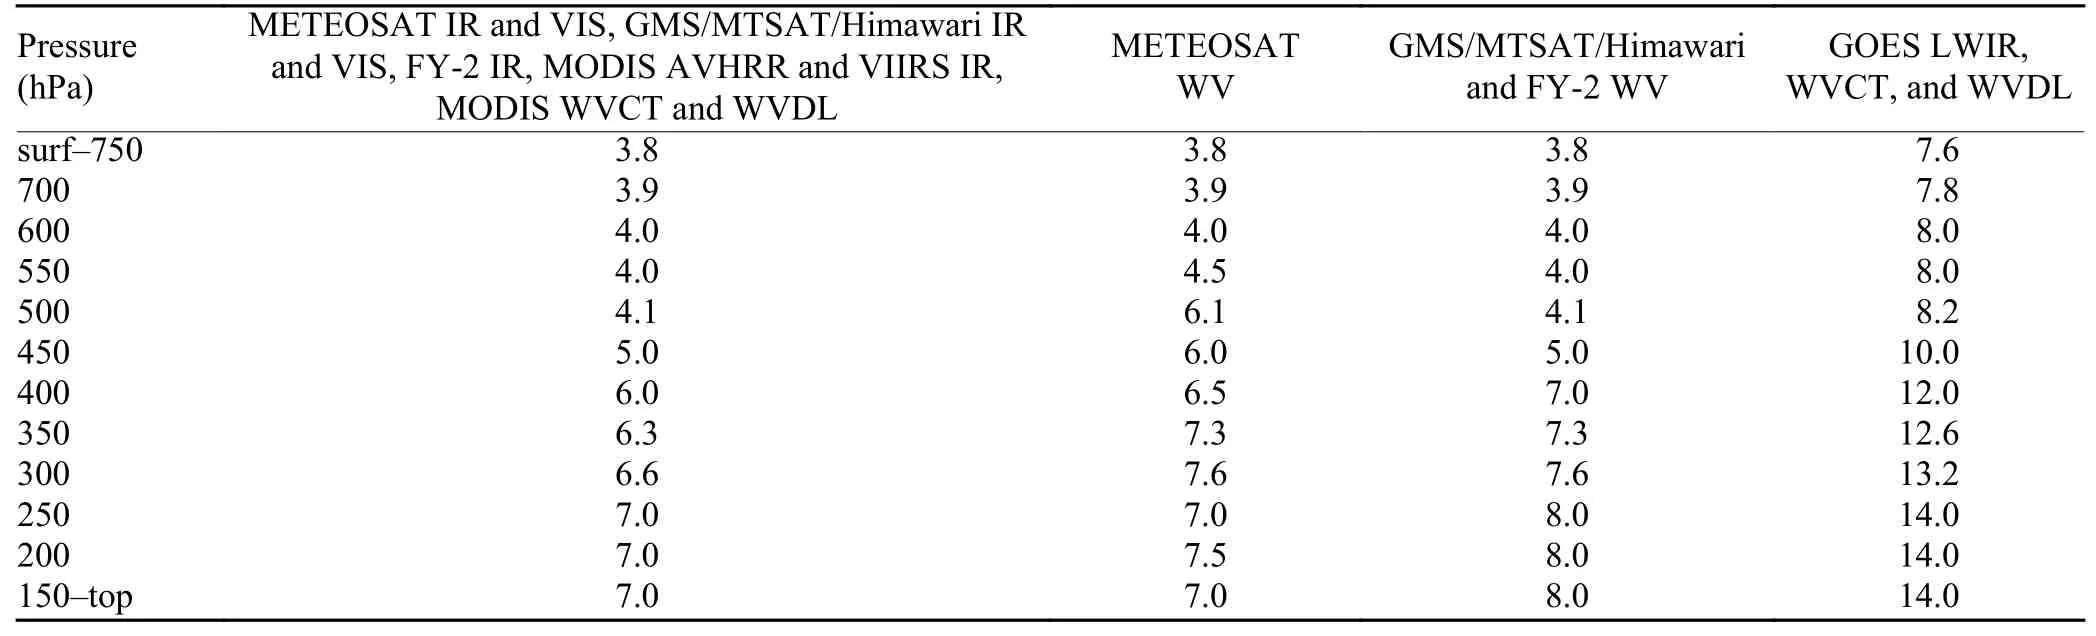
Table 5. AMV observation errors (m s?1) for the CRA product
Figure 5 shows the OMA time series of the bias and RMS for the assimilated and rejected FY-2D/E AMVs in 2011. Compared with the observations rejected, the bias and RMS of the observations passing quality control procedures are smaller and their time series are steadier.
5. Results
5.1 Data quality pre-evaluation
A pre-evaluation system based on the GSI data assimilation system and the ERA-Interim product has been developed by the CRA team to evaluate the data quality of the observations prepared for the CRA product. After the quality control and thinning procedures, the number of observations, the bias, and the RMS are calculated. The preliminary pre-evaluation diagnosis is applied for newly collected reprocessed AMV datasets and AMVs from the CFSR_OBS. Figure 6 shows the statistical results for the GMS-1 IR AMV wind speed before December 1979. The two assimilation time windows per day are 0000 and 1200 UTC. The number of reprocessed AMVs is 15.3 times more than the number of near real-time AMVs(Figs. 3c, 6a, 6b). The bias and RMS of the reprocessed AMVs are remarkably steadier and smaller than the near real-time AMVs (Figs. 6c–f). The pre-evaluation system has a crucial role in identifying the performance of the observations and avoiding the misuse of data with systematic quality issues.
Detailed pre-evaluation analyses are applied to the observations of all 18 AMV types in the new integrated AMV archive from 1979 to 2018. The statistical results are analyzed for different spatial ranges (including the global, the Northern Hemisphere, Southern Hemisphere,tropics, East Asia, and China) and different pressure levels vertically from 925 to 100 hPa. Great care is taken in the interpretation of statistical departures for any significant changes in the long time series. Pre-evaluation results are an important reference with which to update quality control configurations, so the AMVs with a poor performance or suspicious time series are added to the blacklists. Based on the results of several rounds of preevaluation and cyclical assimilation experiments, it is found that the new AMV archive can be used in the CRA product. Compared with the AMVs from the near realtime data, the reprocessed AMVs are denser horizontally and vertically and the time series are steadier.
5.2 Data use in the CRA product
The new AMV archive from 1979 to 2018 is assimilated in the CRA product. The assimilation feedback information is a manifestation of the application effect of the observational data in the reanalysis product. The statistical features of the assimilated AMVs are analyzed in this section, including: (1) the temporal variations of the bias and RMS of the OMA for the IR, WV, and VIS AMV wind speeds to reflect the continuity and magnitude (the curves in Figs. 7–12 are one-month running means); and (2) the vertical variation of the bias and RMS in different pressure layers to reflect the characteristics of the vertical distribution. The statistical results in these figures are from two assimilation time windows per day at 0000 and 1200 UTC for the IR and WV AMVs and from four assimilation time windows per day at 0000, 0600, 1200, and 1800 UTC for the VIS AMVs.
5.2.1IR AMVs
Figure 7 shows the time series of the bias and RMS for the assimilated IR AMVuandvwinds. The discontinuous variations for the different AMV types are mainly due to the integration of different data sources and the differences in data quality. The bias and RMS of the GMS-1/2/3 AMVs (December 1979–February 1987),the GOES AMVs (before 1995), and the METEOSAT AMVs (before November 1979, short periods during 1988–1993, and from January 2001 to February 2004)are larger for the unique source in the near real-time data.The variations in the magnitude of the bias and RMS are greater due to fewer observations and the unavailability of the AMV quality indicator in earlier years. Compared with the reprocessed MFG AMVs from May 1982 to January 2001, the bias and RMS of the reprocessed MSG AMVs from March 2004 to December 2012 are smaller and the time series are steadier. With the same AMV assimilation strategy, the RMS of the FY-2 IR AMVs is slightly smaller or equivalent to the RMS of GMS/MTSAT/Himawari AMVs (Figs. 7c, d). The time series of the RMS for the MODIS and VIIRS IR polar winds are comparably steady, whereas there are more discontinuities for the MetOp and NOAA AVHRR IR polar winds in different time periods. The mean RMS values of the IR AMVs from the geostationary and polar-orbiting satellites for the whole time series are 1.5–3.4 and 2.2–2.9 m s?1,respectively.
Figure 8 shows the vertical profiles of the bias and RMS for the assimilated IR AMVuandvwinds. The AMVs derived from the IR and SWIR satellite images typically capture flow features in both the upper and lower troposphere. The AMV observation blacklist for the IR AMVs at midlevels is applied as in Table 4 considering the larger uncertainties in the assignment of height (Su et al., 2012). The assimilated IR AMVs from the geostationary satellites are therefore focused at high and low levels (150–450 and 800–950 hPa). The vertical distributions of the bias and RMS in Fig. 8 are similarly found for the METEOSAT AMVs (Delsol et al., 2008;Salonen and Bormann, 2016) and the MTSAT AMVs(Oyama, 2010). The RMS of the FY-2 IR AMVs is smaller at 200–450 hPa than the MTSAT/Himawari AMVs.The assimilated VIIRS polar winds are more than the MODIS and AVHRR polar winds, especially at 300–500 hPa, as a result of the denser observations at this height.The bias and RMS of the winds at lower levels are smaller than those of the midlevel and high-level winds.
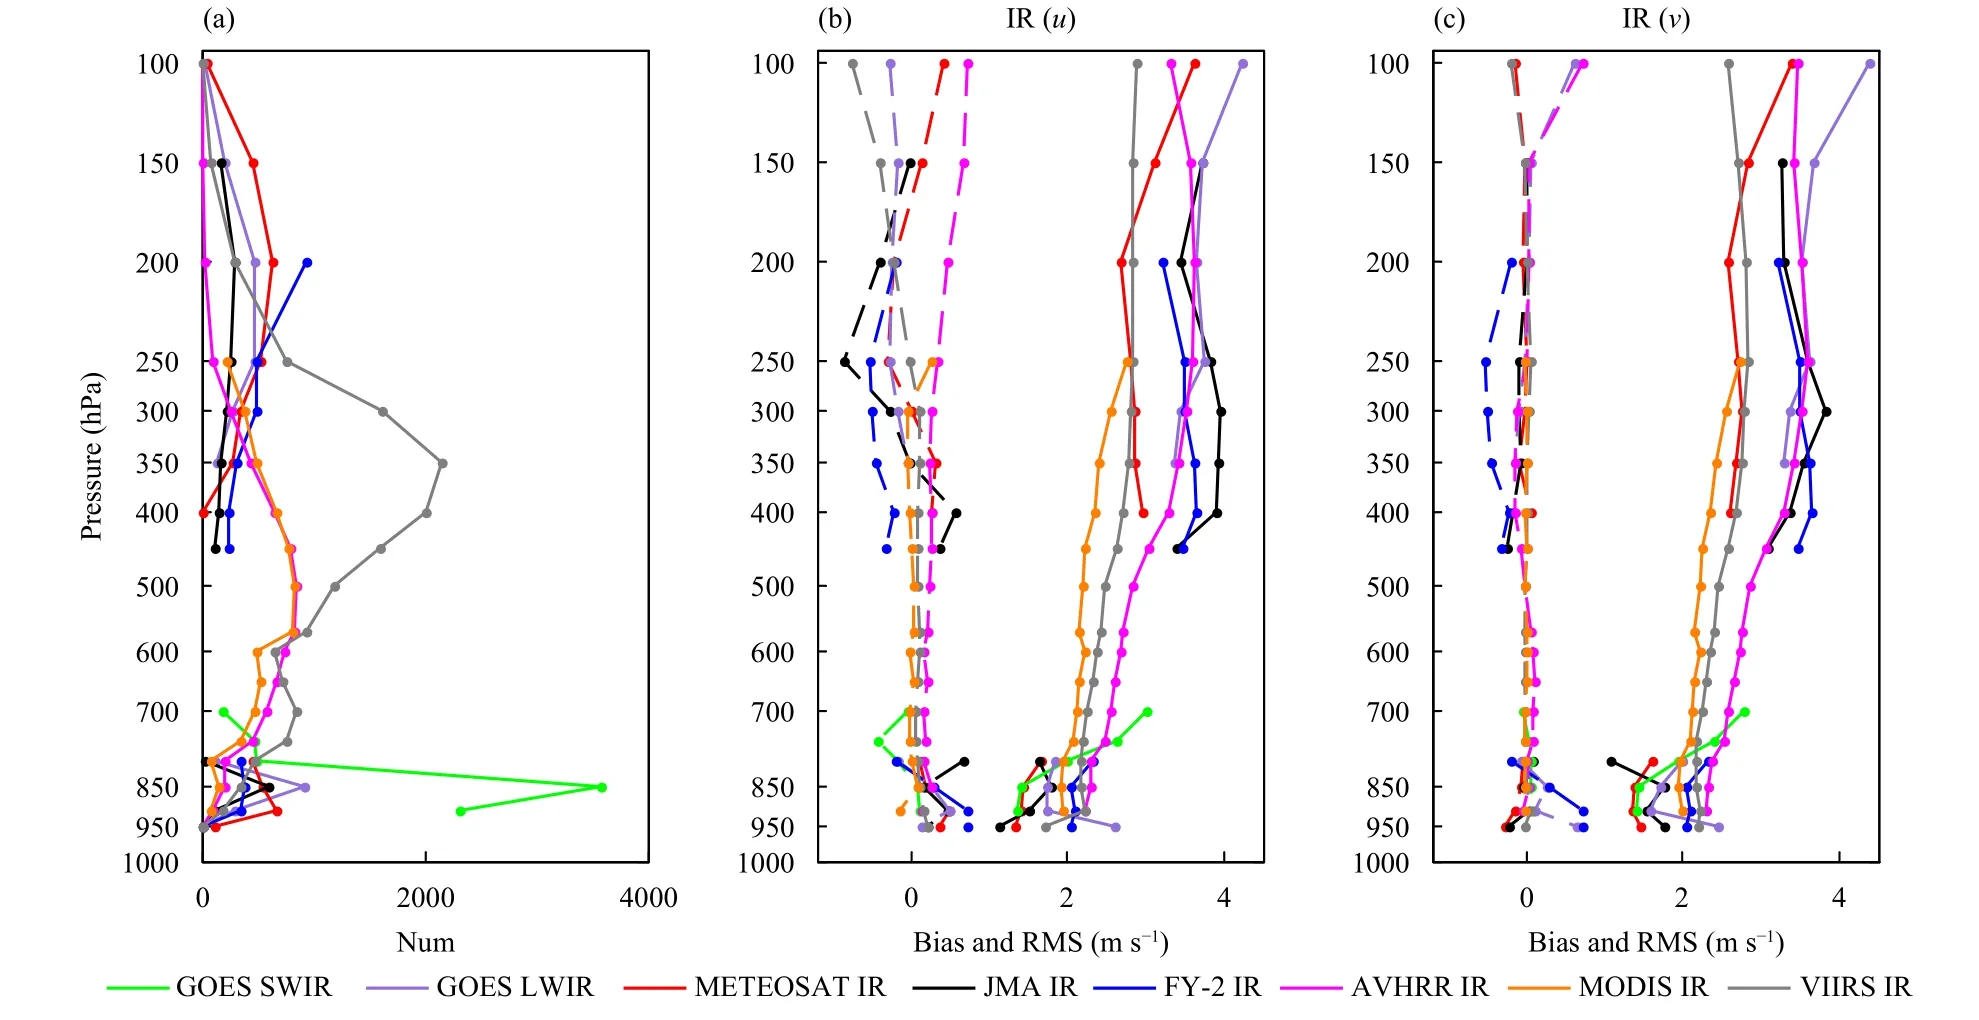
Fig. 8. Profiles of (a) the mean number of observations, (b) the OMA u wind bias (dotted lines) and RMS (solid lines), and (c) the v wind bias(dotted lines) and RMS (solid lines) of the GOES SWIR (green), GOES LWIR (purple), METEOSAT IR (red), JMA GMS/MTSAT/Himawari IR (black), and FY-2 IR (blue) AMVs and the NOAA/AVHRR IR (magenta), Terra and Aqua/MODIS IR (orange), SNPP/VIIRS IR (gray)AMVs assimilated in the CRA product. The unit of wind speed is m s?1.
5.2.2WV AMVs
Figure 9 shows the time series of the bias and RMS for the assimilated WV AMVuandvwinds. The METEOSAT, GOES, and GMS/MTSAT/Himawari WV AMVs have been available since May 1982, May 1995,and June 1995, respectively. The METEOSAT WV AMVs are not available for December 1988–November 1989, March 1992–January 1993, and December 2002–February 2004 (Fig. 3e). Larger seasonal variations are found in the MTSAT-1R/2 WVvwind speed bias, especially from June 2005 to March 2016 (Fig. 9b). Our feedback on data quality has been sent to the data supplier.The mean RMS of the WV AMVs from the geostationary and polar-orbiting satellites for the whole time series are 2.7–3.6 and 2.2–2.3 m s?1, respectively.
Middle to upper tropospheric WV AMVs features with sharp radiance gradients are tracked in cloud-free scenes using satellite images derived from WV-sensitive spectral bands. The assimilated WV AMVs from the geostationary satellites are therefore focused at high levels(Fig. 10) according to the AMV observation blacklist(Table 4). The numbers of assimilated METEOSAT WV and GOES WVCT AMVs are more than the numbers of assimilated GMS/MTSAT/Himawari WV and GOES WVDL AMVs (Fig. 10a) as a result of the AMV densities (Figs. 3e, f) related to the spatial resolution, retrieval algorithms, and data quality of the AMV assimilation configurations. The assimilated MODIS WVCT and WVDL polar winds are focused at mid and high levels around 350–500 hPa.
5.2.3VIS AMVs
Figure 11 shows the time series of the bias and RMS for the assimilated VIS AMVsuandvwinds from geostationary satellites. The GOES VIS AMVs have been available since 1995. As a result of the unsteady data quality of the near real-time data from the GTS, there is an obvious negative bias of theuwind speed (Fig. 11a)and a larger RMS of theuandvwind speeds (Figs. 11c,d) around 2.52–2.63 m s?1from September 2013 to July 2014 for the GOES VIS AMVs. The mean RMS of the VIS AMVs is 1.3–2.1 m s?1.
The AMVs derived from images in the visible channel generally track cumuliform cloud motion in the lower troposphere, so the assimilated VIS AMVs focus at lower levels around 800–900 hPa according to the AMV observation blacklist (Fig. 12). The number of assimilated GOES VIS AMVs is more than the number of assimilated METEOSAT and GMS/MTSAT VIS AMVs (Fig.12a) because more observations are available in the reprocessed datasets (Figs. 3g–i). The bias and RMS of the VIS AMVs tend to increase linearly with height (Figs.12b, c).
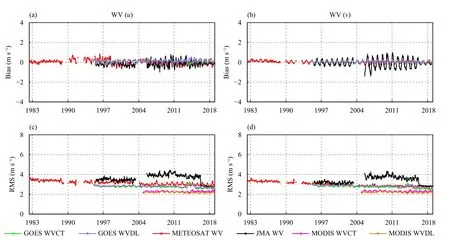
Fig. 9. Time series of the mean OMA (a) u wind bias, (b) v wind bias, (c) u wind RMS, and (d) v wind RMS of the GOES WVCT (green),GOES WVDL (purple), METEOSAT WV (red), and JMA GMS/MTSAT/Himawari WV (black) AMVs and the Terra and Aqua/MODIS WVCT(magenta) and WVDL (orange) polar winds assimilated in the CRA product. The unit of wind speed is m s?1.
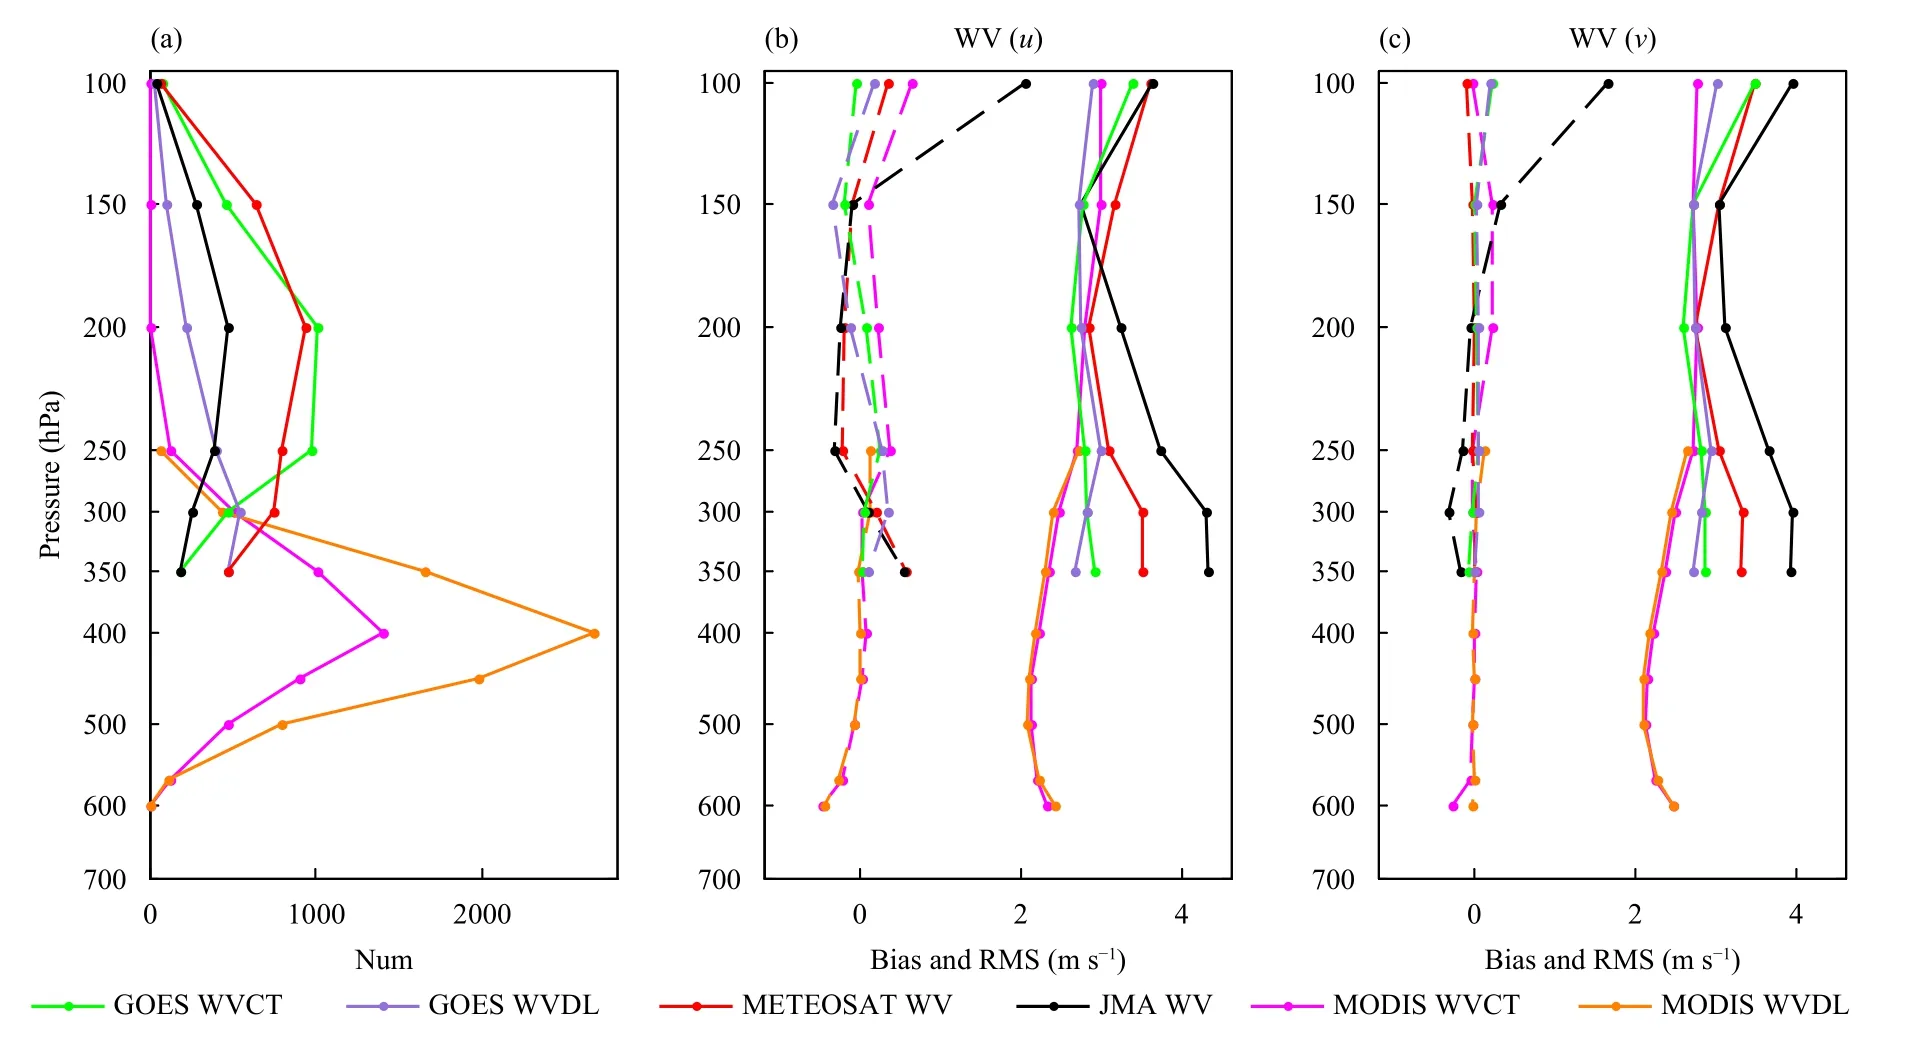
Fig. 10. Profiles of (a) the mean number of observations, (b) the OMA u wind bias (dotted lines) and RMS (solid lines), and (c) the OMA vwind bias (dotted lines) and RMS (solid lines) of the GOES WVCT (green), GOES WVDL (purple), METEOSAT WV (red), and JMA GMS/MTSAT/Himawari WV (black) AMVs and the Terra and Aqua/MODIS WVCT (magenta) and WVDL (orange) WV AMVs assimilated in the CRA product. The representativeness of colored lines for different satellite series are the same as Fig. 9. The unit of wind speed is m s?1.

Fig. 11. Time series of the mean OMA (a) u wind bias, (b) v wind bias, (c) u wind RMS, and (d) v wind RMS of the GOES (green), METEOSAT (red), and JMA GMS/MTSAT/Himawari (black) VIS AMVs assimilated in the CRA product. The unit of wind speed is m s?1.
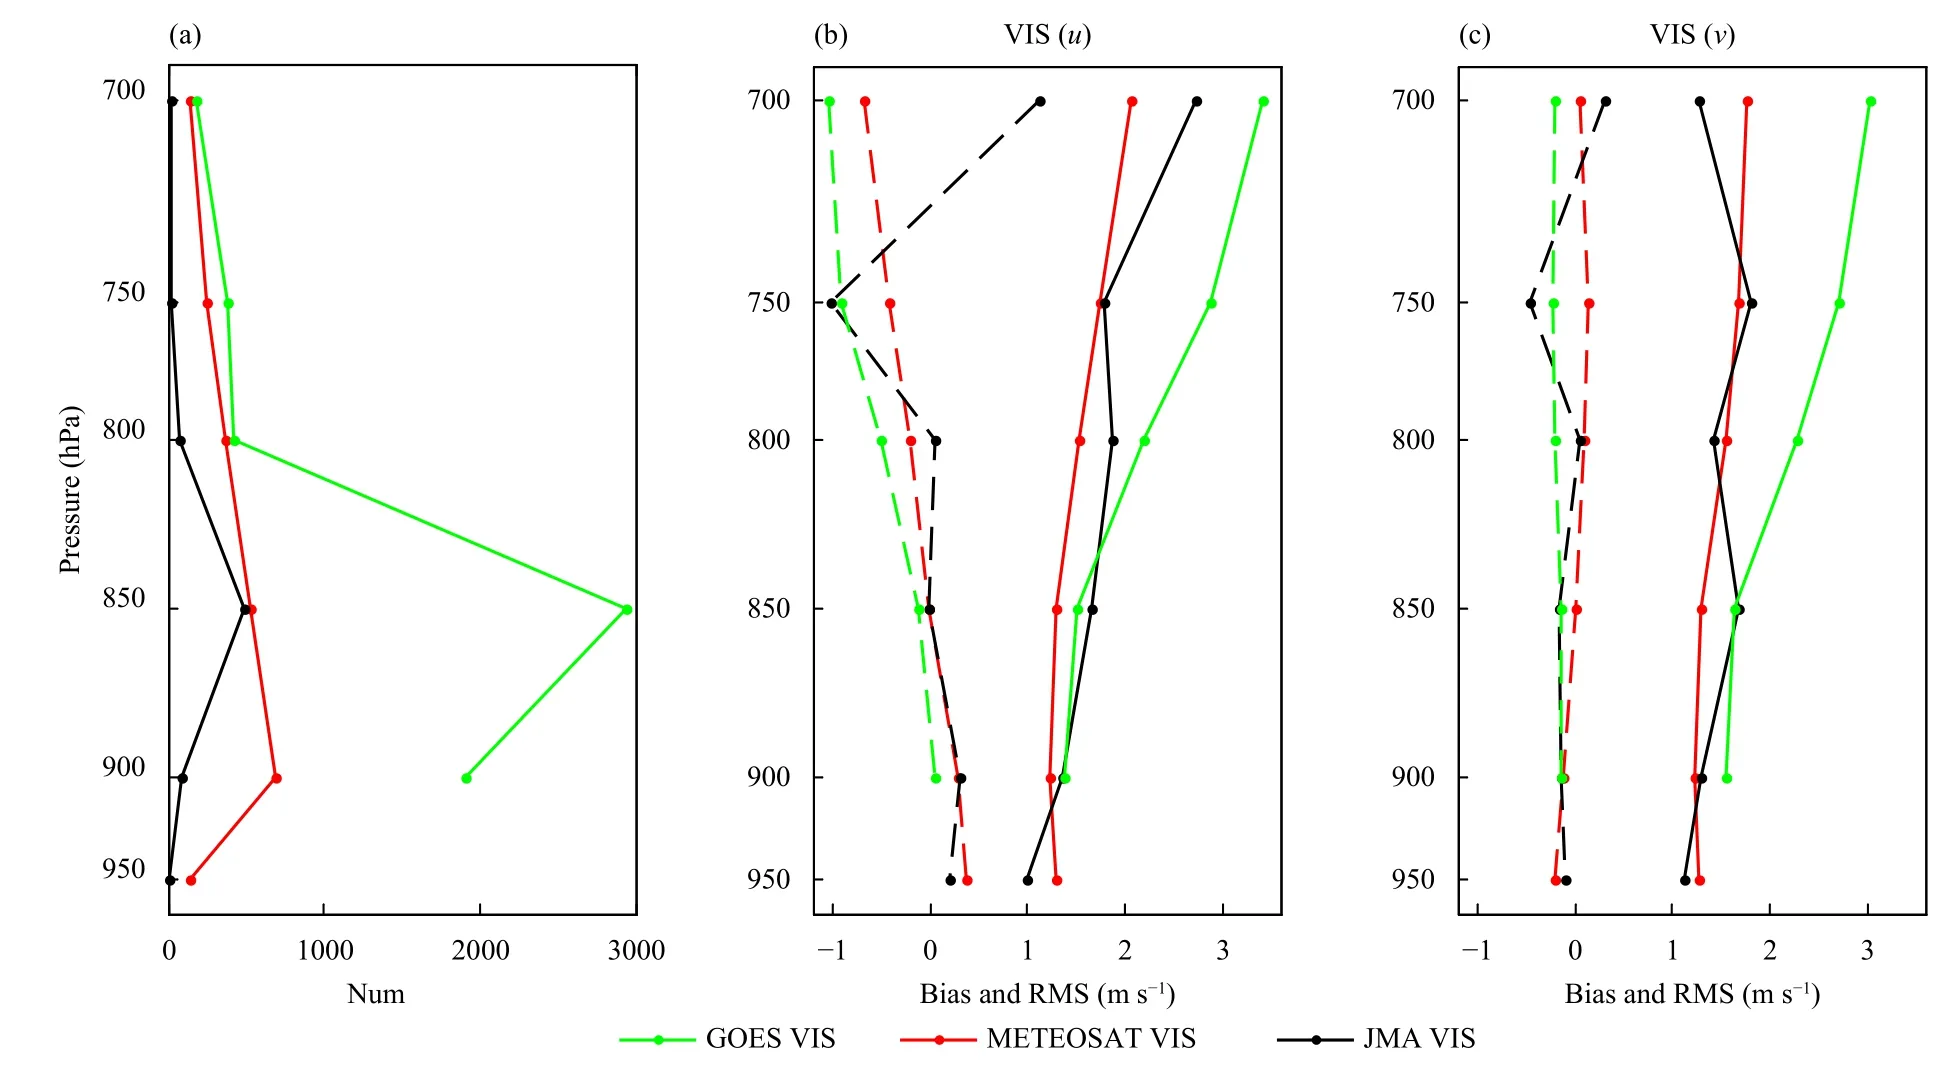
Fig. 12. Profiles of (a) the mean number of observations, (b) the v wind bias (dotted lines), and (c) the RMS (solid lines) of the GOES (green),METEOSAT (red), and JMA GMS/MTSAT/Himawari (black) VIS AMVs assimilated in the CRA product. The unit of wind speed is m s?1.
6. Summary and perspective
This paper describes the pre-processing, quality assurance, and use of global AMV observations in the CRA product, highlighting the integration, pre-evaluation, and assimilation of the data. The AMV observations from different data sources are integrated into a new AMV archive involving 54 geostationary and polar-orbiting satellites from 1979 to 2018. The priority of the reprocessed datasets is higher than those of the near real-time operational GTS data, including GDAS_OBS and CFSR_OBS data. The new AMV archive has a higher level of completeness and integrity, and the time series are steadier with a smaller bias and RMS, than the near realtime data. The AMV archive includes newly released or recently produced reprocessed AMVs from GOES-8/9/10/11/12/13/14/15, METEOSAT-8/9/10/11, FY-2C/D/E/G, and NOAA-7/9/10/11/12/14/15/16/17/18/19andMetOp-Asatellites. The new AMV types of the GOES SWIR, GOES WVDL, and FY-2 IR and WV have been added. Compared with the near real-time data, the time series of the reprocessed GOES WVCS AMVs and AVHRR IR polar winds are longer. The number of reprocessed AMVs is 3.5 to several dozen times more than the number of AMVs from the CFSR_OBS. The new AMV archive is suitable for a wide range of applications,such as comparisons with winds from radiosondes or other observing systems and climate change research to improve our understanding of variations in the characteristics of atmospheric winds.
After investigating the quality of the data from the new AMV archive for the CRA product via a pre-evaluation system based on the GSI and ERA-Interim products, the features of the bias and RMS of theuandvwind speeds are summarized. The new AMV archive is assimilated in the CRA product based on the NCEP GSI assimilation procedure and quality control configuration with reference to the pre-evaluation results. The mean RMS of the OMA for the IR, WV, and VIS AMVs from the geostationary satellites are 1.5–3.4, 2.7–3.6, and 1.3–2.1 m s?1, respectively, and the mean RMS of the IR and WV AMVs from the polar winds are 2.2–2.9 and 2.1–2.2 m s?1, respectively. Compared with mid- and high-level winds, the bias and RMS for the IR AMVs are smaller at low levels. This is the first time reprocessed FY-2 IR AMVs from June 2005 to July 2017 have been assimilated in a reanalysis product. The RMS is slightly smaller or equivalent to that of the GMS/MTSAT/Himawari data. The assimilation features inspire confidence in the accuracy and stability of the AMV observations.
A lot of valuable experience has been obtained in the preparation of the first generation of the CRA product.Some imperfections in the integration and assimilation are temporarily not resolved well due to limited time and resources. It is planned to improve the application of AMV observations further in the next generation of reanalysis product using better assimilation technologies,such as updating the observation blacklist and the observation error configurations, and improvements on coordination with NWP model.
Acknowledgments.The reprocessed AMV datasets were released or produced by EUMETSAT, UWCIMSS, JMA/MSC, and CMA/NSMC.
 Journal of Meteorological Research2022年6期
- Journal of Meteorological Research的其它文章
- Record Flood-Producing Rainstorms of July 2021 and August 1975 in Henan of China:Comparative Synoptic Analysis Using ERA5
- Interdecadal Variability of Summer Precipitation in Northwest China and Associated Atmospheric Circulation Changes
- A New Hybrid Machine Learning Model for Short-Term Climate Prediction by Performing Classification Prediction and Regression Prediction Simultaneously
- Surface Weather Parameters Forecasting Using Analog Ensemble Method over the Main Airports of Morocco
- Impacts of the Urban Spatial Landscape in Beijing on Surface and Canopy Urban Heat Islands
- Effect of Using Land Use Data with Building Characteristics on Urban Weather Simulations: A High Temperature Event in Shanghai