
Plot investigation on rill flow resistance due to path tortuosity
2023-03-22 03:45FrncescoCrolloCostnzDiStefnoAlessioNicosiVincenzoPlmeriVincenzoPmploneVitoFerro
Frncesco G.Crollo , Costnz Di Stefno , Alessio Nicosi , Vincenzo Plmeri ,Vincenzo Pmplone , Vito Ferro ,b,*
a Department of Agricultural, Food and Forest Sciences, University of Palermo, Viale delle Scienze, Building 4, 90128, Palermo, Italy
b NBFC, National Biodiversity Future Center, 90133, Palermo, Italy
Keywords:Rill erosion Tortuosity Rill morphology Friction factor Rill flow resistance
A B S T R A C T The path tortuosity t is an indicator of rill morphology accounting for the deviation of the thalweg from a straight alignment.The effect of t on flow resistance has been little investigated for rills.This paper reports the results of a plot investigation aimed to establish the suitable accuracy of the rill thalweg measurement to determine the tortuosity parameter and to test the reliability of a theoretical flow resistance law.Four rills were incised in clay soil (CS) and clay-loam soil(LS)and shaped by a clear flow discharge.The three-dimensional Digital Terrain Models were created by the Structure from Motion technique.For rills on LS, an approximate thalweg was tracked by photo-interpretation, and a specific calculation routine was applied to identify the cross sections with a constant spacing d.The actual rill thalweg was obtained as the line joining the lowest points of these cross-sections.Among the different tested d values,d=0.075 m was chosen to determine t.For both CS and LS,the Darcy-Weisbach friction factor f featured a non-monotonic relation with t, which was explained as the result of three additive components due to bed roughness, sediment transport, and localized energy losses due to curves.The effect of the former two components on f contrasts that of the third,resulting in a linearly decreasing f-t relationship and constant flow velocity for the three lowest tortuosity values, and an increased friction factor and reduced flow velocity for the highest tortuosity value.The flow resistance law was positively tested, and the predicted friction factor was dependent on t.
1.Introduction
Soil erosion is a critical problem worldwide, and the rill component is often dominant as compared with the interrill one(Bagarello&Ferro,2004;Bruno et al.,2008;Di Stefano et al.,2013,2017a,2022;Liu et al.,2011;Rejman&Brodowski,2005;Yang et al.,2006), thereby investigations on rill erosion are pivotal to developing or testing prediction models.Modelling rill erosion necessarily requires predicting of flow-hydraulic parameters such as mean flow velocity, V (Di Stefano et al., 2021; Nicosia et al., 2021)and hydraulic radius,and a model which uses these parameters to simulate sediment detachment and transport.
Channelized flow in numerous soil erosion models is computed by uniform flow equations, such as Darcy-Weisbach, Manning, or Chezy's (Gilley et al., 1990; Strohmeier et al., 2014), designed for river scale hydraulics(Govers et al.,2007).For example,the Darcy-Weisbach friction factor is applied in WEPP (Water Erosion Prediction Project) (Ferro & Nicosia, 2020; Foster et al.,1995; Govers et al., 2007).These flow resistance equations apply to turbulent and uniform open-channel flow (Chow,1959) from which the rill flow can deviate because of the geometrical scale, interactions between rill flow, soil erosion, and sediment transport on eroding rills(Nearing et al.,1997),and flow path tortuosity.The latter is an indicator for a quantitative description of rill morphology and represents the deviation of the thalweg from a straight channel alignment (Strohmeier et al., 2014).
Currently, a shared definition of rill tortuosity is still missing.Strohmeier et al.(2014) conducted steady-state experiments in a flume with a 10% slope on rills incised in loam soil with 32% sand,49%silt,and 19%clay.A flume reach,with a length of 128 cm,was the ‘control section’ of rill morphological analyses, and rill flow path tortuosity was defined by the relation of the rill flow path length and the shortest connection of the control section.The tortuosity parameter was calculated based on top-view images of the flume by two-dimensional tracking of the mass center of a dye tracer in the flow, neglecting vertical channel bed irregularities.Shen et al.(2015) defined a morphological parameter, named rill tortuosity complexity, as the ratio of the total length of a rill and its bifurcations to the length along the maximum slope direction.They examined the effects of simulated rainfall intensity on rill network development and presented some rill morphological indicators.After the end of rainfall, the rill network was manually mapped with photographs of the soil pan surface.Shen et al.(2019) found that a greater rill tortuosity complexity favored sidewall collapse erosion and led to a greater rill width-depth ratio.
Although experiments(e.g.,Khatua et al.,2011;Moharana et al.,2013) have been performed to investigate the effect of the path shape on flow resistance for meandering channels, the literature lacks experiments studying this effect for rills.This is a limit to overcome since rills naturally formed in fields can be characterized by a degree of tortuosity that can be relevant,as an example,where there is sparse and unevenly arranged vegetation (i.e., shrubs).In this case, vegetation naturally directs runoff between plants since the soil supporting vegetated patches is often elevated compared to the surrounding area (Nouwakpo et al., 2016).Since 1984, many experimental investigations have been carried out to establish predictive relationships of rill flow velocity(Di Stefano et al.,2022)but, to the best of our knowledge, the single investigation by Strohmeier et al.(2014)dealt with the effect of rill tortuosity on rill roughness, which was expressed by the Manning-Strickler coefficient kst, and flow resistance.Their experiments were carried out using two discharge values (0.145 and 0.170 L s-1) for both Free Developed Rills(FDR,unconstrained rill erosion on a plane soil bed)and Straight Constrained Rills(SCR,concentrated flow erosion in a prepared straight initial rill).The rill flow path tortuosity of FDR experiments varied from 1.051 to 1.109, while that of SCR experiments was always close to 1.000 (1.000-1.017).
The following theoretical rill flow resistance law, based on the integration of a power velocity distribution,was recently proposed(Carollo et al., 2021; Di Stefano et al., 2017a)
in which f is the Darcy-Weisbach friction factor, δ = 1.5/ln Re(Barenblatt,1991;Castaing et al.,1990),Re is the Reynolds number,and Γ is the velocity profile parameter.The experimental Γ value,Γv, can be expressed as follows (Di Stefano et al.,2017a):
where u* = (gRs)0.5is the shear velocity, g is the gravity acceleration,R is the hydraulic radius,s is the slope steepness,α=0.124(Di Stefano et al., 2017a), h is the water depth, and ν is the water kinematic viscosity.The Γvparameter can be estimated by the following power equation:
in which F is the Froude number,and a,b and c are coefficients to be determined by the available measurements.Eq.(3) was calibrated using measurements performed exclusively in straight rill channels, and for different conditions of rill bed (flat, step pool) and sediment transport (fixed and mobile bed rills) (Di Stefano et al.,2022).Introducing Eq.(3) into Eq.(1) results in:
Under the condition of a tortuous rill,flow cannot be uniform.In this condition, the flow structure is more complex than that of flows in straight channels since it is characterized by velocity components in all three directions.For this reason,calibrating and testing the reliability of flow resistance equations developed for straight rill channels, such as Eq.(4), requires specific measurements.
In this paper,the rill tortuosity t is defined as the ratio between the actual thalweg length and the minimum (straight) length,measured between its bounding sections,somewhat following the definition by Strohmeier et al.(2014).Considering that the rill length has an evident fractal nature,the tortuosity value is affected by the adopted accuracy level of the measurement technique.Furthermore, the measured value of the actual rill length directly affects the flow velocity measurement by the dye-tracing method(Nicosia et al., 2021) and, thereby, is pivotal to the rill flow resistance studies.
This paper reports the results of a plot investigation aiming to assess the effect of rill tortuosity on flow resistance.The experiments extended the range of the tortuosity values investigated by Strohmeier et al.(2014).The analysis was initially performed to establish the suitable accuracy of the rill thalweg measurement to determine t and to be used for the subsequent hydraulic analysis.
2.Materials and methods
The experiments were carried out on two plots, 2 m wide and 7 m long, located in the experimental area of the Department of Agriculture,Food and Forest Sciences of the University of Palermo.A plot was filled with clay loam soil(LS)(32.7%clay,30.9%silt,and 36.4%sand)to a slope of 18%.The other plot was filled with clay soil(CS) (62% clay, 26.4% silt, and 11.6% sand) to a slope of 11%.
In each plot, four mobile bed rills were manually incised to obtain four different values of tortuosity,approximately equal to 1(straight rill), 1.08, 1.16, and 1.30 (Fig.1).The rills were initially shaped by a low clear flow discharge (Q = 0.1 L s-1) and then,during the experimental runs, by a constant inflow discharge Q = 0.24 L s-1.
For establishing the rill channel geometry and determining the actual tortuosity value, after the experimental run, the threedimensional Digital Terrain Model (3D-DTM) was created using a set of about 70 photographs taken from the plot area by a digital camera.These images were captured assuring that all parts of the measured plot area were represented in at least three photographs,since the 3D algorithm is designed to work with convergent images.The image-processing software Agisoft Photoscan Professional was used for obtaining the 3D model by an automatic process that couples the Structure from Motion (SfM) and MultiView-Stereo techniques (Di Stefano et al., 2022).
Firstly, an approximate rill thalweg was tracked by photointerpretation.Then, applying a specific calculation routine, the cross-sections, perpendicular to this rill thalweg and with a constant spacing d,were identified,and the lowest point of each crosssection was determined.For a given rill,the actual rill thalweg was obtained as the line joining these points,both considering only the planimetric coordinates(x,y)(thalweg 2D)and also the elevation z(thalweg 3D)to evaluate the effect of thalweg slope changes on the tortuosity.The corresponding tortuosity was indicated as t2Dand t3D, respectively.

Fig.1.View of the rill channels with different tortuosity values for LS.
Each rill channel was divided into nine longitudinal segments bounded by ten transects perpendicular to the maximum plot slope and spaced 0.624 m apart(Fig.1).A rill reach was defined as the rill portion between a given transect-thalweg intersection and the rill end (e.g., reach 10-1, 9-1, …, 2-1).The hydraulic measurements were carried out at the reach scale and were used to calculate the Darcy-Weisbach friction factor f, the Froude number F, and the Reynolds number Re
In each experimental run, R and h were determined using a recently developed method(Di Stefano et al.,2019)which couples the ground survey of the rill channel from the SfM technique with the survey of the water tracks inside the channel marked by a dye solution.In detail,the rill channel was colored by a Methylene blue solution transported by the flow(Fig.2) to allow the survey of the wetted lateral surface SLrrapplying the GIS function “real surface”(SAGA 7.0.0) and then the function “zonal statistics” (ArcGIS 10.5).
Using the vector polygon corresponding to the rill tracks, the ArcGIS-tool implemented by Bˊaˇcovˊa, Krˊasa, Devˊaty, and Kavka(2019) allowed us to create the water surface and measure the corresponding area Wrr.The channel volume Vrrwas obtained from the difference between the DEM of the reconstructed water surface and that of the eroded channel.The mean hydraulic radius R and depth h were obtained as follows (Di Stefano et al., 2019):
The slope steepness s of the reach was calculated by averaging the values measured in the rill reach thalweg extracted by 3D-DTM.
To assess the sensitivity of the tortuosity parameter to the crosssection spacing, for the four whole rills (reaches 10-1) incised on LS,the thalweg and its length were determined for spacing values d equal to 0.005, 0.01, 0.025, 0.05, 0.075, 0.10, and 0.15 m.The minimum value of 0.005 m was equal to the mean ground sample distance(GSD),which,being the actual terrain surface represented in the pixel of the camera sensor,is a measure of the detail level of the 3D model.In particular, the latter increases as GSD decreases(Di Stefano et al.,2019).For all the rill reaches,the tortuosity values were determined using d = 0.075 m, which was chosen as discussed below.For each rill,the variability of these tortuosity values around that of the entire rill channel was low compared to the variations between the four entire rills.Therefore, the tortuosity value of the entire rill was also attributed to all the reaches.

Fig.2.- View of the wetted portion of the rill channel highlighted by the Methylene blue solution for CS.
The mean rill flow velocity V was measured by the dye-tracing technique (Abrahams et al.,1996; Di Stefano et al., 2021; Govers,1992) using a Methylene blue solution as a tracer.A small amount of tracer was injected in the transect-thalweg intersection,and flow velocity was then measured by recording the travel time of the leading edge of the dye cloud over the reach length.The ratio of the reach length to the travel time to cover this span is the surface velocity Vsof the leading edge of the dye cloud.In this paper, the reach length was measured along the thalweg and was dependent on d, as reported below.A correction factor of 0.8 was applied to convert Vsto the mean flow velocity V(Di Stefano et al.,2018).
A total of 59 measurements (29 for LS and 30 for CS) were collected, resulting from eight rills with nine reaches and the exclusion of 13 measurements related to the terminal reaches,where the very low travel time of the dye caused high errors in the flow velocity measurement.
3.Results
3.1.Determination of the rill tortuosity
For LS, the tortuosity t3Dof the four investigated rills is plotted against the cross-section spacing d in Fig.3.The expected decreasing relationships clearly show a rapid variation for lower d values, reaching a nearly invariant value for d ≥ 0.075 m.Therefore, for d ≥0.075 m the flow velocity is independent of the section spacing, while for the lowest d values the measured rill length and, consequently, the calculated flow velocity increases.However, the highest velocity values would correspond to mean flow paths affected by the microtopography and, hence, characterized by continuous variations of direction, which is unlikely to occur.Finally, the choice d = 0.075 m was considered physically sound and used for further analyses.The tortuosity values for LS were equal to 1.04,1.10,1.18,and 1.29,while for CS,they were equal to 1.04,1.07,1.17, and 1.31.
The ratio between the tortuosity based on the thalweg 3D and 2D decreases with increasing section spacing, and this relationship weakens for the rill 4(Fig.4).Overall,it ranges from 1.081 to 0.997 while for d ≥ 0.075 m falls within the very narrow range 1.007-0.997.In other words, for d ≥0.075 m, the tortuosity is not affected by thalweg slope changes.In the remainder,t is equal to t3D.

Fig.4.-Plot of the section spacing d against the ratio between the tortuosity based on the thalweg 3D and 2D, t3D/t2D, for the four entire rill channels and LS.
3.2.Hydraulic analyses
Fig.5 shows the variation of slope gradient s,hydraulic radius R,Darcy-Weisbach friction factor f,and flow velocity V with tortuosity t for the entire rill channels for LS and CS.The expected slope reduction, due to the lengthening of the thalweg for a given difference in elevation,is apparent.For LS,the slope varies from 16.8%for the straight rill channel(t=1.04)to 13.8%for t=1.29,while for CS decreases from 10.8%(t=1.04)to 8.3%for t=1.31.For both soils,the hydraulic radius is almost constant and equal to 1 cm,while the friction factor features a non-monotonic relation with t.For LS, f decreases up to t = 1.18 and reaches a higher value (1.44) for t = 1.29, practically equal to that (1.45) corresponding to the straight rill.For CS, f decreases to a minimum value of 0.58 for t = 1.17 and reaches the highest value (0.91) for t = 1.31.The flow velocity is approximately constant(0.33-0.35 m s-1,depending on the soil)for all the tortuosity values but the highest one,for which it reduces to 0.28 m s-1.

Fig.3.- Relationship between the section spacing d and the tortuosity t3D for the four entire rill channels and LS.

Fig.5.-Variations of (a) slope gradient s, (b) hydraulic radius R, (c) Darcy-Weisbach friction factor f, and (d) flow velocity V with tortuosity t for the four entire rill channels.
The difference in the friction factor between LS and CS mainly derives from the different slope ranges rather than the soil effect.In fact, from Eq.(4), as calibrated by Carollo et al.(2021) for straight rill channels and different soils including the present ones(see Eq.(9) by Carollo et al., 2021), the effect of soil texture on the friction factor is represented by the (1/a)2/(1+δ) term
where SILT (%) and CLAY (%) are the silt percentage and the clay percentage, respectively, and the exponent 2/(1 + δ) varies from 0.88 to 0.94.The ratio between the values calculated by Eq.(10)for LS and CS ranges from 1.066 to 1.07, thereby highlighting differences in the f value equal to,at the most,7%,which are within the error range (±20%) of Eq.(9) by Carollo et al.(2021), and sharply lower than those shown in Fig.5c.Reasonably assuming that this result can be extended to tortuous rills, for comparable tortuosity values and hydraulic conditions (Table 1), the detected variation between LS and CS can be attributed to the different slope.
The constant flow velocity for 1.04 ≤t ≤1.17 (CS) -1.18 (LS)(Fig.5d)and is associated with a constant hydraulic radius(Fig.5b)and a linear decrease of f for decreasing s values(Eq.(5),Fig.5a,c).Instead,for higher t values,the presence of sharp curves makes the flow velocity lower.
Fig.6, which shows the experimental (Re, F) pairs measured at the reach scale, demonstrates that,for LS,the flow is subcritical inmost of the cases (23 out of 29), and 4 out of 6 supercritical flows occur for the single series with t=1.10.For CS,the flow is subcritical in half of the cases, including all the measurements for t = 1.31.Moreover,the flow is always turbulent,and the Reynolds numbers for the lowest t value are greater than those for the highest t value.
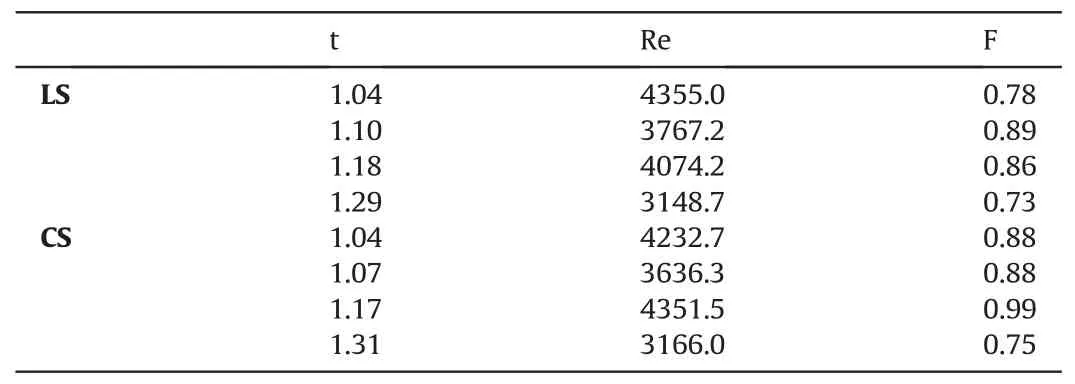
Table 1-Values of the tortuosity t,Reynolds number Re,and Froude number F for the entire rill channels and the two investigated soils (LS and CS).
The relationship between the Darcy-Weisbach friction factor and the Reynolds number was widely investigated for straight rill channels.The decrease of f with increasing Re is well-known if the flow depth is much greater than the size of the roughness elements.As an example, Gilley et al.(1990) proposed the following power equation:
in which Re=VR/ν,and a0and b0are two empirical coefficients.An extensive field investigation performed in different sites in the USA highlighted a wide variability of both a0(114-527,000) and b0(0.621-1.85).The(Re,f)pairs measured in the present investigation and distinguished by the tortuosity value are shown in Fig.7.This figure shows that f decreases as Re increases according to a relationship having the power form of Eq.(11).
According to the above analysis referred to Eq.(10),as soil effect on the friction factor can be considered negligible,all the available measurements were used together to calibrate Eq.(3), obtaining a = 0.509, b = 1.070, and c = 0.466.Eq.(4) with these coefficient values agrees very well with the f measurements as it is characterized by a mean absolute error equal to 2.3%and estimate errors lower than ±5% for 91.5% of the cases.However, the comparison between the measured and calculated friction factors(Fig.8)points out a light systematic underestimation or overestimation for some experimental series.Using the obtained values of b and c, and exclusively attributing the tortuosity effect to a coefficient, the latter was estimated,for each t value,as the slope coefficient of the best-fit straight line to the (F1.070/s0.466, Γv) pairs (where Γvis obtained by Eq.(2))passing through the origin of the axes(Fig.9).Eq.(4), with b = 1.070, c = 0.466, and these a values, performs better than the previously calibrated flow resistance equation as the mean absolute error is equal to 1.1%,the estimate errors are always lower than ±5%, and, for all experimental series, the predictions are not biased (Fig.10).
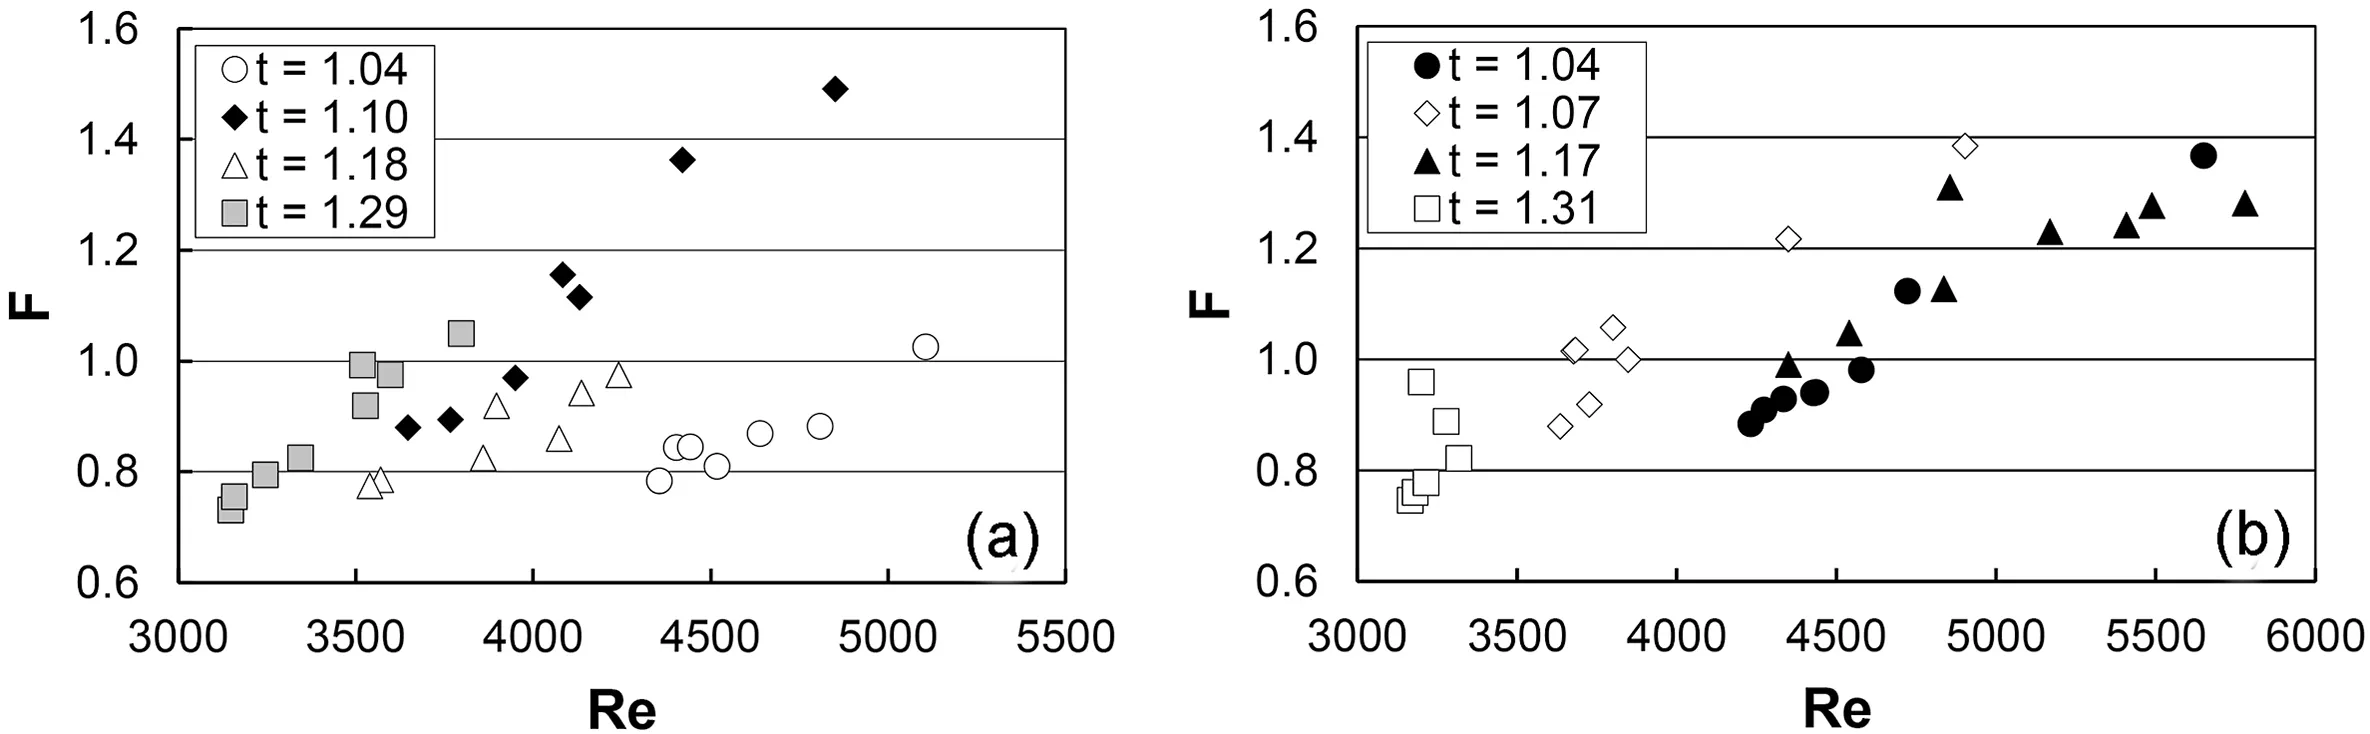
Fig.6.- Plot of the pairs Reynolds number Re - Froude number F measured at the reach scale for different tortuosity values for (a) LS, and (b) CS.

Fig.7.-Plot of the pairs Reynolds number Re-Darcy-Weisbach friction factor f measured at the reach scale for different tortuosity values and the best-fit curves of Eq.(11)for(a)LS, and (b) CS.
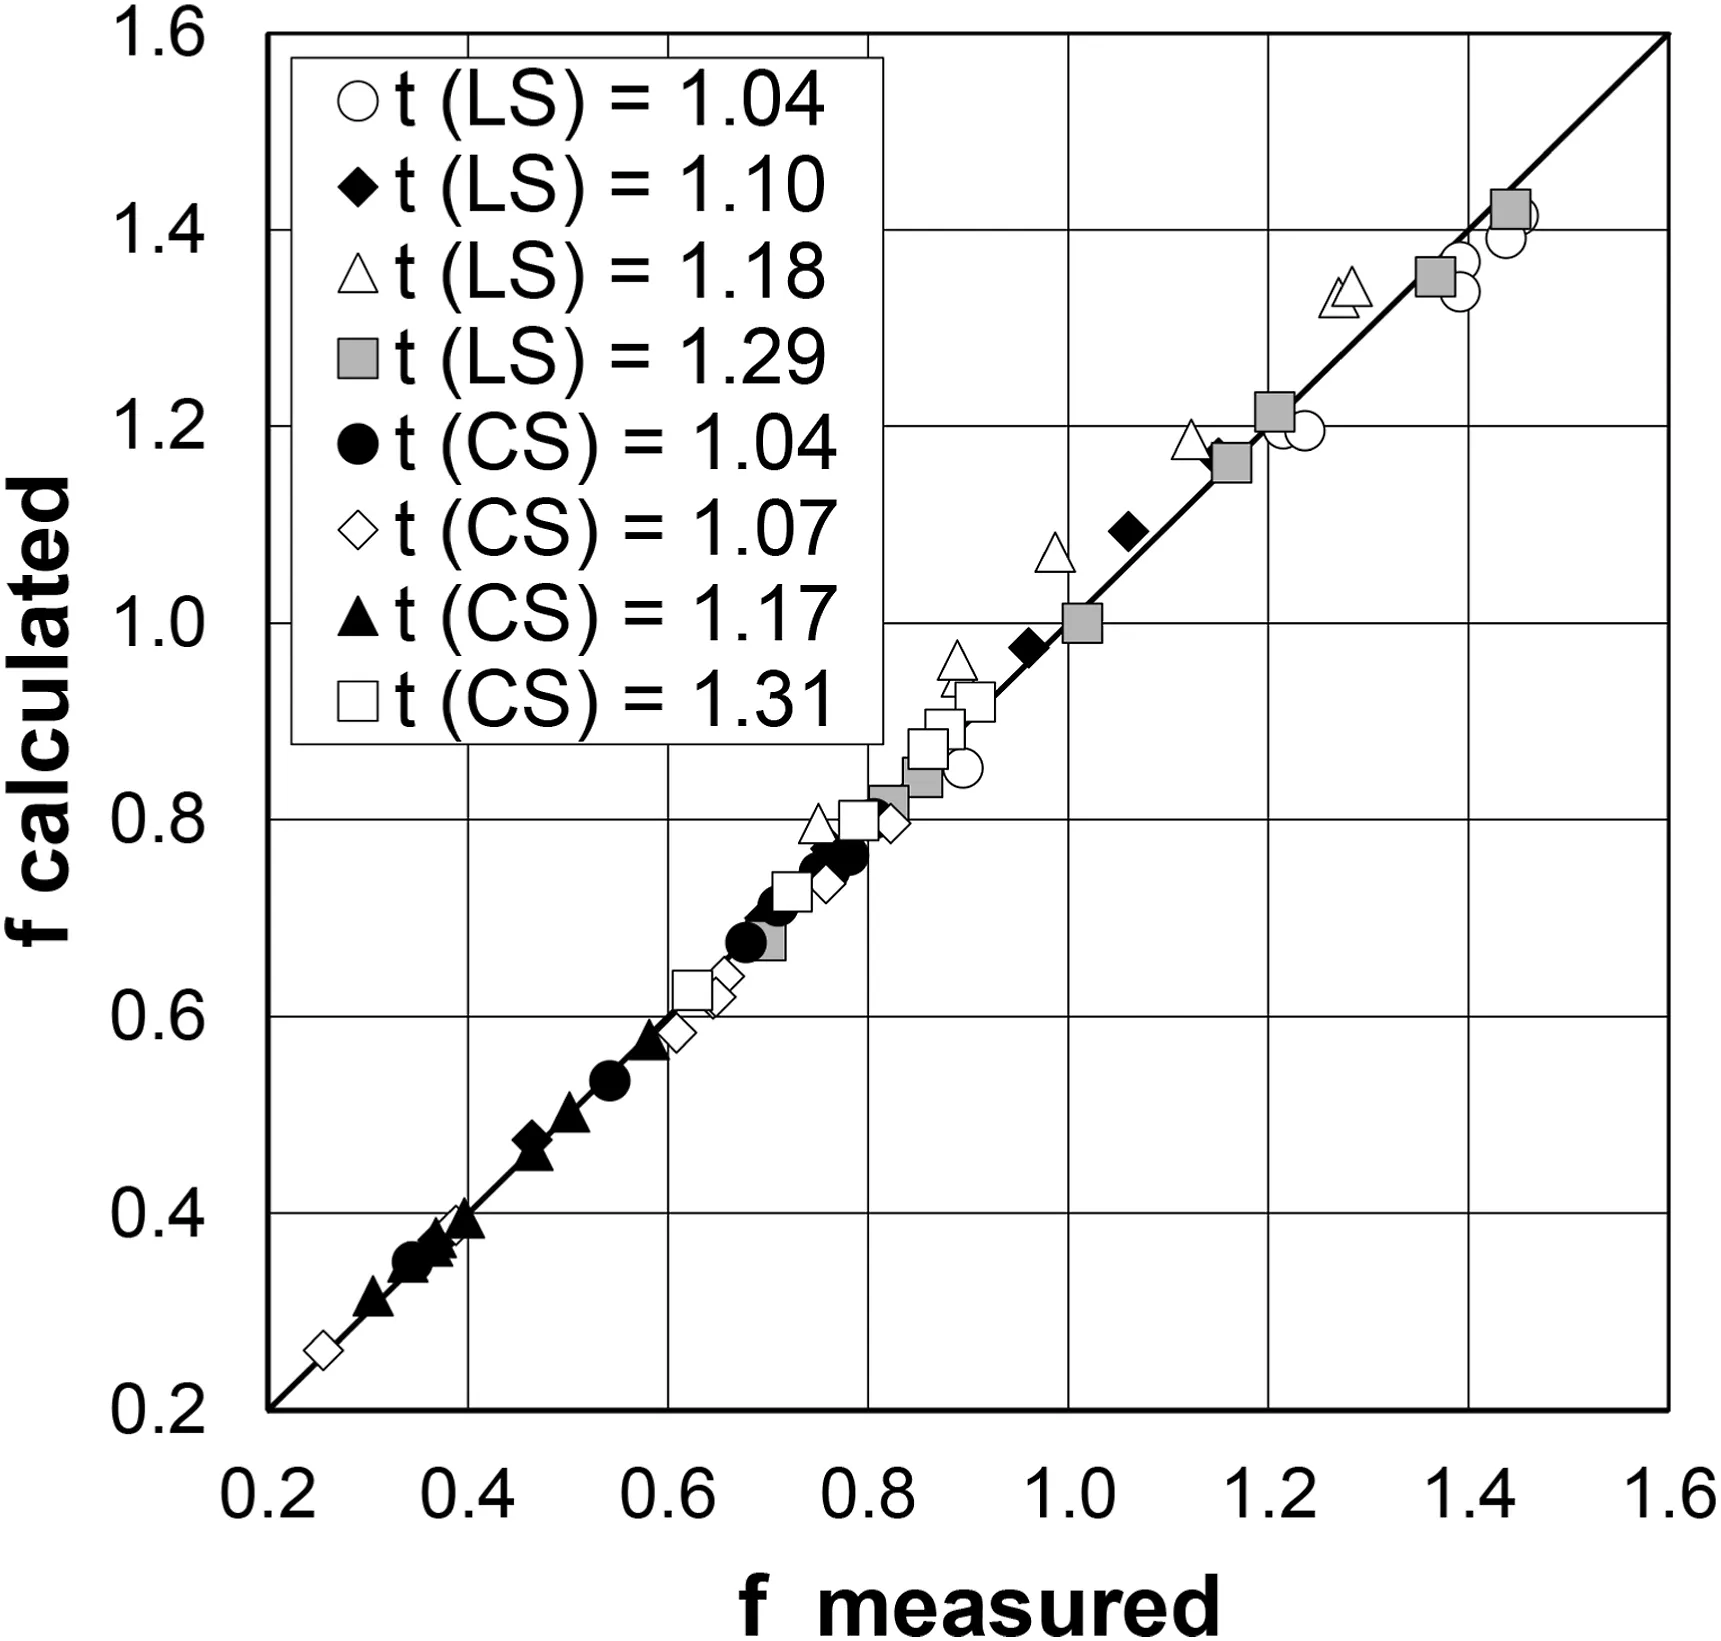
Fig.8.-Comparison,for different tortuosity values,between the values of the Darcy-Weisbach friction factor f measured at the reach scale and those calculated by Eq.(4)with a = 0.509, b = 1.070, and c = 0.466.
4.Discussion
4.1.Determination of the rill tortuosity
In this investigation,the choice of the cross-section spacing d for thalweg extraction affects the measurement of the actual rill length,slope,tortuosity,and flow velocity,while d was not required to calculate the wetted rill volume and surface and the deriving variables R and h.

Fig.9.- Plot of the a coefficient of Eqs.(3) and (4) against the tortuosity t.
The t sensitivity analysis suggested using d=0.075 m as it was considered reliable in terms of the corresponding flow velocity and allowed obtaining the maximum accuracy,in the range of invariant velocity, to determine s.Lower d values yielded an increase in the calculated flow velocity,as an example for t=1.04,ranging from 4%(d=0.05 m)to 179%(d=0.005 m).For both the investigated soils,the actual tortuosity was close to that set in the phase of manual rill incision,and the two furrows which appeared as straight channels were also characterized by an increase in length of 4%compared to the minimum one (straight line distance between its extremes).
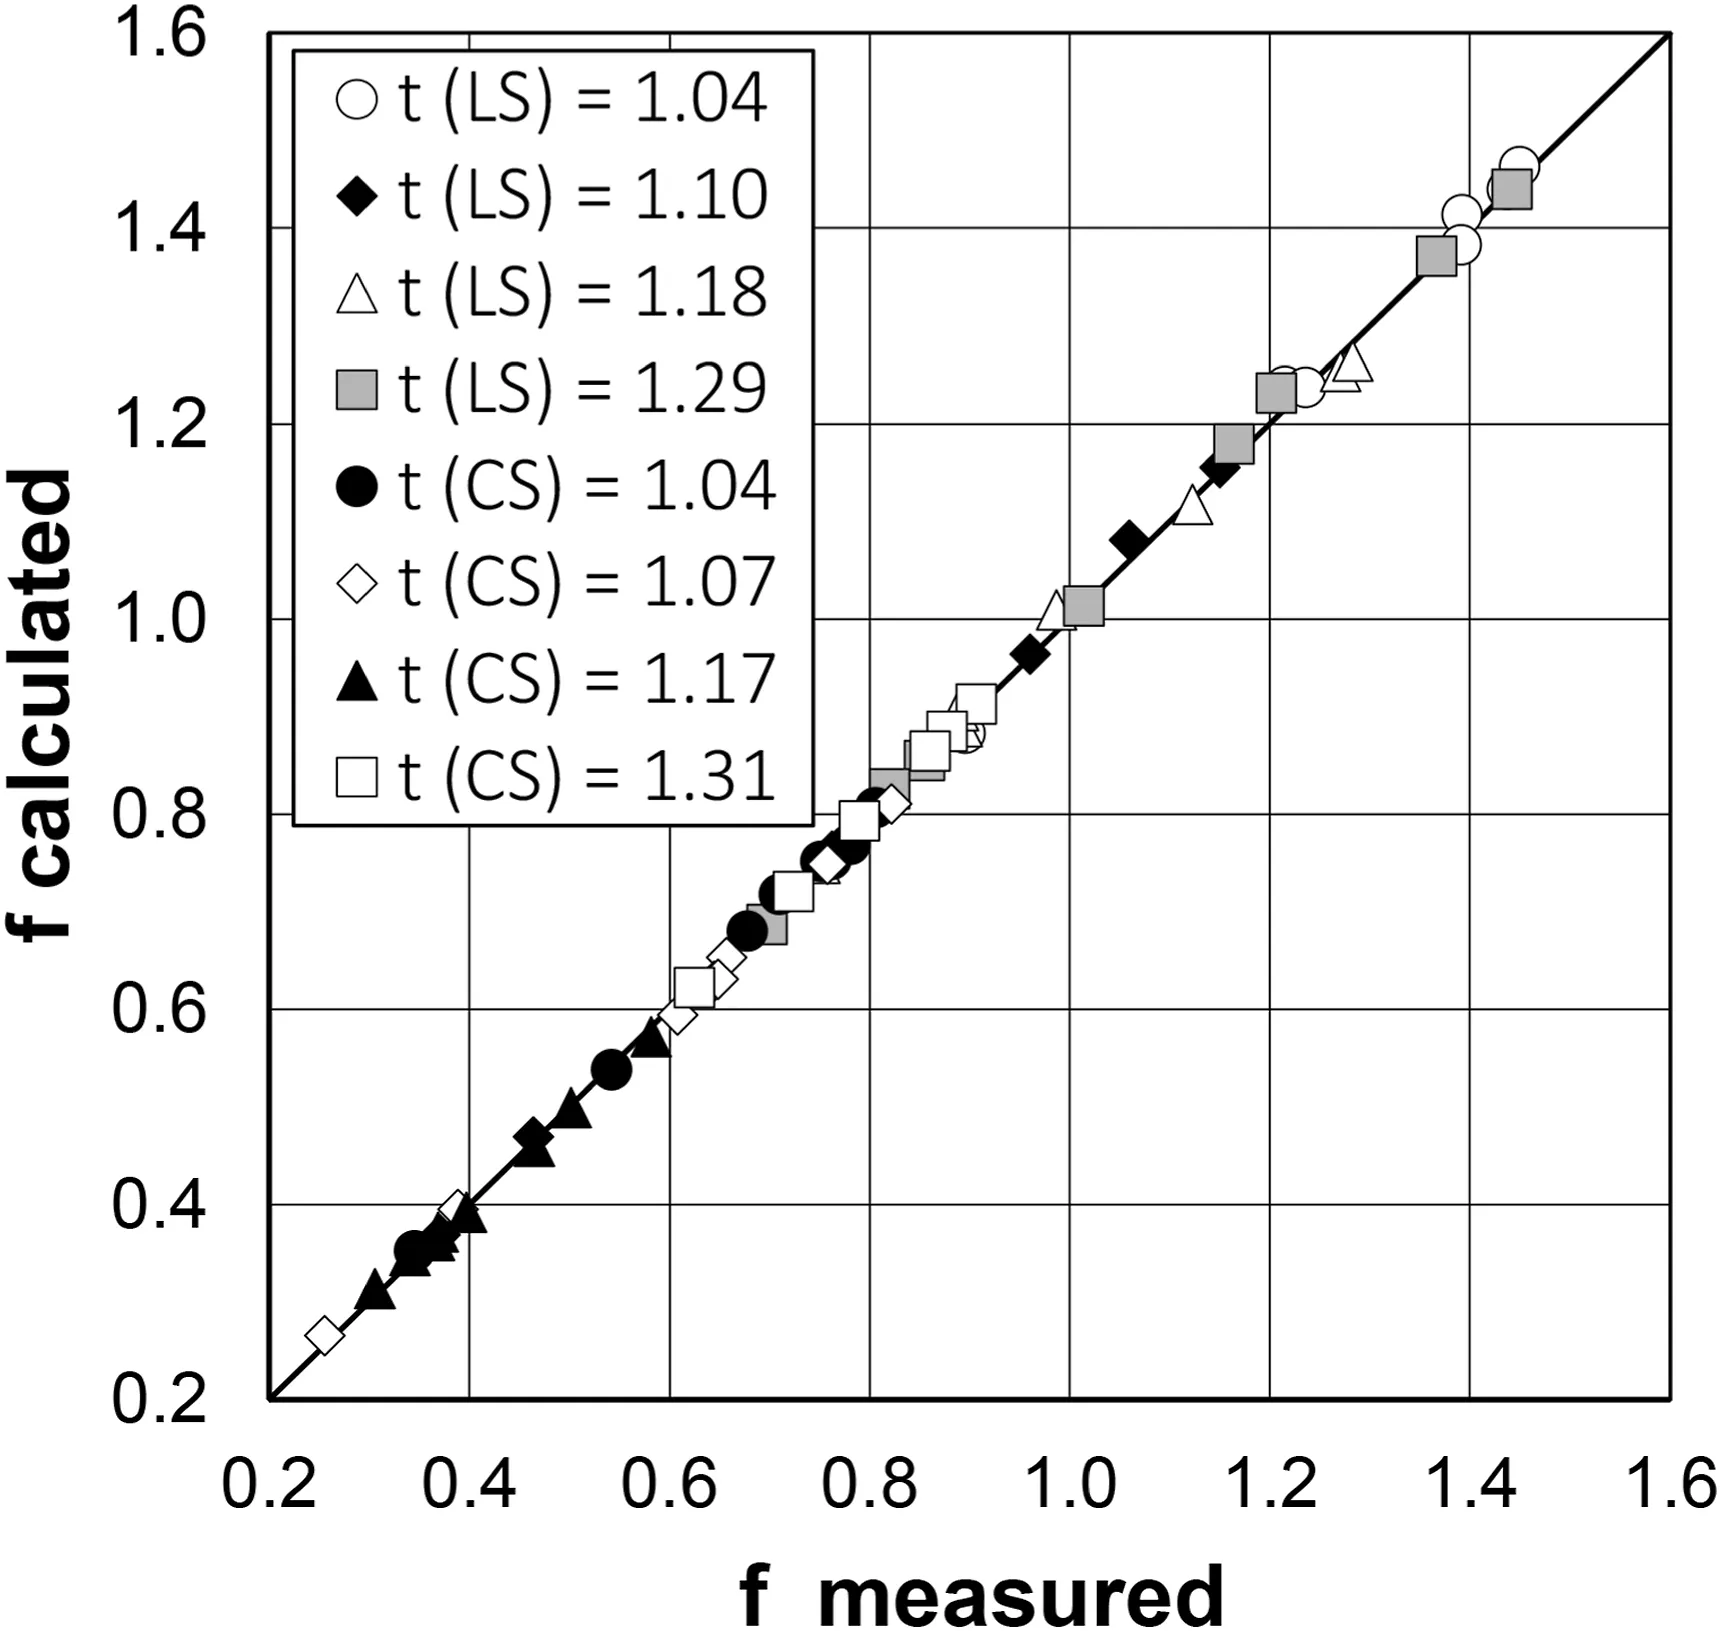
Fig.10.-Comparison,for different tortuosity values,between the values of the Darcy-Weisbach friction factor f measured at the reach scale and those calculated by Eq.(4)with b = 1.070, c = 0.466, and an estimated for each t value (Fig.9).
In this investigation,the rill volume was obtained without using the cross-section spacing d,while in other studies(e.g.,Casalì et al.,2006;Di Stefano et al.,2017b)the channel volume was the sum of the volumes of rill segments bounded by cross-sections with a constant spacing.In this last case,the channel volume was found to be slightly dependent on the ratio between d and total rill length TRL for d/TRL lower than 0.2(Di Stefano et al.,2017b).In the present investigation,d/TRL varied from 0.011 to 0.013,which are extremely lower values than the abovementioned threshold of 0.2.In other words, reliable measurements of rill volume would also be obtained if d = 0.075 m was applied.The latter value allows for reliably measuring the volume of rills with lengths greater than or equal to 0.075/0.2 = 0.375 m.
For d ≥0.075 m, the tortuosity was independent of the type of thalweg(3D or 2D)used for its calculation.This result implies that the tortuosity t3Dconsidered in the present analysis is comparable with that determined with the method applied by Strohmeier et al.(2014), which neglects vertical channel bed irregularities.
4.2.Hydraulic analyses
The friction factor can be partitioned into three additive components deriving from bed roughness, sediment transport, and localized energy losses due to curves,respectively.In principle,the latter produces local friction effects that are negligible for straight rill channels.According to the feedback mechanism detected for eroding straight rills (Govers, 1992), as the slope decreases, the erosion rate also decreases, producing lower bed roughness and sediment transport and nearly constant flow velocity.Applying this concept to the present case, for increasing t values (see Fig.5a),these two components of the friction factor are likely to decrease while the local friction effects produced by the curves become more and more relevant.The plot of f against t(Fig.5c)suggests that the components due to bed roughness and sediment transport prevail over that due to the curves for 1.04 ≤t ≤1.17(CS)-1.18(LS),while an opposite result occurs for higher t values.Moreover, the direct linear relationship of the friction factor against the rill slope,together with the invariance of the hydraulic radius, results in a constant flow velocity(Equation(5))and support the idea that the feedback mechanism also occurs for tortuous rills with 1.04 ≤t ≤1.17 (CS) -1.18 (LS).Conversely, for higher t values the feedback mechanism vanishes and the flow velocity decreases.Therefore,the present result allows extending to rills with a certain degree of tortuosity the statement by Govers et al.(2007) that assuming a constant hydraulic roughness is inappropriate for eroding rills.In a model that uses the Darcy-Weisbach equation to predict flow velocity,such as WEPP,the tortuosity-independence of rill flow velocity can be accounted for by allowing f to decrease for increasing t values to 1.17-1.18.
Strohmeier et al.(2014) found a statistically significant correlation between rill tortuosity and Manning-Strickler roughness coefficient,kst.Their FDR experiments generated significantly lower kstvalues, i.e., increasing values of the Darcy-Weisbach friction factor, compared to SCR experiments.This finding does not agree with the present result.However,within the range of t overlapping with that investigated here,the effect of the tortuosity depends on the discharge (see Fig.6 of the paper by Strohmeier et al., 2014).Specifically, for Q = 0.27 L s-1(1.056 ≤t ≤1.073) kstdecreases (f increases) as the tortuosity value increases but for Q = 0.145 L s-1(1.051 ≤t ≤1.109) kstis nearly constant, revealing a marked different behavior between the two cases.
The same inflow discharge produced partially or not overlapping ranges of the Reynolds number between different tortuosity values.The Re mean value decreased and fluctuated with increasing tortuosity for LS and CS, respectively.Although power relationships fitted well the (Re, f) experimental pairs, they were primarily influenced by the tortuosity parameter.
The developed analysis suggested that the flow resistance law(Eq.(4)) gives a reliable prediction of the Darcy-Weisbach friction factor,especially considering tortuosity as a predictive variable.Eq.(4) has a general validity, that is, can be applied to different conditions concerning rill bed, sediment transport and planimetric tortuosity,by properly estimating the a,b,and c coefficients of Eq.(3).
The main limit of the proposed flow resistance approach which,however, is unavoidable and common to all the investigations on this topic(Di Stefano et al.,2022),is the single rill parameterization(Strohmeier et al., 2014) rather than on rill networks at hillslope scale.
5.Conclusions
Rill channels naturally formed in fields can be characterized by a degree of tortuosity but they have been little investigated compared to straight rills, so neither a shared definition of tortuosity is available, nor the commonly applied flow resistance laws have been tested for this specific case.
The experiments performed here allowed for establishing that(i)according to the applied procedure to extract the rill thalweg and determine the tortuosity, the cross-section spacing d can be set equal to 0.075 m, and (ii) for increasing t values and the two investigated soils, the Darcy -Weisbach friction factor first decreases and then increases as a result of the opposite effects produced by bed roughness and sediment transport on the one hand,and the localized energy losses due to curves on the other hand.The feedback mechanism, which explains the well-known slope-independence of flow velocity in eroding straight rills, was also confirmed for 1.04 ≤t ≤1.18, while it did not occur for the two highest tortuosity values (1.29-1.31).
The flows were mostly subcritical and always turbulent, with correlations between the Darcy-Weisbach friction factor and the Reynolds number greatly depending on the tortuosity parameter.
The flow resistance law, calibrated here by considering the tortuosity parameter as a predictor,gives very accurate estimations of the Darcy-Weisbach friction factor and reflects the relationship between f and t.
Further measurements for different experimental conditions(e.g., soil, plot slope, discharge) are needed to deepen the knowledge of the tortuosity-friction factor relation and test the proposed flow resistance law.
Declaration of competing interest
The authors declare that they have no known competing financial interests or personal relationships that could have appeared to influence the work reported in this paper.
Acknowledgements
All authors set up the research, analyzed and interpreted the results and contributed to write the paper.This research did not receive any specific grant from funding agencies in the public,commercial, or not-for-profit sectors.
 International Soil and Water Conservation Research2023年4期
- International Soil and Water Conservation Research的其它文章
- Atlas of precipitation extremes for South America and Africa based on depth-duration-frequency relationships in a stochastic weather generator dataset
- Saturation-excess overland flow in the European loess belt: An underestimated process?
- Streamflow prediction in ungauged catchments by using the Grunsky method
- Towards a better understanding of pathways of multiple co-occurring erosion processes on global cropland
- Calibration,validation,and evaluation of the Water Erosion Prediction Project (WEPP) model for hillslopes with natural runoff plot data
- Long-term trends of precipitation and erosivity over Northeast China during 1961-2020