
Detection of Multi-dimensional Driving Forces of Public Environmental Concern in China: Based on Spatial Heterogeneity Perspectives
2023-12-16 13:20TONGYunPANGLiSUNMinghuiHANJunyi
Chinese Geographical Science 2023年6期
TONG Yun ,PANG Li ,SUN Minghui ,HAN Junyi
(1.School of Tourism,Hainan University,Haikou 570228,China;2.Hainan Province Holistic Tourism Research Base,Haikou 570228,China;3.Academician Station of Hainan Province,Haikou 570228,China)
Abstract: Public environmental concern (PEC) is an important bottom-up force in building an environmentally sustainable society.Guided by attitude theory,this paper innovatively constructed a PEC evaluation index system,while introducing entropy weighted-TOPSIS (Technique for Order Preference by Similarity to Ideal Solution) to realize the assessment of PEC.Exploratory spatial data analysis was used to portray the spatio-temporal evolution patterns of PEC in 362 Chinese cities at prefecture-level and above from 2011 to 2018.Furthermore,the Geodetector model was performed to identify the multi-dimensional determinants of PEC from the perspective of spatial heterogeneity.The results indicated that: 1) PEC in China exhibited a fluctuating upward trend,consistent with the spatial distribution law of ‘Heihe-Tengchong Line’ and ‘Bole-Taipei Line’;2) the driving effect of each factor varied dynamically,but in general,economic development level,population size,industrial wastewater,and education level were the dominant driving factors explaining the spatial variation of PEC;3) risk detection revealed that four factors,government environmental regulations,PM2.5,vegetation coverage,and natural resource endowment,had nonlinear effects on PEC;4) the interactions between factors all demonstrated an enhancement in explaining the spatial differentiation of PEC.PEC was driven by the comprehensive interaction of four-dimensional factors of economy,society,pollutant emissions,and ecology.Among them,population agglomeration accompanied by a high level of regional economy and information technology can explain the increase in PEC to the greatest extent.
Keywords: public environmental concern (PEC);spatio-temporal variations;driving factors;Geodetector;Baidu Index;spatial heterogeneity
1 Introduction
Public concern for the environment is increasingly recognized as an overwhelming force in environmental governance (Li et al.,2021;Lou et al.,2022).Since the 1960s,PEC has been gradually awakened with the publication ofSilentSpring(Parks,2017).Global concerns and discussions on environmental issues such as climate change and environmental degradation are gradually heating up (Marquart-Pyatt,2012).In response,several countries have taken the lead in implementing environmental information disclosure and developing environmental regulations for public participation.These initiatives have effectively capitalized on the growing PEC and have had a positive impact on environmental governance (Paloniemi et al.,2015).Public concern about haze,for example,has prompted China to revise its Ambient Air Quality Standards and make PM2.5monitoring mandatory (Lu et al.,2018).Moreover,public concern about the environment can make environmental legislation more acceptable to the public and even encourage active public participation in monitoring environmental governance (De Pretto et al.,2015).The role of PEC in facilitating the development and effective implementation of environmental policies is demonstrated at the practical level.Therefore,valuing the power of the public in environmental governance may be a potentially effective way to achieve the Sustainable Development Goals (SDGs).
China is currently undergoing a critical period of economic and social green transformation.However,according to the Environmental Performance Index (EPI)released by Yale University,China ranks 160th out of 180 countries (Wolf et al.,2022),indicating that China’s environmental and energy consumption issues require extensive attention.On this basis,the government has made many efforts in environmental governance,including establishing an environmental protection performance evaluation (EPPE) system for cadres (Liu et al.,2016) and imposing pollution emission fees on enterprises (Yang et al.,2019).However,these traditional top-down environmental governance strategies have not been as effective as they should be for a variety of reasons,such as financial constraints and the priority of economic growth (Li et al.,2021;Wu et al.,2021).Fortunately,economic development has also led to an increase and deepening of environmental awareness among the Chinese public,which is a positive indicator(Tong et al.,2021).The experience of developed countries confirms that the initial impetus for environmental protection comes from the public,and the solution to environmental problems must rely on public participation (Yang et al.,2019).To this end,China has proposed to build a system in which the government,enterprises,and the public jointly engage in environmental governance (Wu et al.,2022).The Environmental Protection Law of China has affirmed the public’s right to supervise environmental protection and established a mechanism for the public to access environmental information and participate in environmental protection(Yang et al.,2019).Harnessing the power of PEC has become a new direction for the Chinese government to tackle environmental pollution.
Scholars have long recognized the significance of PEC and have conducted multi-level studies of PEC from different disciplinary perspectives,encompassing psychology,economics,and sociology.One major direction is the assessment of PEC.Scale development is a time-honored technique for assessing PEC,as exemplified by the Environmental Concern Scale (ECS) (Weigel and Weigel,1978),the New Environmental Paradigm (NEP) scale (Dunlap et al.,2000),and the Chinese version of the New Environmental Paradigm (CNEP)scale (Hong et al.,2014).These scales provide theoretical and instrumental support for assessing PEC in different research scenarios.For instance,the scales have been referenced to measure PEC in the large-scale and ongoing Chinese General Social Survey (CGSS) (Wang et al.,2021).In addition,previous studies have attempted to quantify PEC at the national or provincial level using environmental petition data (Tong et al.,2021) or the number of proposals from the National People’s Congress deputies and the Chinese People’s Political Consultative Conference members (Zhang G X et al.,2019).However,such public opinion surveys are relatively limited in the Chinese context,due to high data collection costs,limited sample representativeness,and poor spatio-temporal continuity.Therefore,big databased methods for assessing PEC have emerged in recent years,which infer the public’s awareness,perception,and interest in the field through search behavior for specific phrases on search engines (Lu et al.,2018).For example,the search volume for ‘climate warming’ on Google Trends (Kahn and Kotchen,2011) and ‘haze’ on Baidu Index (Li et al.,2021) have been utilized to reflect the degree of PEC and its variations.
Another line of research on PEC is its externality.Many studies have confirmed the positive impact of PEC on government environmental governance,corporate and public pro-environmental behavior (Amador et al.,2013;Zheng et al.,2014;Cheng and Liu,2018).PEC can help replenish public environmental policies and promote environmental governance in local governments,as evidenced in the United States (Liu et al.,2014),Thailand (Forsyth,2007),India (Greenstone and Hanna,2014),and China (Zhang J P et al.,2019).Furthermore,as an informal form of environmental regulation,PEC also has implications for corporate operations and sustainable development (Liu et al.,2019).For example,PEC may affect CEO (chief executive officer)turnover and green investments (Gu et al.,2021),enterprises’ e-commerce strategies (Magnier and Schoormans,2015),and the development of new energy companies (Gu et al.,2022).There are also studies exploring whether PEC can raise the public’s desire to purchase certain products or services from environmentally friendly enterprises (Amador et al.,2013;Gu et al.,2022).Several lines of evidence support the substantial effect of PEC,which strongly demonstrates the significance and necessity of PEC-related research.
The latter direction is the investigation of PEC’s influencing elements.The majority of studies have been conducted based on empirical frameworks in psychology or management,assessing PEC at the micro level or at a broad national level through questionnaires.Consequently,the exploration of PEC’s influencing factors has also been more biased towards the micro-level.Micro-individual factors of PEC,such as demographic characteristics (Twenge et al.,2012;Melis et al.,2014),education level (Wen et al.,2017),income level (Pu et al.,2019),group pressure (Clements et al.,2014),and values (Aasen,2017) have been extensively studied.However,macro-level factors,like macroeconomics,humane society,and the ecological environment,remain relatively limited (Liu and Mu,2016).
This paper constructed a comprehensive PEC evaluation index system by using the Baidu Index of environment-related keywords,which could reflect the Chinese public’s attention to certain subjects.On this basis,the spatial-temporal evolution of PEC in Chinese cities at the prefecture-level and above from 2011 to 2018 was mapped,and then the Geodetector model was employed to identify the multi-dimensional macro-level factors affecting the spatial differentiation of PEC.The above efforts answer the questions of what kind of spatio-temporal distribution characteristics PEC has and why it is presented in this way.The main innovations of the study are as follows: 1) guided by attitude theory,a PEC evaluation index system was creatively constructed,which effectively improves the comprehensiveness and hierarchy of the PEC evaluation;2) innovatively exploring PEC from a geographical perspective,we took advantage of integrated geographic analysis to portray the spatial heterogeneity of PEC;3) a multi-source database containing Internet mining data,socio-economic statistics,and remote sensing image data was constructed to realize the measurement and further research of PEC at the prefecture-level city.This study could provide empirical evidence for policymakers to guide the green transformation of urban public lifestyles.
2 Materials and Methods
2.1 Study area
This paper took a total of 362 Chinese cities at the prefecture-level and above as the study area.A detailed list of cities can be found on the official website of the Baidu Index (https://index.baidu.com),where we excluded Hong Kong,Macao,and Taiwan of China from it for data validity.The remaining 362 cities were incorporated into our study,including municipalities,subprovincial cities,prefecture-level cities,autonomous regions,states,leagues,and regions in China.Such a more comprehensive observation of PEC in most Chinese cities at the prefecture-level and above reflects the advantages of Internet big data represented by the Baidu Index over traditional statistics.Additionally,based on the regional division of the National Bureau of Statistics of China (http://www.stats.gov.cn/zt_18555/zthd/sjtjr/dejtjkfr/tjkp/202302/t20230216_1909741.htm),the study area was further divided into four sub-regions: the eastern,central,western,and northeastern China (Fig.1).
2.2 Driving factors and data sources
2.2.1 Selection of driving factors
The Theory of Environmental Perception (TEP) emphasizes the individual perceptual process of environmental information processing and argues that the formation of environmental perception is motivated by economic,social,and environmental quality and other information (Wang et al.,2020).Therefore,we considered the drivers of PEC from four dimensions: economy,society,pollutant emissions,and ecology.Established studies have confirmed that cities with higher levels of regional economic and social development have higher levels of PEC (Conroy and Emerson,2014;Liu et al.,2014;Liu and Mu,2016).The endowment of environmental resources and the potential environmental risks located may likewise drive PEC (Hao,2014;Liu and Mu,2016).With reference to existing studies,we examined the driving effect of 14 factors on PEC under four dimensions,taking into account the representativeness of the factors and the availability of data.The study period for all drivers is from 2011 to 2018.Table 1 demonstrates the main theoretical basis,explanations,data types and units used for the selection of each factor.

Table 1 Description of the driving factors for public environmental concern (PEC)
2.2.2 Data sources
Three types of data,namely Internet mining data,socioeconomic statistical data,and remote sensing image data,were combined to establish the multi-source dataset for the period 2011-2018.Specifically: 1) Internet mining data,represented by the Baidu Index,was applied to quantify the PEC of 362 Chinese cities at the prefecture-level and above.This maximizes the strength of big data by covering almost all cities in China;2) data for the factors of economic development level(econ),industrial structure (str),tourism economy (tour),informatization level (net),population size (pop),education level (edu),SO2(so2),and industrial wastewater(wastewater) were obtained from theChinaCityStatisticalYearbook(NBSC,2012-2019) andChinaStatisticalYearbookforRegionalEconomy(NBSC,2012-2019).Missing values were made up by provincial and municipal statistical yearbooks and statistical bulletins (Jiang et al.,2021),and the still missing data were supplemented by the linear interpolation method.In particular,the data for natural resource endowment (scenery) were collated by manually sorting the authorized list of national parks in China for each year from 2011 to 2018.The data for government environmental regulations (ger)were derived from each city’s government work reports;3) the multi-source remote sensing image data of construction land area,which is used to measure the urbanization rate (urban) and the normalized difference vegetation index (NDVI),which is used to measure the vegetation coverage (ndvi) were derived from the Resource and Environment Science and Data Center of the Chinese Academy of Sciences (https://www.resdc.cn).The annual average data for PM2.5(pm2.5) came from the Atmospheric Composition Analysis Organization(ACAP),which processes remote sensing image data such as MODIS (Moderate Resolution Imaging Spectroradiometer) and MISR to obtain a raster dataset (https://sites.wustl.edu/acag/datasets/surface-pm2-5/).The data of urban carbon emission intensity (carbon) were extracted from the Chinese county carbon emissions measurements by Chen et al.(2020).We further aggregated this data to the prefecture-level.
2.3 Methods
2.3.1 Assessment of PEC at the prefecture-level
Grounded in attitude theory and the findings of Dunlap and Jones (2002),PEC refers to the public’s awareness of environmental problems and the behavioral intention to make personal efforts to solve them,based on their ecological values.Accordingly,this paper constructed a PEC evaluation index system containing three dimensions of ecological values,environmental cognitions and environmental behavior intention (Table 2).Besides,following the work of Shi (2018) and Long et al.(2022),Baidu Indexes of environment-related compound keywords were used to establish the specific indicator layers,thus enabling the assessment of PEC.Baidu is the search engine with the highest usage rate among the Chinese public (Huang et al.,2016),and the effectiveness of the Baidu Index in indicating Chinese public’s attention to certain subjects has been confirmed (Lu et al.,2018;Ma et al.,2020).The PEC derived from the Baidu Index can reflect the public’s active concern about the environment in different IP addresses(Long et al.,2022).
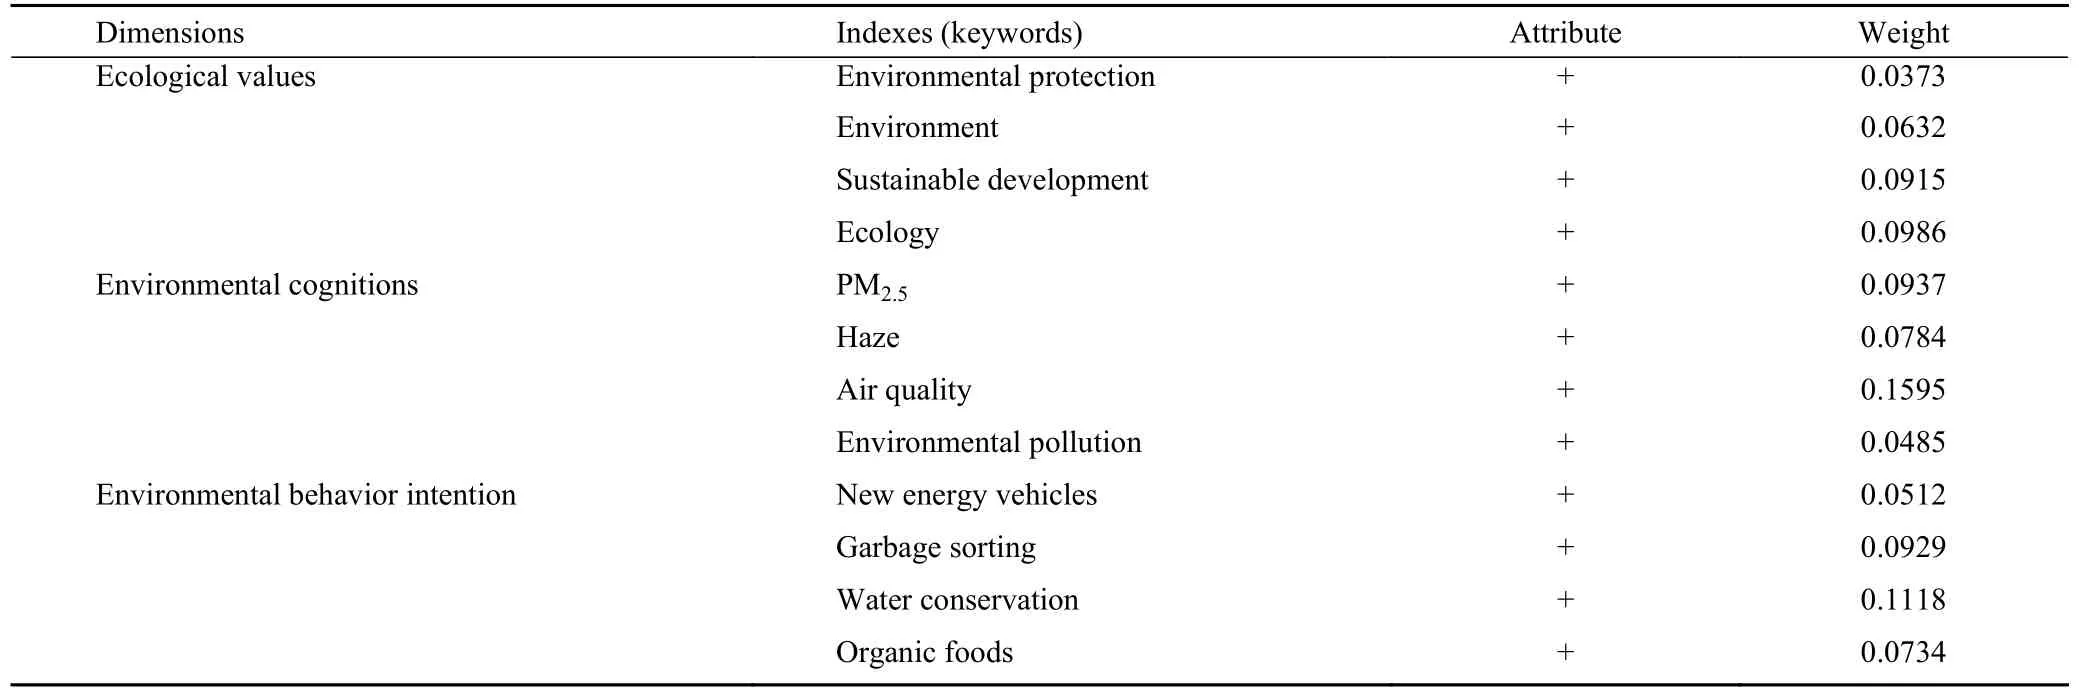
Table 2 Evaluation index system of PEC (public environmental concern) at Chinese prefecture-level cities
Drawing on the ideas of El Ouadghiri et al.(2021),the recognition of indexes reflecting PEC was carried out in three steps.First,a wide range of environment-related keywords were gathered from relevant websites(https://www.cenews.com.cn/;http://www.wurantousu.com),Baidu-related search recommendations and related studies (Shi,2018).Second,the keywords were sorted,classified and cleaned up,checked whether they were included in the Baidu Index,and ordered according to their average value from 2011 to 2018.Finally,the top 4 keywords in each dimension were selected to construct a comprehensive evaluation index system of PEC,which finally contained 3 dimensions and 12 indexes (Table 2).
2.3.2 Entropy weight-TOPSIS
Entropy weight-TOPSIS (Technique for Order Preference by Similarity to Ideal Solution) is an objective and comprehensive evaluation method that can fully use the information of the original data,objectively perform the assignment of indicator weights,and then compare and select from multiple solutions and indicators to obtain the optimal one (Huang,2008;Li et al.,2018).In this study,the entropy weight-TOPSIS method was used to measure the comprehensive index of PEC at the city scale.The higher the comprehensive index,the higher the public concern for the environment.The basic steps and formulas of the evaluation can be referred to Li et al.(2018).
2.3.3 Exploratory spatial data analysis (ESDA)
Exploratory spatial data analysis (ESDA) is an essential technique for analyzing spatial correlation or heterogeneity,primarily with the aid of two analysis tools,namely global spatial autocorrelation analysis and local spatial autocorrelation analysis (Hou et al.,2022).Global spatial autocorrelation focuses on examining the spatial correlation properties of variables over the entire study area,which is typically represented by Global Moran’sI(Moran,1950).This study generated a first-order inverse distance spatial weight matrixWij,and then calculated Global Moran’sIto reveal the global spatial aggregation degree of PEC.The specific formula is as follows:
whereIis the Global Moran’sIindex;nis the total number of spatial units studied;xiandxjare the observed values of the corresponding spatial unitsiandj;is the mean value ofxi;Wijis the constructed matrix of spatial unitsiandj.I∈[-1,1],I>0 denotes that there is a positive spatial correlation of PEC,I<0 denotes that there is a negative spatial correlation of PEC,I=0 denotes that there is an absence of spatial correlation of PEC,and a larger absolute value ofIdenotes a stronger spatial correlation (Moran,1950).
Local spatial autocorrelation is concerned with identifying the local spatial clustering characteristics of variables between an area and its neighbors (Hou et al.,2022).This study plotted the local indicators of spatial association (LISA) aggregation map to shed light on PEC’s local spatial clustering properties.The specific formula is as follows:
whereziandzjare the normalized variance of the PEC of the corresponding spatial unitsiandj,respectively.ESDA can only reveal the spatial distribution of the univariate PEC.To further explore whether other variables can explain the spatial differentiation of PEC,Geodetector is a valuable tool to consider (Deng et al.,2020).
2.3.4 Geodetector model
Geodetector is a set of statistical algorithms that can effectively discern the spatial differentiation of an object and reveal the driving forces behind it.It consists of four sub-detectors: factor detection,risk detection,interaction detection and ecological detection (Wang et al.,2010).Its basic principle is that if a factor appreciably affects PEC,its spatial distribution ought to resemble that of PEC.
This study investigated the spatial heterogeneity and multi-dimensional driving forces of PEC through three sub-detectors: factor detection,risk detection and interaction detection.Factor detection can answer whether there is spatial stratification heterogeneity in PEC and to what extent each factor can explain this heterogeneity.The explanatory power is calculated as follows:
whereqmeasures the explanatory power;Nis the total number of the sample cities; σ2is the variance of PEC for the whole sample;h=1,2,…,m,mis the strata of each factor;Nhandare the number of cities and variance in stratah,respectively.q∈[0,1],and the larger theqvalue,the stronger the explanatory power of the factor on the spatial differentiation of PEC.Risk detection can disclose the distributional characteristics of PEC when each driving factor is in different strata.The sub-interval with a large mean value is defined as a highrisk interval,and the sub-interval with a small mean value is characterized as a low-risk interval (Tong et al.,2021).Interaction detection can determine whether each factor acts independently on the PEC or whether there is an interaction effect that strengthens or weakens the initial explanatory power (Wang and Xu,2017).The specific types of interactions are shown in Table 3.This paper leveraged the GeoDetector package of the R software (https://CRAN.R-project.org/package=geodetector) to implement the Geodetector analysis (Song et al.,2020).
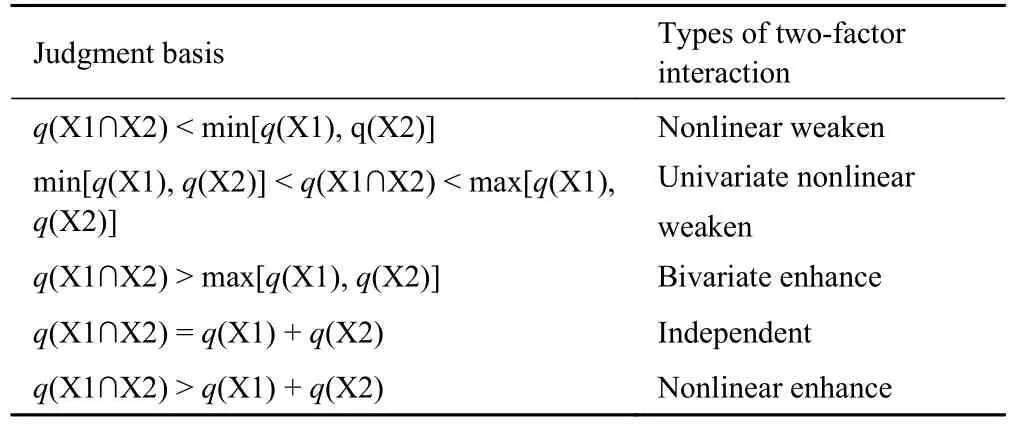
Table 3 Judgment basis and types of two-factor interaction
3 Results
3.1 Spatio-temporal variations of PEC
3.1.1 Temporal evolution analysis
The overall PEC level in China showed a fluctuating upward trend from 2011 to 2018 (Fig.2).Numerically,the annual average comprehensive evaluation index of the national PEC increased from 4.32 to 7.63,with a cumulative growth of 76.62% and an average annual increase of 10.95%,indicating a significant rising trend.Notably,the PEC in 2017 experienced a considerable recovery after a recession in 2016,with a growth rate of 22.76%.This could be attributed to the concept first proposed and highlighted by the Chinese authorities in 2017,namely the ‘nationwide battle to prevent and control pollution’.In the same year,the central government’s environmental protection inspectors achieved thorough coverage in 31 provinces (including autonomous regions and municipalities).This fully mobilized the public’s enthusiasm to participate in environmental protection and effectively raised the PEC.Regionally,the PEC in the eastern China was numerically higher than that inother areas (Fig.2).And the coefficient of variation(CV) reflecting the discrepancies in datasets rose from 0.46 in 2011 to 0.50 in 2018,implying the gap in PEC among the four regions is widening.In terms of growth rate,PEC rose the most in the western China (103.65%),followed by the eastern (82.64%) and central China(67.95%),while the northeastern China lagged far behind the other three regions (21.34%).
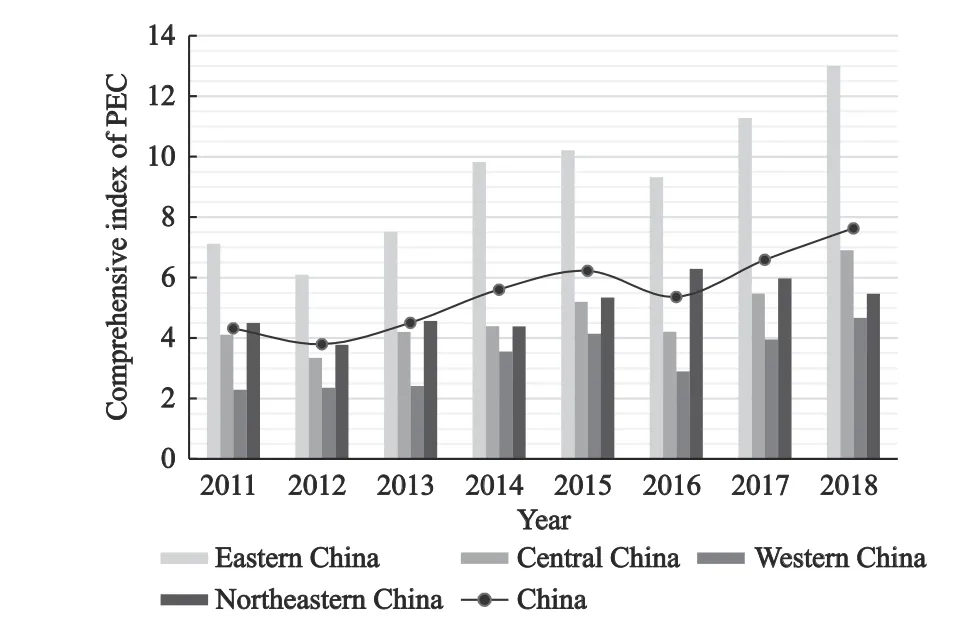
Fig.2 Annual average comprehensive evaluation index of PEC in China (excluding Hong Kong,Macao and Taiwan) and its subregion from 2011 to 2018

Fig.3 Spatio-temporal characteristics of PEC (public environmental concern) in 362 Chinese prefecture-level cities and above
3.1.2 Spatio-temporal pattern analysis
To further explore the spatial distribution and evolutionary characteristics of PEC,we selected three typical cross-sectional years,2011,2015,2018,and the mean of all years,to plot their spatial distribution for comprehensive evaluation index (Figs.3a-3d).Most cities experienced a remarkable growth in PEC,as shown in the spatial distribution maps.PEC pronounced a heterogeneous spatial distribution,with higher values concentrated mainly in the eastern China and lower values in the western China.This was highly consistent with the spatial distribution of China’s urban population and economic development level,roughly delineated by the‘Heihe-Tengchong Line (Hu Line)’.Specifically,the eastern coastal region,the Pearl River Delta urban agglomeration,and the Chengdu-Chongqing urban agglomeration had visibly higher PEC values than the surrounding areas,forming a circular high-value area.The central region,in contrast,formed a relatively low-value area,as demonstrated by the ‘central collapse’.In addition,the PEC in national central cities such as Beijing,Shanghai,Guangzhou,Wuhan,Xi’an,and Chongqing were much higher than those in neighboring cities.While the spillover effect from central cities to neighboring cities was relatively more pronounced in the Yangtze River Delta urban agglomeration,the Pearl River Delta urban agglomeration,the Beijing-Tianjin-Hebei urban agglomeration and the Shandong Peninsula urban agglomeration.This reflects to some extent the status quo of the integrated development of China’s urban agglomerations.
LISA aggregation maps were further presented in order to reveal the local spatial clustering characteristics of PEC (Fig.4).Four different types of spatial clustering were identified,namely,high-high cluster (H-H),high-low outlier (H-L),low-low cluster (L-L) and lowhigh outlier (L-H).The agglomeration area of PEC in Chinese prefecture-level cities and above demonstrated a shrinking trend.Specifically,from 2011 to 2018,the clustering of some cities in the urban agglomeration on the West Side of the Strait shifted from H-H to insignificant,while some cities in Xinjiang,Yunnan and Qinghai shifted from L-L to insignificant.The PEC evidenced notable clustering features,mainly manifested the H-H areas were spatially symmetric with the L-L areas.It can be clearly seen that the H-H areas were mainly concentrated in the Beijing-Tianjin-Hebei urban agglomeration,the Shandong Peninsula urban agglomeration and the Yangtze River Delta urban agglomeration.In particular,the above-mentioned regions were located in the quadrant east of the ‘Heihe-Tengchong Line’ and north of the ‘Bole-Taipei Line’.On the contrary,the LL areas were distributed in the regions of Xinjiang,Qinghai,Tibet,Gansu,Yunnan,Hainan,etc.,and were mainly concentrated in the west of the ‘Heihe-Tengchong Line’ and the south of the ‘Bole-Taipei Line’.
3.2 Multi-dimensional driving forces detection of PEC
3.2.1 Global spatial autocorrelation test
The global Moran’sIindex for overall PEC in 362 Chinese cities remained positive throughout the study period,ranging from 0.072 to 0.170.And the Moran’sIindex passed the significance test at the 1% level for each year (Table 4),indicating the presence of significant spatial autocorrelation for PEC.The Geodetector model was further introduced to figure out the causes of this spatial distribution.
3.2.2 Factor detection
This study considered as many as 362 Chinese prefecture-level cities and above as possible to examine the spatio-temporal variations of PEC,demonstrating the benefits of Internet big data.However,due to the availability and validity of the socio-economic statistical data,we finally constructed a panel dataset of driving factors for 284 Chinese prefecture-level cities and above from 2011 to 2018 for factor detection.
The Geodetector model underlines the stratified heterogeneity of spatial attributes.It is therefore necessary to discretize the continuous spatial process of each factor into discrete layers.Both the chosen discretization method and the number of classifications in the discretization process matter a lot for the probe results.Given the classification methods (including natural,quantile,and equal) and classification numbers (set to 3 to 8),this study achieved the optimal discretization of the probed factors.We reported the optimal classification for the mean within the study period for each factor(Fig.5).

Fig.5 Optimal classification of driving factors for PEC (public environmental concern) in 2011-2018.Meaning of 14 driving factors see Table 1
On the basis of optimal classification,factor detection was performed to identify the dominant factors.Eq.(3)was applied to measure the explanatory power (i.e.,qvalue) of multi-dimensional driving factors on PEC(Table 5).To display the dynamic variations of each factor’s explanatory power on PEC,we further plotted the evolution of theqvalues of multi-dimensional factors from 2011 to 2018 with smooth curves in different colors (Fig.6).

Table 5 Factor detection of spatial differentiation of PEC (public environmental concern)

Fig.6 The evolution of q values of driving factors for PEC (public environmental concern) in 284 Chinese prefecture-level cities and above from 2011 to 2018
In general,the spatial differentiation of PEC was determined by a combination of factors in several dimensions,including the economy,society,pollutant emissions,and ecology.Specifically,except for theqvalues ofstrandger,which were not significant in some years,all other factors passed the significance test throughout the study period,and the specific significance levels are shown in Table 5.
From the lateral comparison,there was a notable variance in the driving effect of each factor on PEC.According to the rank of the mean ofqvalues,the factors driving the spatial differentiation of PEC (q>0.35)were,in order,econ,pop,wastewater,andedu,which can be identified as the dominant factors.While the explanatory power ofnet,tour,carbon,urban,andndviwas relatively weak (0.15 From the temporal evolution (Fig.6),the driving forces of distinct factors experienced different movements from 2011 to 2018.Six factors,namelyecon,urban,pop,pm2.5,carbon,wastewaterandndvi,had a progressively stronger driving effect on PEC.In the foreseeable future,China’s economic development level and urbanization rate would continue to increase.There-fore,the driving effects ofeconandurbanon PEC should be utilized as the primary enhancement strategy to improve PEC.Among them,the rising trend ofpm2.5andcarbonin the pollutant emissions dimensions indicated that the public’s perception and response to pollutants became more sensitive as the economy grew.On the one hand,maintaining economic growth while effectively controlling pollution has become an indispensable challenge.On the other hand,the government can seize this opportunity to build a more open and effective platform for public participation in environmental governance. In addition,theqvalues oftour,net,ger,andso2evidenced a downward trend.Among them,theqvalue ofnethas declined by more than 30%,which can be attributed to the gradual saturation of China’s Internet penetration rate.Thus,the driving effect of informatization level on PEC was gradually weakening.The decreasing explanatory power ofgerimplied that government-led environmental policies and economic planning had less and less impetus for PEC,and PEC formation became more dependent on non-administrative factors. 3.2.3 Risk detection The sub-intervals with higher attribute values for the eight factorsecon,urban,tour,net,pop,so2,edu,andwastewaterhad higher PEC (Fig.7),which was in line with our expectations.That is,as these factors grew,so did the PEC.Whilestrandcarbonhave higher PEC in the lowest attribute value interval.A possible explanation is that cities with lower carbon emissions intensity and fewer secondary industries may have more serviceoriented and technology-intensive industries.This reflects a more advanced stage of economic development,which is conducive to the formation of a higher PEC. Fig.7 Results of risk detection of driving factors for PEC (public environmental concern) at Chinese prefecture-level cities Notably,the driving effect ofger,ndvi,pm2.5andsceneryon PEC was nonlinear,withger,ndviandpm2.5demonstrating an inverted U-shaped relationship andsceneryexhibiting a U-shaped relationship.These relationships,however,were comparatively weak as these four factors all had relatively low explanatory power for PEC.In order to promote PEC levels more effectively,the risk detection results suggested that policymakers should regulate each factor at an appropriate interval based on the different characteristics of the impact of each factor on PEC. 3.2.4 Interaction detection Interaction detection was further employed to identify the potential interaction effects of the factors in different dimensions.The dataset was built using the annual means of each variable from 2011 to 2018,and the 14 factors interacted two-by-two,generating a total of 91 pairs of interactions (Fig.8). Fig.8 Heat map of factor interaction detection results.BE: bivariate enhance;NE: Nonlinear enhance.Meanings of all parameters in the figure see Table 1 In general,the 91 pairs of interaction effects all demonstrated an enhancement relative to the effects of the individual factors,with no weakening or independent relationship.Of these,43 pairs of interactions presented as bivariate enhancement,denoting the explanatory power of the two factors’ interaction was greater than the explanatory power of two factors acting individually.And 48 pairs of interactions exhibited nonlinear enhancement,denoting that the explanatory power of the two factors’ interaction was greater than the sum of their individual explanatory powers.This finding once again confirmed that PEC in China is the result of multi-dimensional factors acting in concert and supporting each other. Among all the interactions,theqvalue of the interaction betweeneconandpop(econ∩pop) reached the maximum (0.831),followed by the interaction betweennetandpop(net∩pop=0.821).This revealed that population agglomeration accompanied by a high level of regional economy and information technology can best explain the spatial differentiation of PEC in China. Notably,except forwastewater,the interaction effects ofstrwith the other 12 driving factors were all nonlinear enhancement,including the interactions betweenstrandecon(str∩econ=0.694),strandedu(str∩edu=0.464).Although the explanatory power ofstrindividually acting on PEC was minor (q=0.059),it could produce a nonlinear ‘1+1 >2’ effect when interacting with other factors,indicating that the factor ofstrwas still a non-negligible driving force.The interactions betweenpm2.5and other factors under the pollutant emission dimension (pm2.5∩so2=0.209;pm2.5∩wastewater=0.457;pm2.5∩carbon=0.449) were nonlinearly enhanced,suggesting that the PEC would exhibit a dramatic nonlinear growth when several pollutants were coupled.The importance of comprehensively controlling multiple pollutants through integrated environmental governance is self-evident.Furthermore,the interaction betweenpm2.5andedu(pm2.5∩edu=0.434)also demonstrated a nonlinear enhancement effect.Since air pollution was easily perceived by the public,and the improvement of education level will increase the public’s awareness of environmental rights,leading to a nonlinear boost in PEC. Moreover,the explanatory power of the interaction betweenndviandscenery(ndvi∩scenery=0.362) rose by 20.41% and 23.95%,respectively,compared to the individual effects.This manifested that the superposition of high-quality natural resource endowments contributed to the public’s pro-environmental perceptions and behaviors,and then stimulated the formation of PEC.Although the individual effect ofgeron PEC was quite weak (q=0.0686),after interacting with other factors (ger∩econ,ger∩str,ger∩tour,ger∩so2,ger∩pm2.5,ger∩carbon,etc.),their comprehensive driving forces on PEC were greatly strengthened.This can be attributed to the mapping of government environmental policies and economic planning to the regional economic development level,industrial structure,tourism economy,education level,pollutant emissions,and other aspects,which then drove the formation of PEC. Existing PEC studies,generally based on questionnaire data and conducted at the micro-sociodemographic or national level,have some inherent shortcomings in terms of high data acquisition costs,limited sample representativeness and poor spatio-temporal continuity.It is laborious and difficult to obtain these raw data at the prefecture-level or for consecutive years.As a result,few studies have examined the factors influencing PEC in conjunction with macro-statistics.Nowadays,Internet data provide a more effective source for assessing PEC from the perspective of the public’s daily active search.In the era of big data,it has become a common practice to use Internet search data to relate or predict real-world social phenomena,with evidence in fields such as medicine and biological sciences (Ginsberg et al.,2009),economics and finance (Preis et al.,2013). In this paper,we constructed a PEC evaluation index system under the guidance of attitude theory in psychology,and took advantage of Internet big data,i.e.,Baidu Index of environment-related keywords was utilized to establish the index layer,thus realizing the assessment of PEC in consecutive years and finer scales.Unlike most existing studies based on questionnaire data,we refine the scale of the PEC study to the prefecture-level city and realized longitudinal comparisons across years.This advances the development of PEC research in the new period,compared to Liu and Mu (2016) exploration of the factors affecting provincial PEC using data from the 2008 national public opinion survey.Our findings also echo Liu and Mu (2016) speculation that PEC has increased in China in recent years. Although PEC is different from social phenomena in the real world,which are captured at the level of consciousness.Internet search data can be a good indicator of the public’s basic awareness and positive concern for the environment.As there may be inaccuracies in measuring PEC with Internet search data,future studies can compare macro search indexes at certain specific spatial scales with real data obtained from questionnaire sampling there to achieve a more effective assessment of PEC. Although the drivers of PEC are diverse,much of the existing research has only focused on micro-individual elements in the formation of PEC (Liu and Mu,2016).In order to guide the formation of PEC and then successfully support the transition of PEC into public environmental behavior,it is essential to consider the driving forces of PEC at the macro level.To this end,we innovatively examining the multi-dimensional drivers of PEC in China from the perspective of spatial heterogeneity.Based on the empirical findings,we constructed an integrated macro-level driving effect for PEC (Fig.9). Fig.9 The driving forces of the spatio-temporal differentiation of PEC At the dimensional level,the four-dimensional factors of economy,society,pollutant emissions,and ecology play different roles in driving the formation of PEC.Factors in the economic dimension provide the material basis for the PEC formation,while factors in the social dimension imply the social conditions for their formation.Together,they have a major influence on the relative level of PEC.Factors in the pollutant emissions dimension,on the other hand,play the role of sensory stimulation,so that part of the PEC is a passive stress response of the public to pollutant emissions.Additionally,urban ecological factors,as the environmental substrate of public life,can further influence the PEC level through enhanced interaction with economic and social development.At the factor level,the interactions between the factors were all enhanced (nonlinear and bivariate enhancement),indicating that the driving force of each factor on PEC is not isolated,but works in concert and supports each other.These factors work together to influence the formation of PEC. Given the multi-dimensional and interactive nature of PEC drivers,effectively guiding the establishment of PEC is a systematic project.This process requires distinguishing the PEC based on the driving factors.To maximize the promotion of the awakening and raising of PEC brought about by economic growth and social development,and to minimize the public’s passive environmental stress reaction brought about by factors in the pollutant emissions dimension.In other words,after the Chinese government achieves periodic successes in pollution control,it should maintain a high level of PEC by regulating the dominant driving factors in the social and economic dimensions.Moreover,the regional heterogeneity of the driving forces of PEC should be the theoretical basis for the construction of spatial targeting policies. This paper constructed a comprehensive PEC evaluation index system,using the Baidu Index and entropy weighted-TOPSIS to quantify PEC.Furthermore,the ESDA was utilized to reveal the spatio-temporal variation patterns of PEC,and the Geodetector model was performed to identify the multi-dimensional driving factors of PEC and the complex driving effect behind their interaction.The main conclusions can be summarized as follows.In terms of spatio-temporal characteristics: 1) the overall PEC level in China showed a fluctuating upward trend from 2011 to 2018.And the growth of PEC in northeastern China significantly lagged behind that in the eastern,central and western regions.2) The spatial distribution of PEC showed that the high-high cluster areas are mainly concentrated in the quadrant east of the ‘Heihe-Tengchong Line’ and north of the‘Bole-Taipei Line’,while the low-low cluster areas are distributed west of the ‘Heihe-Tengchong Line’ and south of the ‘Bole-Taipei Line’.3) PEC in national central cities were significantly higher than those in neighboring cities.4) The spillover effect of the Yangtze River Delta,Pearl River Delta,Beijing-Tianjin-Hebei and Shandong Peninsula on neighboring cities was obvious. In terms of factor detection: 1) PEC in China was driven by the economy,society,pollutant emissions,and ecology,but the driving force of factors in the ecological dimension was relatively weak.2) The driving effect of factors on PEC varied significantly,and the magnitude of the driving force changed dynamically over time.But in general,the dominant driving factors were economic development level,population size,industrial wastewater,and education level.3) The driving effect of economic development level,urbanization rate,tourism economy,informatization level,population size,SO2,education level,and industrial wastewater on PEC was linearly increasing,while government environmental regulations,vegetation coverage,PM2.5,and natural resource endowment were nonlinear.4) The interaction effects of all factors were enhanced,indicating that PEC was driven by the interaction and combination of multidimensional factors. By utilizing the Internet search index of environmental keywords to characterize PEC,it can satisfy the need for an objective,continuous,and dynamic analysis of PEC with high spatial and temporal resolution.Therefore,the PEC measured in this paper can be regarded as an essential indicator to dynamically identify the green transformation process of Chinese public lifestyles.On the one hand,to assess the degree of PEC more comprehensively and objectively,it is particularly necessary to establish a richer and more reliable keyword system for assessing PEC.On the other hand,to achieve the customization and ongoing acquisition of the cross-platform PEC assessment,it is advised that pertinent departments or research institutes take the initiative to establish links with pertinent Internet businesses. The importance of PEC to the establishment of a multi-layered environmental protection system and its value to the overall green transition of China’s economic growth and social development should be fully explored.The subjects of the implementation of the sustainable development strategy are multiple,including governments,corporations,and individuals.At every stage of sustainable development,people should be both the object of attention and the subject of participation.The overall rise in PEC will provide China with a solid foundation for sustainable development.Such participation is reflected not only in major environmental actions,but also in the daily lives of the public.Therefore,policymakers should fully seize the opportunity of the rising PEC and guide the public to transform their environmental concerns from awareness and cognition into actual external behaviors,such as environmentally conscious consumption and participation.By strengthening laws and regulations and expanding public channels for environmental participation,the public should be safeguarded and encouraged to participate in environmental governance.The PEC will play a positive role in the comprehensive green transition of China’s economic growth and social development.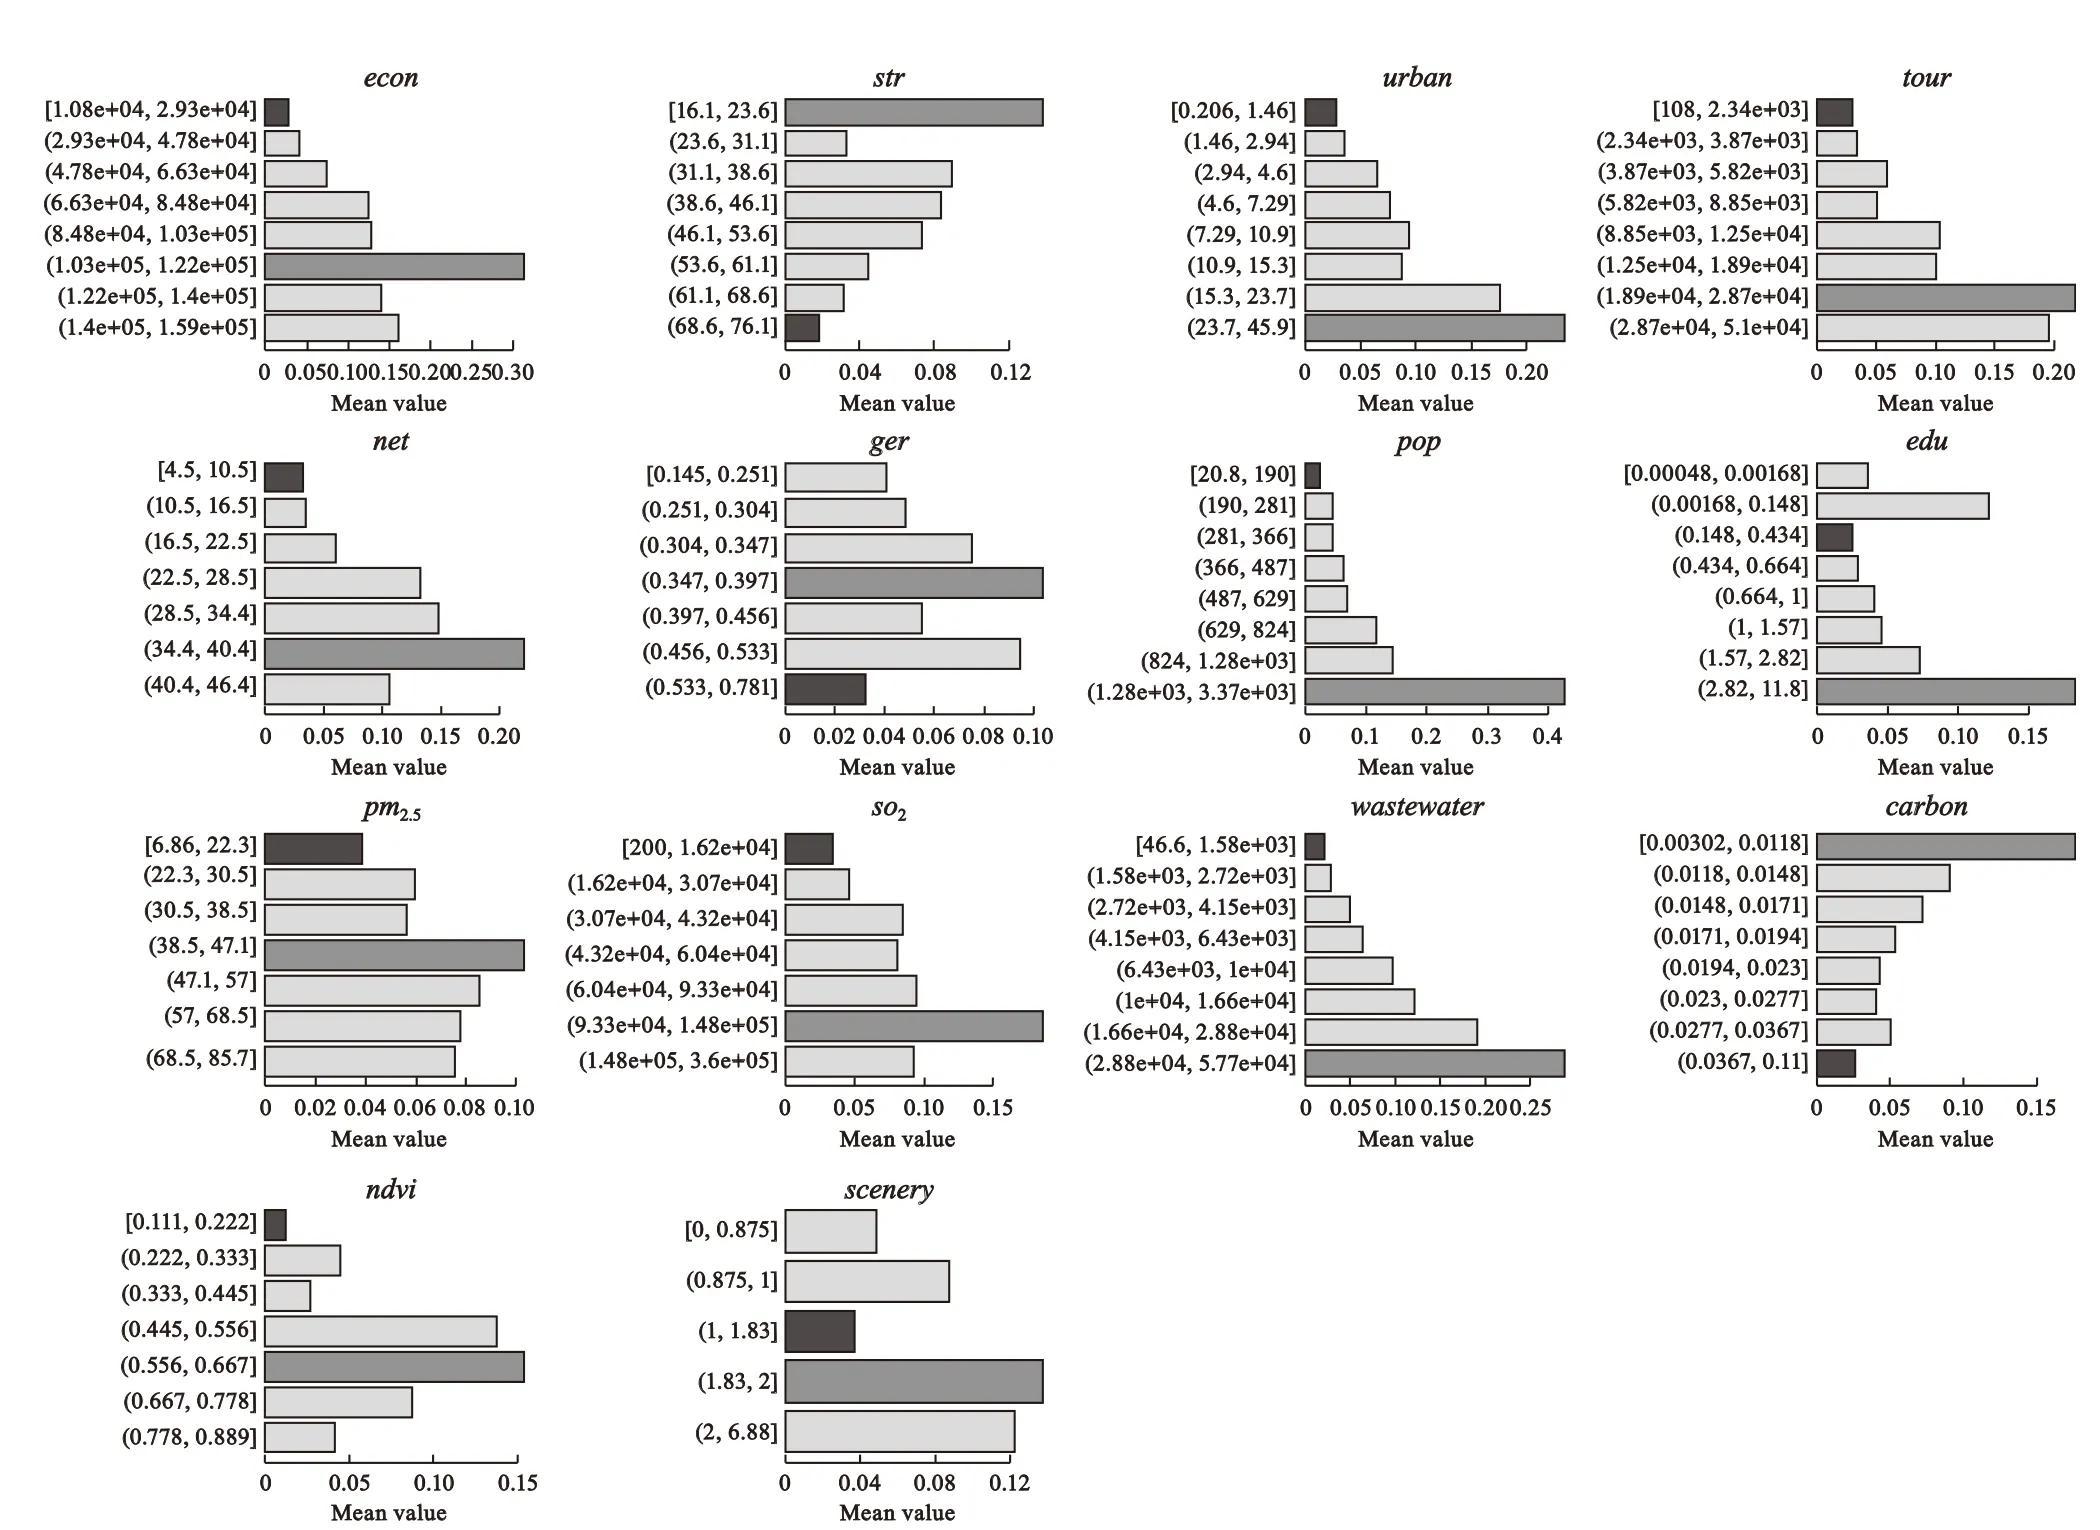

4 Discussion
4.1 Assessing PEC with internet big data
4.2 Driving forces of PEC

5 Conclusions and Implications
5.1 Conclusions
5.2 Policy implications
 Chinese Geographical Science2023年6期
- Chinese Geographical Science的其它文章
- Variations in Surface Urban Heat Island and Urban Cool Island Intensity: A Review Across Major Climate Zones
- Spatiotemporal Evolution Characteristics of Urban Land Surface Temperature Based on Local Climate Zones in Xi’an Metropolitan,China
- Impact of the Urban Heat Island Effect on Ozone Pollution in Chengdu City,China
- Cross-border Urban Networks Based on Manufacturing Global Value Chain: A Study of Listed Companies in Western China
- Spatiotemporal Differences and Classification Regulation of Urbanization Impact on Agricultural Development in Shrinking Areas: A Case Study of 15 Shrinking Cities in Three Provinces of Northeast China
- Leave or Stay? Antecedents of High-level Talent Migration in the Pearl River Delta Megalopolis of China: From a Perspective of Regional Differentials in Housing Prices