
Breeding design in wheat by combining the QTL information in a GWAS panel with a general genetic map and computer simulation
2023-12-25 09:50XiaooWangWeiweiMaoYongfaWangHongyaoLouPanfengGuanYongmingChenHuiruPengJiankangWang
The Crop Journal 2023年6期
Xiaoo Wang, Weiwei Mao, Yongfa Wang, Hongyao Lou, Panfeng Guan, Yongming Chen,Huiru Peng,*, Jiankang Wang*
a State Key Laboratory of Crop Gene Resources and Breeding, Institute of Crop Sciences, Chinese Academy of Agricultural Sciences, Beijing 100081, China
b Frontiers Science Center for Molecular Design Breeding (MOE), Key Laboratory of Crop Heterosis and Utilization, Key Laboratory of Crop Genetic Improvement, College of Agronomy and Biotechnology, China Agricultural University, Beijing 100193, China
c Hainan Yazhou Bay Seed Laboratory, Sanya 572025, Hainan, China
d National Nanfan Research Institute (Sanya), Chinese Academy of Agricultural Sciences, Sanya 572024, Hainan, China
Keywords:Wheat breeding Breeding design GWAS panel General genetic map Computer simulation
ABSTRACT A large amount of genome-wide association study (GWAS) panels together with quantitative-trait locus(QTL) information associated with breeding-targeted traits have been described in wheat (Triticum aestivum L.).However, the application of mapping results from a GWAS panel to conventional wheat breeding remains a challenge.In this study,we first report a general genetic map which was constructed from 44 published linkage maps.It permits the estimation of genetic distances between any two genetic loci with physical map positions, thereby unifying the linkage relationships between QTL, genes, and genomic markers from multiple genetic populations.Second, we describe QTL mapping in a wheat GWAS panel of 688 accessions, identifying 77 QTL associated with 12 yield and grain-quality traits.Because these QTL have known physical map positions, they could be mapped onto the general map.Finally,we present a design approach to wheat breeding by using known QTL information and computer simulation.Potential crosses between parents in the GWAS panel may be evaluated by the relative frequency of the target genotype, trait correlations in simulated progeny populations, and genetic gain of selected progenies.It is possible to simultaneously improve yield and grain quality by suitable parental selection, progeny population size, and progeny selection scheme.Applying the design approach will allow identifying the most promising crosses and selection schemes in advance of the field experiment,increasing predictability and efficiency in wheat breeding.
1.Introduction
Wheat (Triticum aestivum L.) is a major staple food crop in the world.Conventional wheat breeding is based mostly on phenotypic selection of superior genotypes.Because the superior alleles are not directly observed, the selection of target traits is heavily influenced by breeders’ experience.The long breeding cycle and low breeding efficiency increase the challenges to developing superior varieties.Breeding is a process of genetic improvement that involves assembling complementary superior alleles from parental materials to improve yield or quality in new cultivars [1].Applying genetic research mapping results to wheat breeding to improve yield and grain quality is an effective approach[2,3].Peleman and van der Voort[4]introduced the concept of‘‘breeding by design”,which aims to use the superior alleles of target agronomic traits identified in genetic studies.For this purpose, three kinds of genetic information are necessary: identification of loci associated with agronomic traits,estimation of their genetic distances on the genome, and identification of breeding lines carrying the superior alleles.
The essence of design breeding is to pyramid superior alleles located at a number of genetic loci of interest.The more the loci to be selected, the larger is the population size required to ensure with reasonable certainty that a plant with the target genotypes is present[5].Two challenges facing breeders are to identify suitable parents and determine the optimal population size for subsequent breeding cycles to achieve breeding objectives.The thousands of wheat accessions available for breeders offer tens of thousands of parental combinations to choose from.Different crossing and breeding schemes may require vastly differing population sizes[6].Wheat breeding schemes employ hybridization and backcrossing, and homozygous breeding lines are produced by continuous selfing (producing recombinant inbred lines or RILs) or doubled haploid (DH) production and selection [7,8].To overcome the demand for huge population sizes due to the low frequency of target genotypes, Bonnett et al.[6] proposed an F2enrichment scheme featuring two generations of selection to fix the genes at many targeted loci.
Breeding design has been shown to be effective in breeding.Liu et al.[9] developed three novel rice lines with high yield, high quality, and increased brown planthopper resistance by pyramiding 15 genes from five parental lines using rational molecular design.Sub1,salt-tolerance QTL,blast resistance(Pi2,Pi9),and gall midge (Orseolia oryzae) resistance genes (Gm1, Gm4) were pyramided into the Improved Tapaswini, which is a gene pyramid(Xa4, xa5, xa13, Xa21) in the popular indica cultivar Tapaswini[10].Wang et al.[11] used 31 QTL mapped in 65 rice nonidealized chromosome segment substitution lines to investigate alternative methods for increasing the frequency of the target genotype without increasing the total cost of breeding operations.Ma et al.[7] used a DH wheat population derived from an Avalon×Cadenza cross to compare three breeding schemes.These reports show that breeding design is a powerful scheme for improving multiple complex traits.
Computer simulations can be effectively used for comparing numerous approaches and selecting the most efficient breeding scheme to produce a target genotype, saving time, land, and labor costs.Application of population genetics theory and simulation models to pyramiding multiple genes via marker-assisted selection in wheat were studied[5].Yao et al.[12]used 57 fixed wheat lines to simulate 1596 biparental crosses,and predicted wheat yield and quality by performing breeding simulations using various numbers of simulated QTL.To facilitate the efficient integration of the designed approach with conventional breeding, Zhang et al.[13]recently developed a universal platform named Blib, suitable for modeling, simulating, and predicting genetic breeding processes in diploid species.Four case studies were presented to show the application of Blib in both genetic studies and breeding applications: genetic drift of multiple alleles in randomly mating populations, joint effects of neutral mutation and genetic drift,comparison of mass versus family selection, and choice of testers in hybrid breeding [13].
As genotyping costs decrease, more and more studies are devoted to identifying superior alleles in GWAS panels.Many GWAS panels together with QTL and genes associated with agronomic traits in wheat have been reported[14–18].However,there have been few reports on the integration of GWAS results with wheat breeding.Molecular breeding in wheat is facing the challenge of integrating and utilizing mapping results from different populations.Although many genetic maps have been constructed[19–24], they are often not compared, owing to the presence of unshared markers and variations in genetic backgrounds [25].It is then difficult to estimate the linkage between QTL or genes detected in different genetic populations.Our objectives in this study were 1) to construct a general genetic map indicating both genetic and physical positions,2)to identify genetic loci and superior alleles with a wheat GWAS panel,and 3)to present the design approach of wheat breeding by using the known QTL information and parental lines in the GWAS panel.
2.Materials and methods
2.1.Forty-four individual linkage maps and construction of a general genetic map
A set of 44 linkage maps collected from 30 published articles was used to construct the general genetic map(Table S1)that indicates the genetic distance between any two known physical positions of genetic loci.The genetic populations used to generate the 44 maps originated from 10 countries: China, the USA, Argentina, Australia, United Kingdom, Germany, France, Canada, Italy,and Afghanistan, and one international organization (i.e., International Maize and Wheat Improvement Center,known as CIMMYT).The parents of these populations represented major wheat production regions in the world.Some parents originated in the same countries, e.g., Yumai 8679 (China) × Jing 411 (China), and some from different countries, e.g., Mingxian 169 (China) × Centrum(Germany) (Table S1).
DNA markers used to construct the 44 linkage maps were of four common SNP array types: 35K, 55K, 90K, and 660K.Pipeline for the construction of general map is shown in Fig.1.The flanking sequence of SNPs was aligned to the reference genome IWGSC v1.0 by BLAST to identify its physical position on the chromosome, and the SNPs were sorted first by chromosome and then ascendingly by physical position.Genetic distance between markers showed an increasing trend with physical distance.Collinearity between genetic and physical positions of some markers was inconsistent with the collinearity of markers along the entire chromosome(Fig.S1A).To reduce the impact of inconsistent collinearity between genetic and physical map positions, those markers were removed if the genetic distance between adjacent SNPs was too small.To avoid the removal of too many markers, a threshold of-3 cM was used to achieve a satisfactory filtering effect(Fig.S1B).On average,79%of markers were retained after filtering(Table S1).In some linkage maps, one chromosome was divided into multiple linkage groups, a common phenomenon in linkage map construction (Fig.S1B).The correspondence between genetic and physical distances, and between markers also varied among chromosomal regions.After the filtering step, some genetic or physical distances between markers might be unreasonably large.To address this issue, two adjacent SNPs were assigned to distinct linkage groups when the genetic distance between them was greater than 5 cM or their physical separation was greater than 5 Mb.Genetic distance between 1-Mb intervals was calculated with a window size of 2 Mb and a sliding window of 1 Mb.When the 44 genetic maps were corrected by above process,genetic distances of 1 Mb interval less than Q1-1.5×IQR or greater than Q3-1.5×IQR in the genetic maps were excluded as outliers.Mean genetic distance of the 44 linkage maps within 1 Mb was calculated for all chromosomes.
2.2.A wheat GWAS panel for QTL and superior-allele discovery

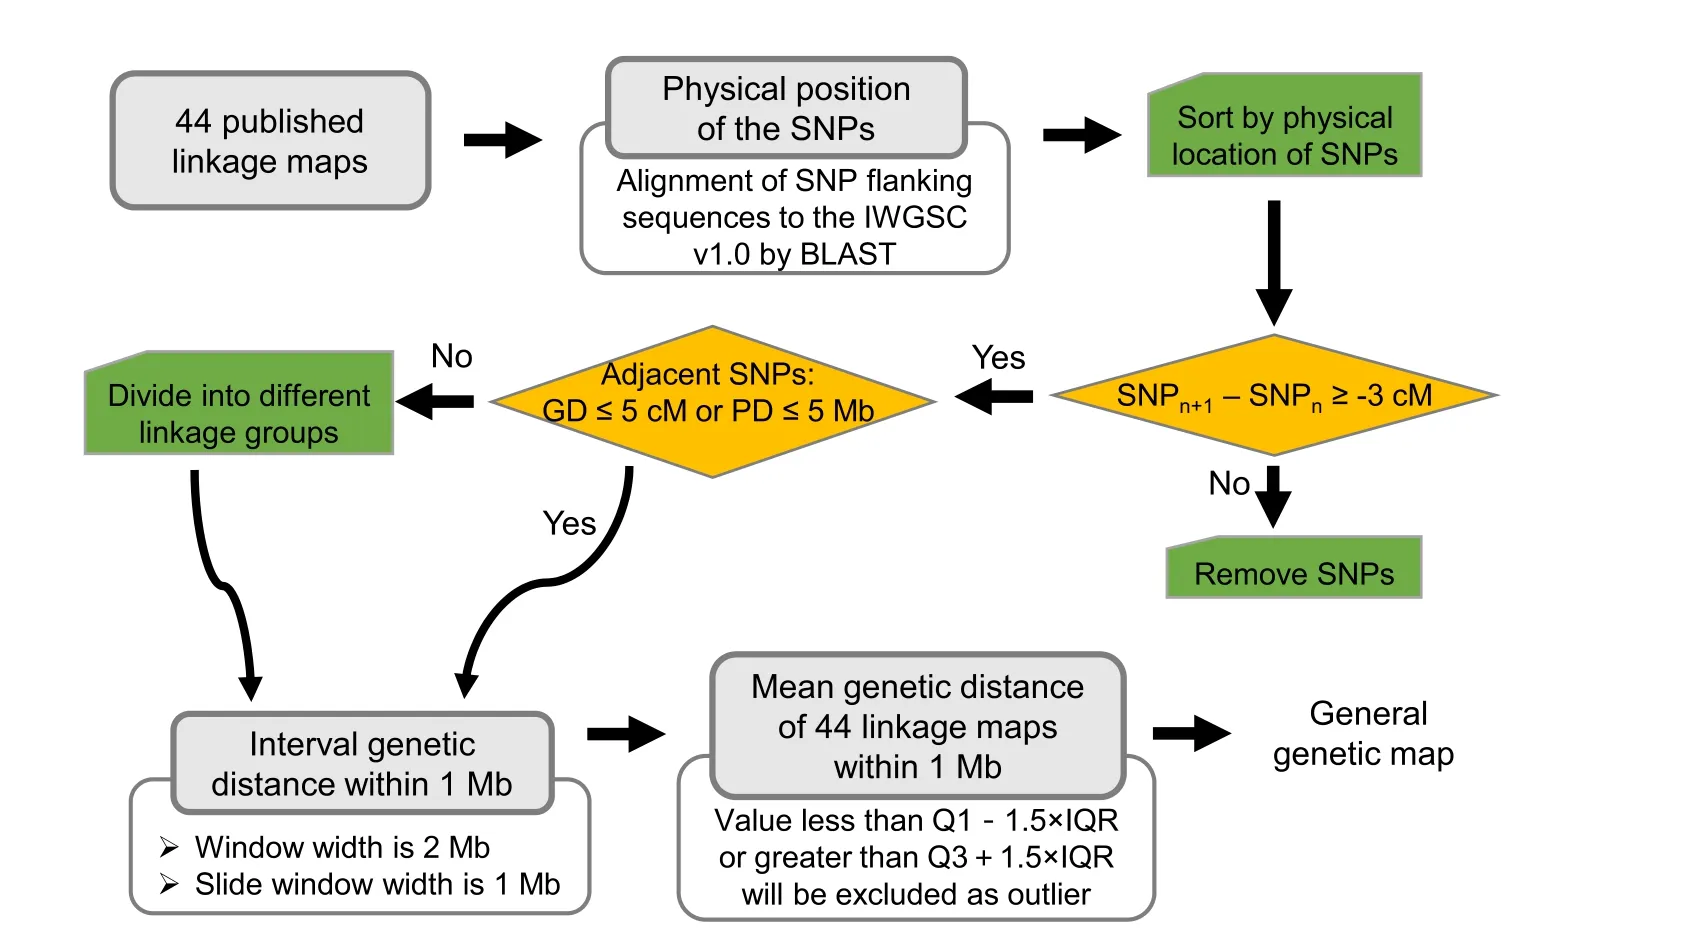
Fig.1.Schematic diagram showing the construction of general genetic map.The procedure combined 44 linkage maps from 30 published articles(Table S5).SNPn+1 and SNPn represent adjacent SNPs sorted by physical map position.GD, the genetic distance between adjacent SNPs; PD, the physical distance between adjacent SNPs.Q1, the first quartile; Q3, the third quartile; IQR, interquartile range.

The 688 accessions in the panel were genotyped with the Illumina iSelect 90K SNP array [28].After filtering (minor allele frequency > 0.05, and missing rate < 10%), 20,065 high-quality SNPs were used to estimate linkage disequilibrium (LD) and perform GWAS using TASSEL(version 5.2)[29].GWAS was performed with SNP markers and phenotypic data on FSN, TSN, SL, GL, and GW, using a mixed linear model (MLM) incorporating population structure and kinship coefficients as described previously [26,27].The first five principal components were used to estimate population structure (Fig.S2), which explained 20.84% of the total variation.To combine the GWAS results across environments, the criterion of selecting the P-values in the bottom 10% was adopted.Co-localization across environments was used to reduce the risk of false positives and highlight the importance of QTL.A threshold of–log10(P) = 3 was set to declare significant marker–trait associations.LD was estimated by the mean squared allele frequency correlations(R2)between pairs of SNP markers using TASSEL with the parameters-ldWinSize 50 for the A, B,and D subgenomes and the whole genome.The physical distance corresponding to R2>0.2 was adopted as the confidence interval of a detected QTL.Quantile–quantile and Manhattan plots were drawn with the R package CMplot(https://github.com/YinLiLin/CMplot).Alleles with positive additive effects leading to the increased phenotype value were called superior, and those leading to the decreased phenotype value were called inferior.Allelic effects were estimated using TASSEL.
2.3.Calculating the frequency of target genotypes and least population size
In breeding,efficient allocation of resources is crucial to achieve a high probability of success without consuming more resources than necessary.One consideration is the least population size required to ensure the presence of at least one target genotype in the progeny individuals.The least population size required for a breeding program depends on the frequency(f)of the target genotype.In wheat breeding, the ultimate line should be homozygous at all genetic loci.However, the target genotype in earlier generations of breeding may be either homozygous or heterozygous at one or more loci.At a single locus,the homozygote of the superior allele may be represented by AA, the heterozygote by Aa, and the homozygote of the inferior allele by aa.If the breeding scheme involves F2enrichment, the target genotypes consist of homozygotes (AA) and heterozygotes (Aa) in the F2.The frequency of the target genotype can be calculated for various breeding schemes assuming biallelic loci according to Mendelian principles(Table S4).In all examples, uppercase letters represent superior and lowercase letters inferior alleles.For multiple loci,genetic linkage, representing recombination between loci, is another factor affecting the least population size.Breeding schemes must consider the linkage between alleles in either the coupling or repulsive phase.It is assumed that there is no interference during meiosis,so that multiple crossovers can occur in large chromosomal interval.When the genetic distance is provided, recombination fraction can be calculated by Haldane’s mapping function [30], i.e.,where r represents the recombination fraction and m the genetic distance in centiMorgans (cM).The theoretical frequency of the target genotype in various breeding schemes is described in Table S5.
In the case of a given frequency of target genotype, probability that the target genotype is not present in a breeding population of size N is equal to(1-f)N.The presence of at least one target genotype is guaranteed with a probability of 1-α, where α is the failure probability of detecting the individual with the target genotype in the population.The least population size can thus be calculated as N =log10α/log10(1-f)[5].When the target genotype is not present in a progeny population, the breeding objective is impossible to achieve.Accordingly,it is necessary to control this probability at a very low level.In all examples,a probability of α=0.01 was used.
2.4.Breeding schemes
Twelve breeding schemes were considered, with the goal of having at least one target genotype in the final generation(Fig.S3).These schemes can be classified into two categories:one-stage and two-stage.The one-stage schemes involved DH or RIL derived from F1, BC1F1or BC2F1without enrichment (E),whereas the two-stage schemes used DH or RIL generated from the enriched F2, BC1F2or BC2F2.The twelve schemes were named as F1DH, F1RIL, BC1DH, BC1RIL, BC2DH, BC2RIL, F2EDH, F2ERIL, BC1-F2EDH,BC1F2ERIL,BC2F2EDH,and BC2F2ERIL,respectively.A generation was defined as the interval from seed to plant maturity in simulation.
2.5.A computer tool to identify complementary parents and the least population size
Major concerns during the breeding process include parent selection, breeding schemes, and suitable size of progeny population [4,5].We developed a computer tool based on R (https://github.com/XiaoboMM/Parental-Selection-Tool), named as Parental Selection Tool (PST), to assist in breeding design in wheat.The tool comprises two modules: selection of candidate parents and estimation of progeny population size in various breeding schemes.PST requires three input files: QTL or gene information with associated trait and physical map position, genotypes of QTL or genes in a parental population with superior or inferior alleles, and the general genetic map constructed in the present study.To use PST, parents to be improved must be provided.The first module, CandidateParentSelection, selects candidate parents to pyramid as many complementary superior alleles as possible in progeny.Genotypes of selected candidate parents and the provided parents are displayed in a mosaic plot indicating the distribution of superior and inferior alleles.Candidate parents are then used as the input to the second module,PopulationSizeEstimation,to estimate the least population size required for a given probability of success in obtaining the target progeny individuals by various breeding schemes.PST accepts the character format of genotypic data in numeric codes of 0, 1, and 2, representing respectively missing,superior, and inferior alleles.
2.6.Simulation of progeny populations and selection procedures in the Blib platform
For more complicated linkage relationships and genetic-effect models,breeding simulation tools must be used.Blib together with its application module ISB has the potential to benefit breeding design by simulating and predicting outcomes in many scenarios,and identifying the optimum selection and crossing schemes[13].ISB was used to simulate the progeny of bi-parental crosses.The simulated progeny populations under no selection were employed to investigate the correlations between target traits.IBS was also used to simulate the process of progeny selection and to predict the extent to which traits are improved, determine suitable parents for improving a variety, and identify the optimal breeding schemes.For each bi-parental cross, the 12 breeding schemes described previously were simulated and compared.Two kinds of progeny populations occurred in the 12 schemes.One was composed of 1,000 DH lines, each generated from F2,BC1F2, and BC2F2, and the other was composed of 5,000 RILs, each generated from F3, BC1F3, and BC2F3.Independent culling-level selection was performed on phenotypes of multiple target traits.Each breeding scheme was run for 100 times and the mean performance was calculated.
3.Results
3.1.Collinearity of genetic with physical positions on the general genetic map
In most GWAS panels genotyped by SNP arrays, only the physical positions of SNPs are known, and GWAS panels alone are not suitable for establishing the linkage relationships between markers.To estimate the linkage relationship between significant SNPs identified by GWAS, the collinearity relationship between genetic map and physical map is necessary.Recombination rates on the general map were generally consistent with those on the individual linkage maps constructed using bi-parental populations.There was a higher rate of recombination in the distal regions of chromosomes and a lower rate around the centromeres (Fig.2; Table S6).The mean ratio of genetic to physical distance in 50-Mb intervals from both ends of the 21 chromosomes was 0.66 cM/Mb, but that in the 200-Mb regions surrounding the centromeres was only 0.004 cM/Mb.Chromosomes 1A, 2A, 3A, 4A, 6A, and 7A showed rare recombination events (Table S7).When target genes are located near centromeres, recombination is unlikely to occur even if the physical distance between genes is 200 Mb.However, we observed an abnormally high recombination rate in the 578–647-Mb region and an abnormally low recombination rate in the 648–686-Mb region on chromosome 4A (Fig.2).
Previous studies in soybean [31] suggested that recombination occurs mainly in gene regions.In multiple chromosomal regions,the changes in recombination rate were highly correlated with changes in gene density (Fig.S4).Collinearity analysis of T.urartu(AA) and T.aestivum (AABBDD), revealed a translocation event in which the end of the long arm of chromosome 4A was translocated to the end of its short arm,and a segment from the end of the short arm of chromosome 7 was appended (Fig.S5).Previous reports[32,33] indicated that the translocation event occurred during the formation of T.dicoccoides (AABB), and one segment from 7BS was translocated to the long arm of 4A.These findings suggested that translocation events that occurred during evolution were reflected on the general genetic map.
3.2.Phenotypic distribution and correlations in the GWAS panel
FSN, TSN, and SL are spike-related traits;TGW, GL, and GW are grain-related traits; GPC, WGC, and GSC are nutritional-quality traits;and DST,WA,and GH are processing-quality traits.Each trait investigated in the GWAS panel showed abundant variation(Table S8).Coefficients of variation for the 12 traits ranged from 0.05% (GW) to 14.57% (DST).Changes over different periods of wheat breeding were compared using the best linear unbiased prediction(BLUP)values of the phenotypic data(Fig.S6).FSN and TSN decreased from the landraces to the 1980′s, then increased again from the 1980 s to the 2010 s, while SL tended to decrease.TGW and GW increased across all periods of the breeding process.Overall, GPC and WGC decreased while protein content increased during previous breeding efforts.There was no obvious trend in the three processing-quality traits, indicating that Chinese wheat breeders had not prioritized the selection on processing-quality in the past.

Fig.2.The general genetic map of the 21 wheat chromosomes.Vertical red dotted lines indicate centromeres of chromosomes.
Phenotypic correlation coefficients based on BLUP values across all environments for the twelve traits ranged from -0.93 to 0.97 (Fig.S7).The 12 traits associated with spikes, grain,nutritional-quality, or processing-quality tended to be correlated within their respective classifications (Fig.S7).Although there were significant correlations between some yield traits (including spike and grain traits) and quality traits (including nutritionalquality and processing-quality traits), these correlations were relatively weak, with the absolute values of pairwise correlation coefficients less than 0.21.Some processing-quality traits showed significant correlations with nutritional-quality traits, but only WGC and DST showed a correlation of 0.26, while the absolute values of correlation coefficients between other traits were less than 0.20.
Based on the correlation analysis, we selected one trait each from the classifications of spike (FSN), grain (TGW), nutritionalquality (GPC), and processing-quality (DST) to further illustrate the breeding advance in the collected germplasm resources.Performance of accessions at the top 10%BLUP values for TGW,FSN,GPC,and DST is displayed in Fig.3A–D.There was no accession showing superior performance (in the top 10% of phenotypic values) for all four traits(Fig.3E).Twenty-six accessions showed superior performance for two traits.Most accessions showed superior performance for only one or two traits, leaving space for improvement in other traits.
3.3.QTL information detected in the GWAS panel
QTL information and allelic distribution in parental materials are prerequisites in breeding design.Association mapping was performed in the GWAS panel for five traits(FSN,TSN,SL,GL and GW)across all environments.We identified 84 stable SNP-trait associations that were significant in at least three environments (Fig.S8;Table S9)and used them for further analysis.LD decay was used to differentiate pleiotropic and linked QTL (Fig.S9).Two significant SNPs associated with the same trait were considered to be the same QTL if their physical distance was less than the LD decay distance of the subgenome in which they were located.A total of 33 environmentally stable QTL were established from the 84 significantly associated SNPs.Seven QTL were consistent with previously reported loci (Table S10).
In addition to QTL identified in previous studies[26,27],77 QTL were associated with the 12 traits(Fig.S10;Table S11),which were then used for breeding design in this study.For convenience, QTL were renamed and assigned by the standard nomenclature (letter Q followed by the abbreviated name of the trait and the chromosome involved), and different QTL for the same trait on the same chromosome were distinguished by Arabic numerals according to their order on the chromosome.Genotypic data of the GWAS panel at the 77 QTL have been deposited in GitHub (https://github.com/XiaoboMM/Parental-Selection-Tool).
3.4.Candidate parents for the improvement of yield and quality
Wheat breeders aim to improve yield and quality traits simultaneously.To increase the efficiency of breeding programs, identifying the best crosses and their parents is crucial.PST was used to identify the candidate parents for the genetic improvement of two cultivars, i.e.Nongda 179 and Yangao 21.Nongda 179 has superior performance for quality traits (GPC and DST), but is inferior for yield traits (FSN and TGW).In contrast, Yangao 21 has superior yield but inferior quality (Fig.3F).Five candidate parents(Pingan 6, Longmai 212, Lankao 926,CHD5O3,and Luzi 238) were identified for the improvement of Nongda 179 (Fig.4A), based on maximizing the number of complementary superior allele for the target traits between Nongda 179 and the candidate parents,while minimizing the number of differential alleles for the remaining traits.Similarly, five other candidate parents (Taishan 9818, Xiaoyan 216, Kenong 2009, Zhoumai 19, and 97Y55) were identified for the improvement of Yangao 21(Fig.4B).The specific parameter settings can be viewed on GitHub(https://github.com/XiaoboMM/Parental-Selection-Tool).
All candidate parents for Nongda 179 except CHD5O3,provided two complementary QTL with superior alleles for FSN.For TGW,CHD5O3 provided three complementary QTL, while the other four candidate parents provided two.The five candidate parents each provided 5 to 7 complementary QTL with superior alleles for DST.For GPC, only Kenong 2009 provided one complementary QTL with a superior allele.These results suggest that the candidate parents could be used for crossing and developing new wheat varieties with improved yield and quality.
3.5.Suitable size of progeny populations in breeding
Optimal size of progeny populations can assure the achievement of breeding target at a high level of probability, while controlling expense.As shown in Table 1, when the same breeding scheme was applied, there were large differences in the required progeny size for different crosses.Even if the same parents were used, different breeding schemes could demand vastly different population sizes.The required number of progeny increases exponentially with the increased numbers of backcrosses, becoming impractical in breeding.After use of F2enrichment, the least population size needed for breeding scheme F2EDH or F2ERIL was reduced from tens or hundreds of thousands to hundreds or thousands, feasible sizes in breeding practice.Although the population size required for scheme BC2F2EDH or BC2F2ERIL was only a few hundred or thousand, the size required by BC2F2Ereached tens of thousands or even millions after two backcross generations(Table S12).Thus, the cost of accumulating multiple favorable genes by backcrossing increases exponentially with the number of target loci (Fig.S12).It was not feasible to obtain the target genotype in the cross combination of Nongda 179 × Luzi 238, as indicated in Table 1.This failure was due to the lack of recombination between QFsn.1B.1 and QTgw.1B.2, which are separated by a genetic distance of 0 cM, resulting in the complete linkage drag(Fig.4; Table S11).It was impossible to improve simultaneously both TGW and FSN by the cross combination Nongda 179 × Luzi 238 through this locus.
3.6.Breeding design for the improvement of Nongda 179
To investigate the possibility of simultaneously improving yield and quality traits, we evaluated the correlations between traits in progeny populations by crossing Nongda 179 separately with its five candidate parents.In the simulated progeny, performances of 5000 RILs were predicted by genetic and genotypic information detected in the GWAS panel, based on which the correlations between traits were calculated.Even if some quality traits in the GWAS panel showed negative correlations with yield traits, such as FSN and GPC (-0.20), TGW and GPC (-0.10), these correlations were not always observed in all progeny populations (Table 2;Fig.S7).For FSN and GPC,progenies of all crosses displayed no correlation.For TGW and GPC, three of the five progenies of crosses exhibited no correlation, while one cross combination showed a significant positive correlation.An absence of correlation or a positive correlation indicates that it is feasible to achieve high-yielding and high-quality simultaneously through the appropriate parental selection and progeny screening.
For each cross of the five candidate parents with Nongda 179,independent selection on FSN, TGW, GPC and DST was conducted in progeny populations of 1000 DH lines derived from F2, BC1F2and BC2F2.In the selection,each trait has the same selected proportion at 20%, and the selected DH lines were used to calculate the genetic gain.In progeny populations of 5000 RILs derived from F3, BC1F3, or BC2F3, independent selection on FSN and TGW was first applied in the F3generation, where each trait has the same selected proportion at 10%.Another round of independent selection on GPC and DST was followed in advanced generation, where each trait has the same selected proportion at 20%.Enrichment was also performed in the F2,BC1F2or BC2F2generation to increase the frequency of target genotypes(Fig.S3).Results given in Fig.5 indicated that crossing Nongda 179 with the five candidate parents resulted in progeny lines with improved FSN and TGW, and other quality traits were maintained or slightly improved.Owing to the large population sizes required during the enrichment stage,some cross combinations using both enrichment and backcrossing breeding schemes failed to yield the target genotypes(Figs.5, S13; Table 1).Based on the least population size and performances of the selected progeny, the most suitable parents for the improvement of Nongda 179 were identified as Pingan 6 and Longmai 212.
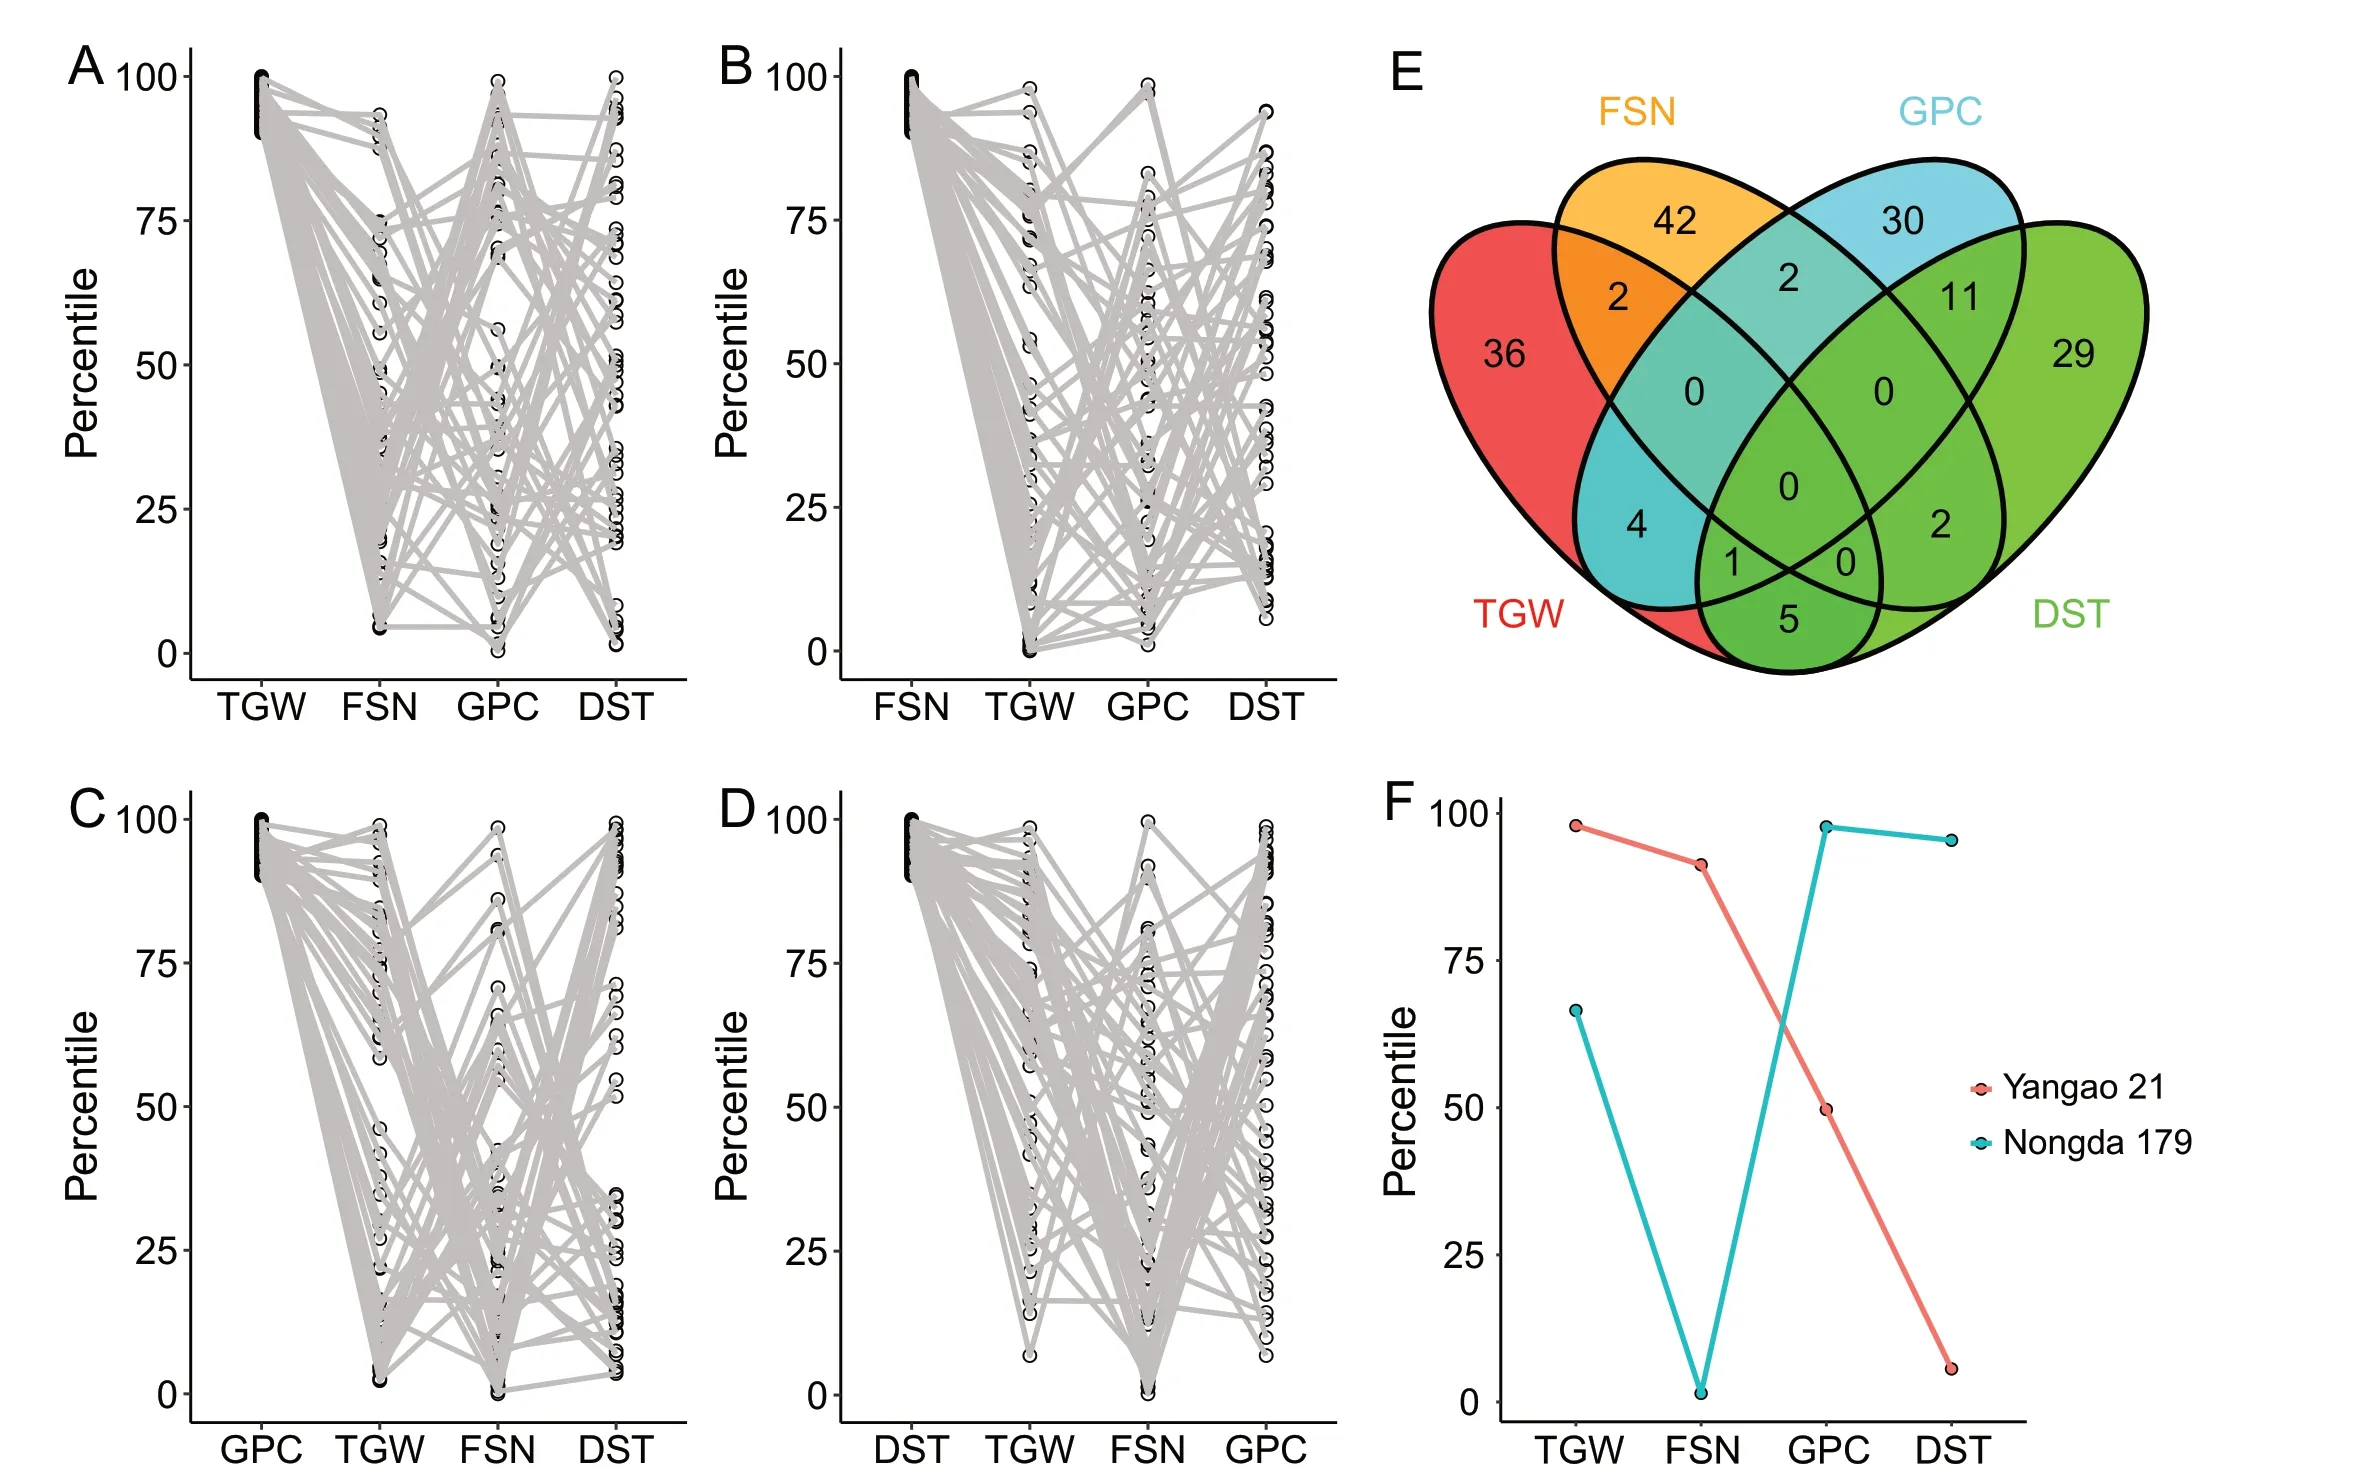
Fig.3.Performance of fertile spikelet number per spike(FSN),thousand-grain weight(TGW),grain protein content(GPC)and dough stability time(DST)in the GWAS panel.Accessions with the top 10%phenotype values for TGW(A),FSN(B),GPC(C)or DST(D)for other traits;(E)Venn diagram of accessions with the top 10%phenotypic values for each of the four traits.(F) The performance of Yangao 21 and Nongda 179 for the four traits.
3.7.Breeding design for the improvement of Yangao 21
In the five progeny populations generated by crossing the other five candidate parents with Yangao 21, four displayed no correlation between FSN and GPC,and one(Yangao 21×Zhoumai 19)displayed a positive correlation (r = 0.26) (Table 2), even though the two traits was negatively correlated(r=-0.20)in the GWAS panel.As another example, TGW and DST were positively correlated(r = 0.15) in the GWAS panel, but negatively correlated(r = -0.22) in the progenies of cross Yangao 21 × Kenong 2009.Most genetic parameters, such as genetic variance, heritability,and correlation, are population-dependent.Once gene effects and allelic distributions in a parental population are detected by genetic studies, various progeny populations can be simulated and genetic relationships and breeding potentials can be evaluated.As shown in Table 2, when the cross Yangao 21 × Zhoumai 19 is made, FSN and GPC can be both improved more easily than when the other four crosses are made.
The 12 schemes with similar selection procedures were applied in crossing Yangao 21 with the other five candidate parents.Simulation results as shown in Fig.5 showed that crossing Yangao 21 with any one candidate parent resulted in progeny lines with improved DST as well as maintenance or improvement of two other yield traits.Based on the least population size and performances of the progeny plants (Fig.5; Table 1), Yangao 21 can be more efficiently improved by making crosses with Taishan 9818 and Xiaoyan 216.
4.Discussion
4.1.Wider applications of the general genetic map constructed in this study
As the number of published genes and QTL associated with traits increases rapidly, the challenge for breeders is how best to apply this knowledge to increase the efficiency of crop improvement and increase genetic gain.One limitation is how to determine the genetic distance (corresponding to the recombination rate)between genes or QTL identified from various sources of populations.To address this issue,we present a general genetic map that includes both physical and linkage positions of SNP markers,based on collinearity between genetic and physical maps.The general map constructed in this study used four types of SNP arrays,i.e., 35K, 55K, 90K, and 660K.Owing to polymorphic differences between parents of mapping populations,markers used in genetic map construction are different, even if the same SNP array was applied.Even for the same markers, genetic distances vary across populations.The general map provides genetic positions of QTL or genes detected with diverse populations and methods and can be used to select candidate parents and estimate the progeny population size.

Fig.4.Distribution of alleles associated with QTL for fertile spikelet number per spike(FSN),thousand-grain weight(TGW),grain protein content(GPC)and dough stability time(DST)in(A)Nongda 179 and(B)Yangao 21,with five other selected parents.Y axis shows accession names.X axis shows QTL names.Blue,red and gray color represent superior, inferior and missing alleles, respectively.
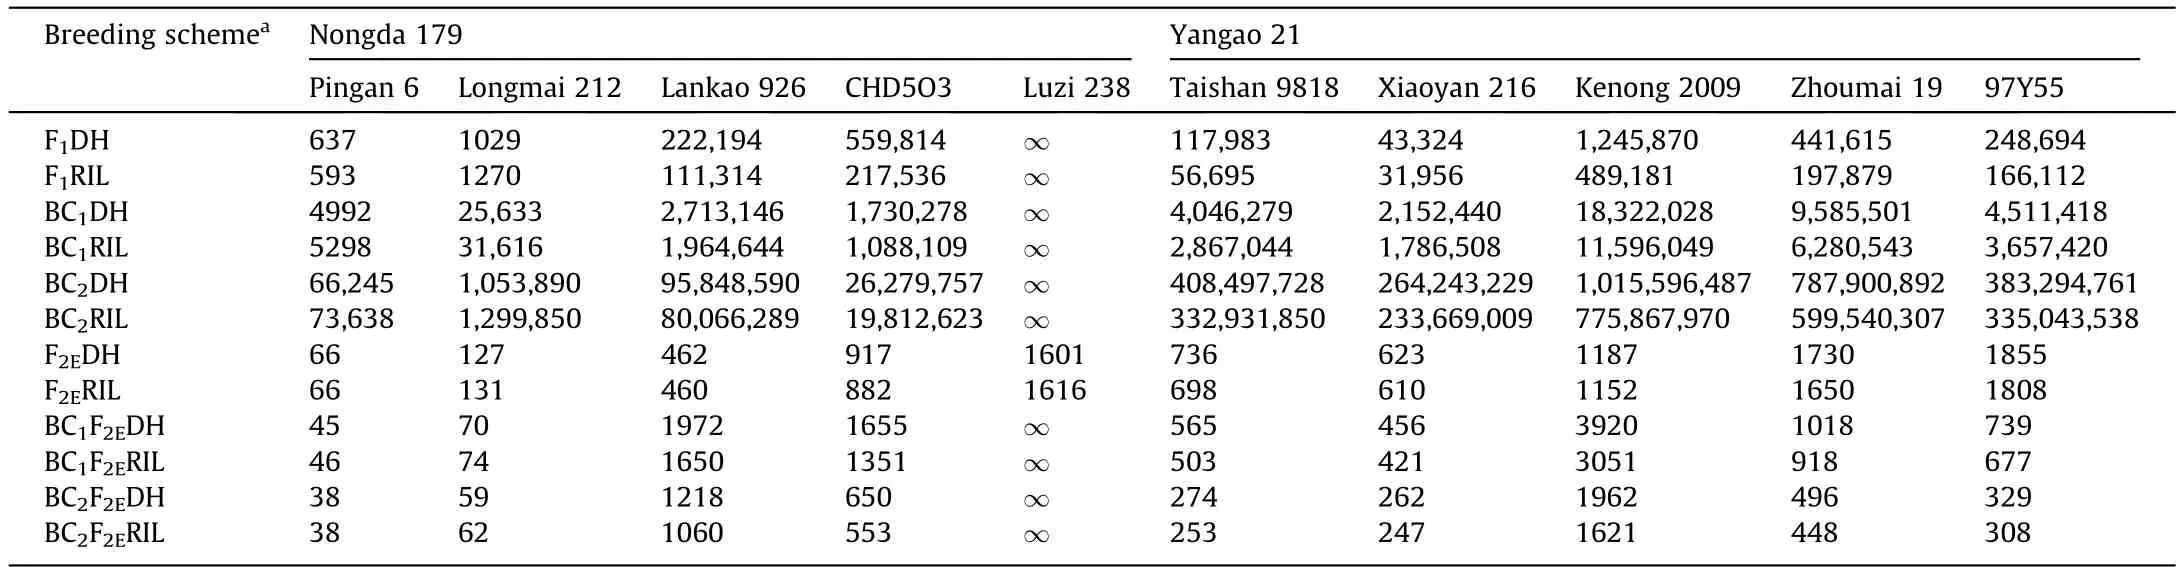
Table 1 Least population size required to obtain at least one target genotype (α = 0.01) in various progeny populations when using Nongda 179 and Yangao 21 as one parental line.
As a wider application, the general map constructed in this study can reflect some chromosomal rearrangements occurring during the evolution of wheat.The physical region from about 648 Mb to 686 Mb on 4AL, originating from a translocation of the end of chromosome 7BS, shows almost no recombination, but a relatively normal recombination(about 0.95 cM/Mb)on chromosome 7BS(Fig.2;Table S6).Naranjo et al.[34]reported that in the absence of expression of the Ph1 gene, which precludes pairing of homoeologous chromosomes, chromosome 4A paired not only with a homoeologous group 4 chromosome but also with the short arm of a homoeologous group 7 chromosome, whereas 5A paired with the long arm of homoeologous group 4.The pairing of 4A with7B and 5A could influence recombination in this chromosomal segment.We observed ‘‘abnormal” recombination rates in chromosome segments of 5AL, 5BL, 5DL, and 6BS (Fig.S14), while detecting no chromosomal rearrangement event in those segments.Further research is needed to reveal the underlying cause of this phenomenon.

Table 2 Correlations in the GWAS panel and 5,000 RILs obtained from 5 bi-parental crosses using Nongda 179 and Yangao 21 as one parental line.
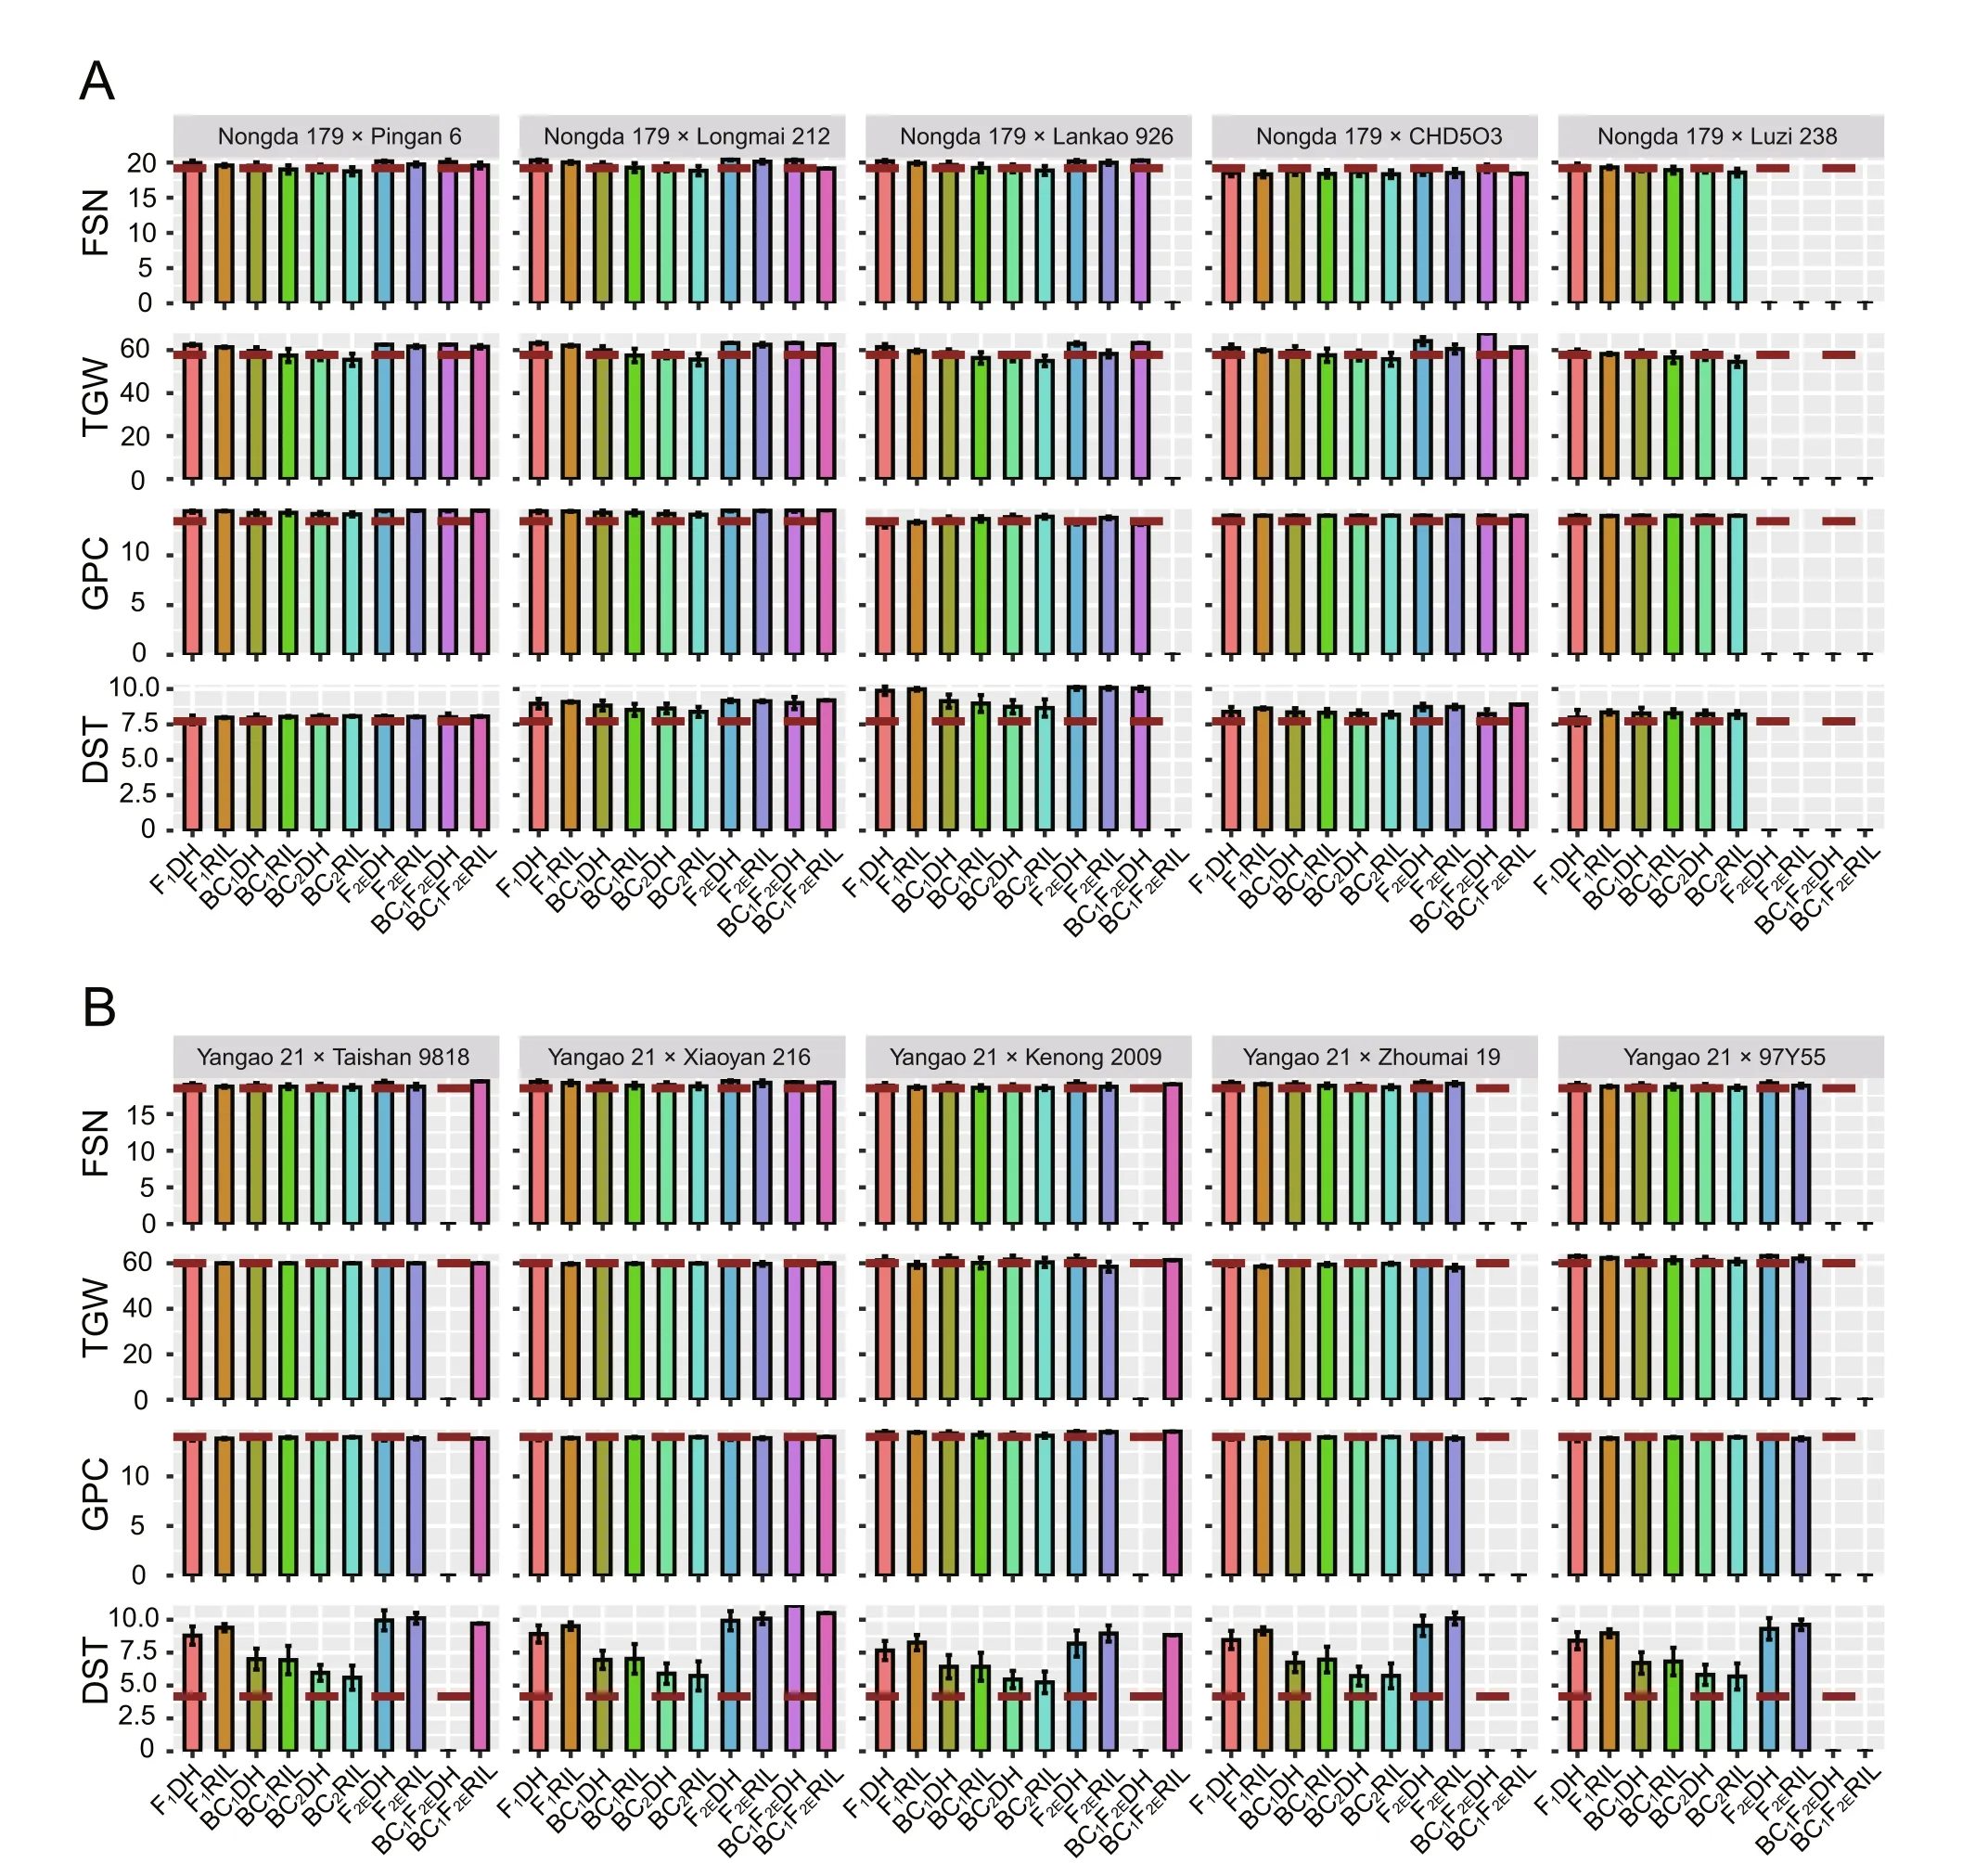
Fig.5.Mean performance of the final selected individuals when two parental lines(A)Nongda 179 and (B)Yangao 21 were crossed with five other candidate parents from different breeding schemes.The absence of a bar indicates that the cross combination carries no target genotypes.FSN, fertile spikelet number per spike; TGW, thousandgrain weight; GPC, grain protein content; DST, dough stability time.
4.2.Factors affecting the designed approach of wheat breeding
Pleiotropy and closely linked genes contribute to phenotypic correlations[35–37].Clustering of QTL across the genome revealed that they were not distributed randomly on wheat chromosomes(Fig.S10), a finding consistent with previous reports [16,38].To view the genetic architecture of correlations, an association network was constructed.The network showed that QTL associated with most traits were connected (Fig.S15).QTL controlling spike,grain, nutritional-quality, or processing-quality traits were more closely linked.Yield and quality are two primary considerations in wheat breeding, and we identified a cluster of QTL (QGw.5A.1,
QTgw.5A.1, QDst.5A.1, QWa.5A.2, and QGh.5A.2) on chromosome 5AL, associated with five traits, suggesting one pleiotropic gene or multiple closely linked genes regulating grain and quality traits.
Some QTL were separated by a large physical distance but a small genetic distance.There was a 142-Mb physical distance but only a 2-cM genetic distance between QTgw.1B.1 and QGpc.1B.(Fig.2; Table S11).Based on Haldane’s mapping function, the recombination rate between the two QTL was only 0.019.Thus, it would be challenging to obtain recombination of superior alleles for the two closely linked QTL if an allele at one QTL was present as a superior allele and the allele at the other was inferior.It is crucial to consider the candidate parent’s haplotype of superior alleles.Accordingly, the candidate parent should be selected for the recombination of type 1 superior alleles(Fig.S11)and crossed with other parent genotypes such as type 1,2,or 3 for further improvement.Gene editing, which has progressed in recent years [39,40],might be used to break tight repulsion linkages between superior and inferior alleles.
As the number of target loci increases or the distance between linked loci decreases, frequency of the target homozygous genotype decreases, and a much larger progeny population is needed to ensure the presence of the target genotype (Fig.S16).If there are 10 unlinked loci segregating between two wheat parents and a DH or RIL population is derived from the F1of the biparental cross, at least 4714 (α = 0.01) DHs or RILs are necessary to obtain at least one line of target genotype.The least population size is 24,775 (α = 0.01) when there is one pair of loci linked at a genetic distance of 5 cM,and 130,181(α = 0.01)when there are two pairs of linked loci at 5 cM (Fig.S16C).Backcrossing has been widely used in breeding[14], but when each parent has a similar number of target superior alleles,the population size increases rapidly with the increase in backcross generations (Fig.S12).Although F2enrichment can reduce the least population size, it still requires 19,870 BC2F2plants when five unlinked superior alleles are to be introgressed from the donor into the recurrent parent (Fig.S12).Breeding schemes should be appropriately chosen for specific crosses to reduce the population size, thereby achieving breeding objectives under limited-resource conditions.Breeders typically focus on a few traits and improve them through multiple cycles of breeding.If there is a large genetic background difference between parents,many loci are in segregation,making it challenging to obtain the target genotype.For this reason,breeders tend to avoid crossing parents with too-large differences in phenotype or growth habits.
4.3.Perspectives of the designed approach in wheat breeding
Breeding design that optimizing crop genomes by accumulating superior alleles and purging inferior alleles will be critical for developing future cultivars [41,42].It is impractical to pyramid all superior alleles because of pleiotropy.Certain superior and inferior alleles may never be separated,and the tradeoff between traits must be considered [43,44].Grain number and grain weight are major components of grain yield in wheat.Xie and Sparkes [45]described the tradeoff of grain number and grain weight by the AGP2 gene, which encodes ADP-glucose pyrophosphorylase and affects TGW.However, the gene has the effect at the opposite direction on grain number,indicating a tradeoff and negative pleiotropy at the gene level.Meta-QTL analysis [16] revealed that genetic loci associated with grain number coincided with those for grain weight,indicating a tradeoff of the two major yield components at the genome level.However, Calderini et al.[46] found that overexpression of an α-expansin in early developing wheat seeds led to a significant increase in grain weight without a reduction in grain number, resulting in an 11.3% increase in grain yield under field conditions.Although there was a negative correlation between FSN and TGW, it was relatively weak (r = -0.15) in the GWAS panel (Fig.S7), suggesting that it may be possible to overcome the tradeoff between grain weight and number to increase yield potential in wheat.Grain yield and grain quality are usually negatively correlated [47], but the Gpc-B1 or NAM-B1 gene has been reported [48] to improve GPC without reducing grain yield in wheat.
Correlation between yield and quality traits was relatively weak in the GWAS panel (Fig.S7).The correlation in the progeny populations generated from the hybridization of Nongda 179 and its five candidate parents,as well as Yangao 21 and its five candidate parents,could be characterized as no or even positive correlation.It is suggested that there are opportunities to remove the bottleneck to grain yield and quality improvement by cross prediction and parental selection.GSC is negatively correlated with GPC (r = -0.91)and WGC(r=-0.93)at high levels,indicating that it is always hard to increase grain protein and starch content simultaneously.
A better understanding of the genetic networks underlying the breeding-targeted traits is crucial for design breeding.In rice,functional genomics has advanced over the past few decades,resulting in well-established genetic information that has revealed a clear path for designing and breeding high-yield, superior-quality,hybrid super rice [49,50].In wheat, numerous molecular markers have been transformed into a breeding chip for genotyping germplasm resources[51].As more and more genes on agronomic traits are cloned,their genetic mechanisms of traits will become clearer,and so will the interactions between genes at different genetic loci,based on which more accurate predictions can be made in various stages of wheat breeding.
4.4.Future wheat breeding driven by information and prediction
With the application of information technology in breeding,genetic resources can be digitally managed, breeding data can be efficiently collected,stored and analyzed,and the breeding process can be visualized and optimized [52].By combining information technology with breeding design tools, breeders can be assisted to identify optimum selection and breeding schemes, thereby improving breeding efficiency and accuracy [11,13].Simulation and prediction tools are essential components especially for future breeding,in which breeding activities will be more driven by information technology in acquiring phenotypic data, molecular technology in acquiring genotypic data, and artificial intelligence in using big data to make selection decisions.By connecting with the information systems and ongoing breeding pipelines, realtime simulation and prediction and be made, and optimum selection and crossing schemes can be identified and recommended to breeders before field experiments are conducted [13].In this way, the design approach is expected to make contributions in shifting conventional wheat breeding from artificial to intelligent selection in the near future.
CRediT authorship contribution statement
Xiaobo Wang:Funding acquisition, Investigation, Formal analysis, Data curation, Software, Writing – original draft, Writing –review & editing.Weiwei Mao:Investigation, Formal analysis,Writing–original draft,Writing–review&editing.Yongfa Wang:Investigation,Writing–original draft.Hongyao Lou:Investigation.Panfeng Guan:Investigation.Yongming Chen:Investigation.Huiru Peng:Resources, Conceptualization, Writing – review &editing.Jiankang Wang:Conceptualization,Methodology,Writing– original draft, Writing – review & editing.
Declaration of competing interest
The authors declare that they have no known competing financial interests or personal relationships that could have appeared to influence the work reported in this paper.
Acknowledgments
This work was supported by the Hainan Yazhou Bay Seed Laboratory (B21Y10209 and B22C10212), China Postdoctoral Science Foundation (2022M713433), National Natural Science Foundation of China(31861143003),and Innovation Program of Chinese Academy of Agricultural Sciences.
Appendix A.Supplementary data
Supplementary data for this article can be found online at https://doi.org/10.1016/j.cj.2023.10.001.
- The Crop Journal的其它文章
- OsSPL10 controls trichome development by interacting with OsWOX3B at both transcription and protein levels in rice (Oryza sativa L.)
- Ectopic expression of OsNF-YA8, an endosperm-specific nuclear factor Y transcription-factor gene, causes vegetative and reproductive development defects in rice
- Mechanisms of autophagy function and regulation in plant growth,development, and response to abiotic stress
- ZmDRR206 functions in maintaining cell wall integrity during maize seedling growth and defense response to external stresses
- The plasmodesmata-associated β-1,3-glucanase gene GhPdBG regulates fiber development in cotton
- The MabHLH11 transcription factor interacting with MaMYB4 acts additively in increasing plant scopolin biosynthesis