
Increasing grain weight and yield stability by increasing pre-heading non-structural carbohydrate reserves per spikelet in short-growth duration rice
2023-12-25 09:52XingLiRuichunZhngChnJixinXiZhngwuXioFngoCoIzhrAliAnsIqlAulWhMinHungJinChn
The Crop Journal 2023年6期
Xing Li, Ruichun Zhng, G Chn,c, Jixin Xi, Zhngwu Xio, Fngo Co, Izhr Ali, Ans Iql,Aul Wh, Min Hung,*, Jin Chn,*
a Rice and Product Ecophysiology,Key Laboratory of Ministry of Education for Crop Physiology and Molecular Biology,Hunan Agricultural University,Changsha 410128,Hunan,China
b Hengyang Academy of Agricultural Sciences, Hengyang 421101, Hunan, China
c Yueyang Academy of Agricultural Sciences, Yueyang 414022, Hunan, China
d College of Agriculture, Guangxi University, Nanning 530004, Guangxi, China
e State Key Laboratory for Conservation and Utilization of Subtropical Agro-bioresources, College of Agriculture, South China Agricultural University, Guangzhou 510642,Guangdong, China
f Shanghai Center for Plant Stress Biology, CAS Center for Excellence in Molecular Plant Sciences, Chinese Academy of Sciences, Shanghai 200032, China
Keywords:Non-structural carbohydrate Short-growth duration rice Source-sink characteristics Yield stability
ABSTRACT Rice yield stability is a breeding goal,particularly for short-growth duration rice,but its underlying mechanisms remain unclear.In an attempt to identify the relationship between yield stability and source–sink characteristics in short-growth duration rice, a field experiment was conducted at three sites (Yueyang,Liuyang, and Hengyang) in 2021 and 2022.This study compared yield, yield components, source–sink characteristics, and their stability between two stable-yielding short-growth duration rice cultivars,Zhongzao 39(Z-39)and Lingliangyou 268(L-268),and two unstable-yielding short-growth duration rice cultivars,Zhongjiazao 17(Z-17)and Zhuliangyou 819(Z-819).The stability of agronomic parameters was represented by the coefficient of variation (CV).The respective CVs of yield in Z-17, Z-819, Z-39, and L-268 were 10.2%, 10.1%, 4.5%, and 5.7% in 2021 and 19.7%, 15.0%, 5.4%, and 6.5% in 2022.The respective CVs of grain weight were 6.3%, 5.7%, 3.4%, and 4.5% in Z-17, Z-819, Z-39, and L-268 in 2021, and 8.1%,6.3%,1.5%,and 0.8% in 2022.The mean source capacity per spikelet and pre-heading non-structural carbohydrate reserves per spikelet(NSCpre)were 7 %–43%and 7%–72%lower in Z-819 and Z-17 than in L-268 and Z-39 in 2021 and 2022.The mean quantum yield of photosystem II photochemistry of leaf,leaf area index,and specific leaf weight of L-268 and Z-39 were higher than those of Z-819 and Z-17 at the heading stage.This study suggests that high NSCpre, caused by great leaf traits before heading, increases source capacity per spikelet and its stability, thereby increasing the stability of grain weight and yield.Increasing NSCpre is critical for achieving grain weight and yield stability in short-growth duration rice.
1.Introduction
Rice is a staple food for over 65% of China’s population [1].The area and grain yield of double-growing season (early- and latesown) rice in southern China have greatly decreased owing to massive rural labor transfer[2,3].A viable way of using labor effectively, employing machine-transplanted large-scale farming, has developed under the guidance of the Chinese government [4].Conventional late rice cultivars are unsuitable for such farming because of their long growth duration (120–130 d) [4], which increases the probability of cold damage at the late growth stage.Short-growth duration rice cultivars (maturing in fewer than 115 d) are needed [5,6].
Previous studies have focused on identifying the high-yielding formation characteristics of short-growth duration rice cultivars.Increasing grain weight increased the grain yield of short-growth duration rice [7].Seasonal differences in indigenous soil N supply capacity and N response should be considered to achieve high yield for short-growth duration rice [8].But few studies have evaluated the yield stability of short-growth duration rice cultivars.Yield stability is a goal of crop breeding [9,10].High yield stability requires damping decreases in yield caused by environmental variation [11,12].The increasing frequency and intensity of extreme climatic events further highlight the need for rice cultivars with high yield stability [13].The yield stability was positively correlated with panicle number or seed setting rate in long-growth duration rice cultivars (122–137 d) [14,15].However, the mechanism affecting the yield stability of short-growth duration rice cultivars remains unclear.
Grain weight is the key factor limiting grain yield of shortgrowth duration rice cultivars [7], and is determined by grainfilling rate and duration [16].The high grain-filling rate is driven by strong grain sink strength [17].Wu et al.[18] attributed the low grain filling of wheat mainly to poor source capacity.However,Yang et al.[19] reported that the low grain filling of rice was not due to poor source capacity but to low transportation of assimilates to spikelets.Source capacity is considered the summation of the pre-heading non-structural carbohydrate (NSC) reserves in straw and biomass production during post-heading, which provides a carbon source for grain filling [20,21].Pre-heading NSC reserves and post-heading biomass production could thus influence grain weight stability, thereby affecting the yield stability of short-growth duration rice cultivars.Our hypothesis was that high yield-stability rice would have high and stable pre-heading NSC reserves in straw under differing environments,ensuring adequate grain filling and conferring high grain weight and yield stability.
We conducted a two-year experiment at three sites to compare yield, yield components, source–sink characteristics, and stability between two stable-yielding and two unstable-yielding shortgrowth duration rice cultivars.The objective was to identify the relationship between yield stability and source–sink characteristics in short-growth duration rice cultivars.
2.Materials and methods
2.1.Site description
Field experiments were performed during the late rice-growing season of 2021 and 2022 at the research farm of Rice and Product Ecophysiology located in Yueyang (29°05′N, 113°02′E, 40 m above sea level) (S1), Liuyang (28°09′N, 113°37′E, 43 m above sea level)(S2), and Hengyang (26°53′N, 112°28′E, 71 m above sea level)(S3), Hunan province, China.The maximum differences in the pre- and post-heading average daily mean temperature among the three sites were respectively 1.7 and 3.2 °C in 2021 and 0.4 and 0.7 °C in 2022 (Fig.1A, C).The maximum differences in the pre- and post-heading average solar radiation among the three sites were respectively 2.9 and 1.7 MJ m-2in 2021 and 1.8 and 1.8 MJ m-2in 2022 (Fig.1B, D).Soil samples were collected at 0–20 cm soil depth in 2021 before beginning the experiment.The properties of soil were provided in Table1.
2.2.Experimental design
Two stable-yielding short-growth duration rice cultivars,Zhongzao 39 (Z-39) and Lingliangyou 268 (L-268), and two unstable-yielding short-growth duration rice cultivars, Zhongjiazao 17(Z-17)and Zhuliangyou 819(Z-819)were planted in a randomized block design with an 80 m2plot size and three replications at each experimental site.The growth duration (sowing to maturity)of four cultivars ranged from 98 to 110 d at three sites in two years.These four cultivars were selected for (1) their high yield in the southern China region and (2) their differences in yield stability.
Pre-germinated seeds of the four rice cultivars were sown in nurseries at 100 g per tray on June 29, June 30, and July 1 in S1,S2, and S3, respectively, in 2021 and 2022.The 20-day-old seedlings were transplanted into paddy soils with 4–5 seedlings per hill, with 25 cm row spacing and 12 cm plant spacing, with a rice transplanter(2ZGQ-8B,Jiubaotian Agricultural Machinery Co.,Ltd.,Suzhou, Jiangsu, China).Nitrogen, phosphorus, and potassium doses were identical in each block at the three sites.Nitrogen was applied at 150 kg N ha-1, split into three doses: 50% as basal dose, 30% at early tillering, and 20% at the panicle initiation stage.The total phosphorus application rate was 75 kg P2O5ha-1,applied in full to each plot as basal fertilizer.The potassium fertilizer was applied at 150 kg K2O ha-1, in two splits: half as basal and half at panicle initiation stage.Even flooding to a depth of 5–10 cm was maintained from transplanting to 7 d before physiological maturity.Standard farming practices, including irrigation, herbicide,insecticide,and pesticide application,were performed identically for all plots during the entire season.
2.3.Sampling and measurements
In each plot, 12 hills of rice plants were randomly selected to determine aboveground biomass at three stages:panicle initiation,heading,and maturity.Plants were separated into leaves and stems at panicle initiation stage,into leaves,stems,and panicles at heading stage,and into leaves,stems,rachis,and unfilled and filled spikelets at maturity.These components were oven-dried at 80°C for 3 d to constant weight.Post-heading biomass production was calculated by subtracting pre-heading biomass production (the sum of dry weights of the individual plant organs at heading stage)from total biomass at maturity(the sum of dry weights of the individual plant organs at maturity).Green leaf area was measured with a leaf area meter(LI-3000C,Li-COR,Lincoln,NE,USA)at panicle initiation and heading stages, and leaf area index (LAI) was calculated as green leaf area per unit of land area.Specific leaf weight (SLW)was calculated as leaf dry weight per unit of land area.Filled and unfilled spikelets were counted to estimate spikelets per m2.Spikelet filling was calculated by dividing filled by total spikelet number.Three subsamples(each 30 g)of filled spikelets were counted after oven-drying to constant weight to calculate grain weight.Yield was measured from a 5 m2area in each plot and adjusted to a standard moisture content of 14%.
Leaf photosynthesis capacity was measured with a MultispeQ device linked to the PhotosynQ platform (https://www.photosynq.org) to characterize the fluorescence kinetics at panicle initiation and heading stages.The quantum yield of photosystem II photochemistry (Phi2), the quantum yield of non-photochemical quenching (PhiNPQ), and the quantum yield of other unregulated(non-photochemical)loss(PhiNO)were employed to assess photosynthetic efficiency.
The concentration of NSC(soluble sugars and starch)in straw at heading stage and maturity was determined following Yoshida[22].Aliquots of the soluble sugars and starch extract were assayed by anthrone reagent colorimetry using a spectrophotometer (L8,Shanghai Yidian Analytical Instrument Co., Ltd., Shanghai, China)at a wavelength of 620 nm.Starch was calculated by multiplying glucose content by a conversion factor of 0.9 [23].The concentration of NSC was estimated by summing the concentration of soluble sugars and starch.Pre-heading NSC reserves were calculated as the dry weight of straw at the heading stage multiplied by the concentration of NSC.NSC translocation (TNSC) was calculated by subtracting NSC in straw at maturity from pre-heading NSC reserves.
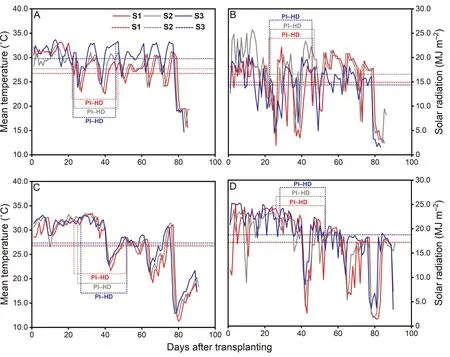
Fig.1.Average daily mean temperature(A,C)and solar radiation(B,D)during the rice-growing season for four short-growth duration rice cultivars grown at three sites in 2021(A,B)and 2022(C,D).S1,Yueyang;S2,Liuyang;S3,Hengyang.In each panel,horizontal dashed lines represent seasonal averages across four cultivars.Dashed brackets represent the duration of panicle initiation stage (PI) to heading stage (HD).
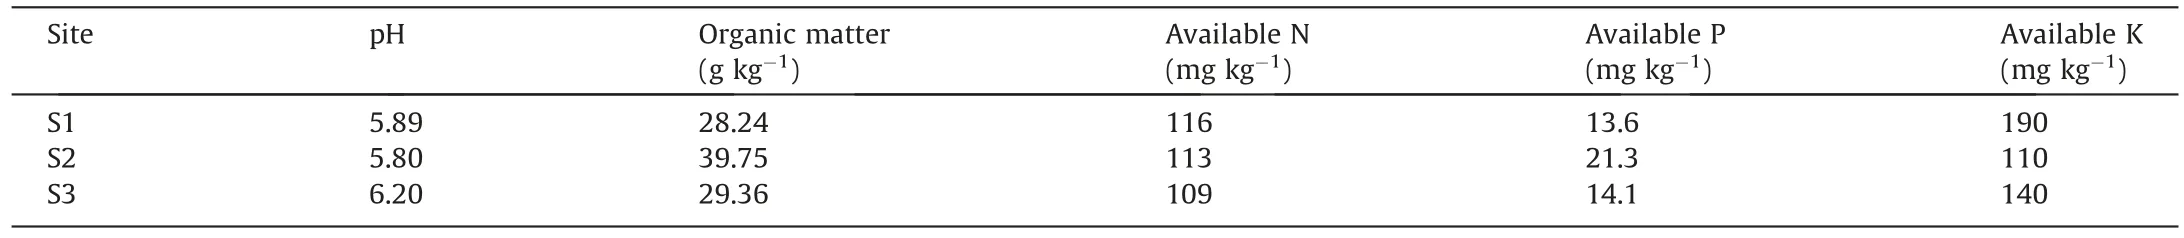
Table 1 Soil properties of three sites before land preparation in 2021.
Source capacity was defined as the sum of pre-heading NSC reserves in straw and post-heading biomass production [24].Source capacity per spikelet was calculated by dividing source capacity by total spikelet number.Pre-heading NSC reserves per spikelet (NSCpre) were calculated by dividing pre-heading NSC reserves in straw by total spikelet number.Post-heading biomass production per spikelet (BPpost) was calculated by dividing postheading biomass production by total spikelet number.Sink capacity was calculated as total spikelet number multiplied by grain weight.The other source–sink parameters, namely the ratio of total spikelet number to leaf area at heading stage (TSL), the ratio of filled spikelet number to leaf area at heading stage(FSL),and the ratio of grain weight to leaf area at heading stage(GWL)were calculated following He et al.[25] and Yoshinaga et al.[26].
The stability of yield and other parameters was evaluated as coefficient of variation (CV), where CV = (SD/mean) × 100.
2.4.Statistical analysis
Treatment means were compared by analysis of variance with LSD0.05test and Pearson’s correlation analysis (Statistix 8.0 software, Tallahassee, FL, USA).
3.Results
3.1.Grain yield and yield components
Z-819 and Z-17 showed lower mean grain yields across the three sites, with reductions of respectively 5% and 9% in 2021 and 6% and 8% in 2022, compared to L-268 (Fig.2G, H).Grain weight showed a similar trend among the four cultivars, with Z-819 and Z-17 lower than L-268 by respectively 6% and 8% in both years(Fig.2E,F).There were no significant differences in grain filling among the four cultivars in 2021 and 2022 (Fig.2C, D).Spikelets per m2was significantly lower in Z-17 than in L-268 in 2022,but no significant difference was found among the four cultivars in 2021 (Fig.2A, B).
The CV of yield was higher in Z-819 and Z-17 than in Z-39 by respectively 124% and 127% in 2021 and by 178% and 265% in 2022 (Fig.2G, H).The CV of grain weight was higher in Z-819 and Z-17 than in Z-39 by respectively 68% and 85% in 2021 and higher than in L-268 by 688% and 913% in 2022 (Fig.2E, F).
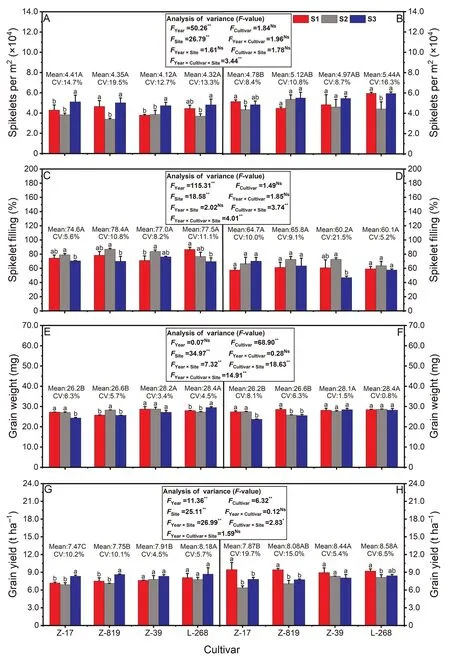
Fig.2.Grain yield and yield components of four short-growth duration rice cultivars grown at three sites in 2021(A,C,E,G)and 2022(B,D,F,H).S1,Yueyang;S2,Liuyang;S3, Hengyang.Z-17, Zhongjiazao 17; Z-819, Zhuliangyou 819; Z-39, Zhongzao 39; L-268, Lingliangyou 268.*, P < 0.05; **, P < 0.01; Ns, no significance.Columns and bars represent respectively means and standard errors of three replications.For each cultivar,values with differing lowercase letters differ at the 0.05 probability level.Means of three sites with differing uppercase letters differ at the 0.05 probability level.
Yield was correlated with grain weight in short-growth duration rice (Table 2).The CV of yield showed a positive correlation with the CV of grain weight, but not with the CV of spikelets per m2and grain filling.

Table 2 Pearson’s correlation between grain yield and yield components of four short-growth duration rice cultivars grown at three sites in 2021 and 2022.
3.2.Source–sink characteristics
The mean source capacity per spikelet was significantly lower in Z-819 and Z-17 compared to Z-39 by respectively 7% and 15%in 2021 and by 7%and 11%in 2022(Table 3).The mean sink capacity of Z-39 and L-268 was higher than Z-819 and Z-17 in 2021 and 2022, but the difference was not significant among the four cultivars in 2021.Compared to L-268, the mean TSL was significantly higher in Z-819 and Z-17 by 17% and 21% in 2021 and by 15%and 20% in 2022, respectively.Similarly, the mean FSL was significantly higher in Z-819 and Z-17 than in L-268 by 23% and 18% in 2021 and by 23% and 28% in 2022, respectively.
Compared to Z-39, the CV of source capacity per spikelet was higher in Z-819 and Z-17 by respectively 386% and 383% in 2021 and by 323% and 635% in 2022.The CV of FSL in Z-819 and Z-17was respectively 247% and 230% higher than in L-268 in 2021 and 150% and 353% higher than in Z-39 in 2022.

Table 3 Source–sink characteristics of four short-growth duration rice cultivars grown at three sites in 2021 and 2022.
Grain weight was positively correlated with source capacity per spikelet and negatively correlated with TSL and FSL(Fig.3).The CV of grain weight was positively correlated with the CV of source capacity per spikelet and FSL,but not with the CV of sink capacity,TSL, and GWL.
3.3.NSCpre, BPpost and TNSC
The mean NSCpreof Z-819 and Z-17 was respectively 38% and 43% lower than Z-39 in 2021 and 72% and 72% lower than L-268 in 2022 (Table 4).The mean BPpostof L-268, Z-39, and Z-819 was significantly higher than Z-17 in 2021.No significant difference was found in BPpostamong four short-growth duration rice in 2022.Compared to L-268, the mean TNSCwas lower in Z-819 and Z-17 by respectively 39% and 37% in 2021 and by 72% and 74% in 2022.
3.4.Leaf traits
Phi2 showed no significant differences among the four cultivars at panicle initiation stage in either year (Table 5).In 2021, there were no significant differences in PhiNO and PhiNPQ at panicle initiation stage.The Phi2 of Z-819 and Z-17 at heading stage was lower than L-268 by respectively 5% and 6% in 2021 and by 6%and 5% lower than Z-39 in 2022.The PhiNO of Z-819 and Z-17 at heading stage was respectively 16% and 14% higher than L-268 in 2021 and 15% and 17% higher than Z-39 in 2022.

Fig.3.Relationships between the grain weight and source–sink characteristics of four short-growth duration rice cultivars grown at three sites in 2021 and 2022.TSL, the ratio of total spikelet number to leaf area at heading stage;FSL,the ratio of filled spikelet number to leaf area at heading stage;GWL,the ratio of grain weight to leaf area at heading stage.Values of the CV in each cultivar describe the variation among the three sites within a year.n = 8 (4 cultivars and 2 years); n = 24 (4 cultivars, 3 sites, and 2 years).*, P < 0.05.

Table 4 Pre-heading non-structural carbohydrate reserves per spikelet(NSCpre),post-heading biomass production per spikelet(BPpost),and NSC translocation(TNSC)of four short-growth duration rice cultivars grown at three sites in 2021 and 2022.
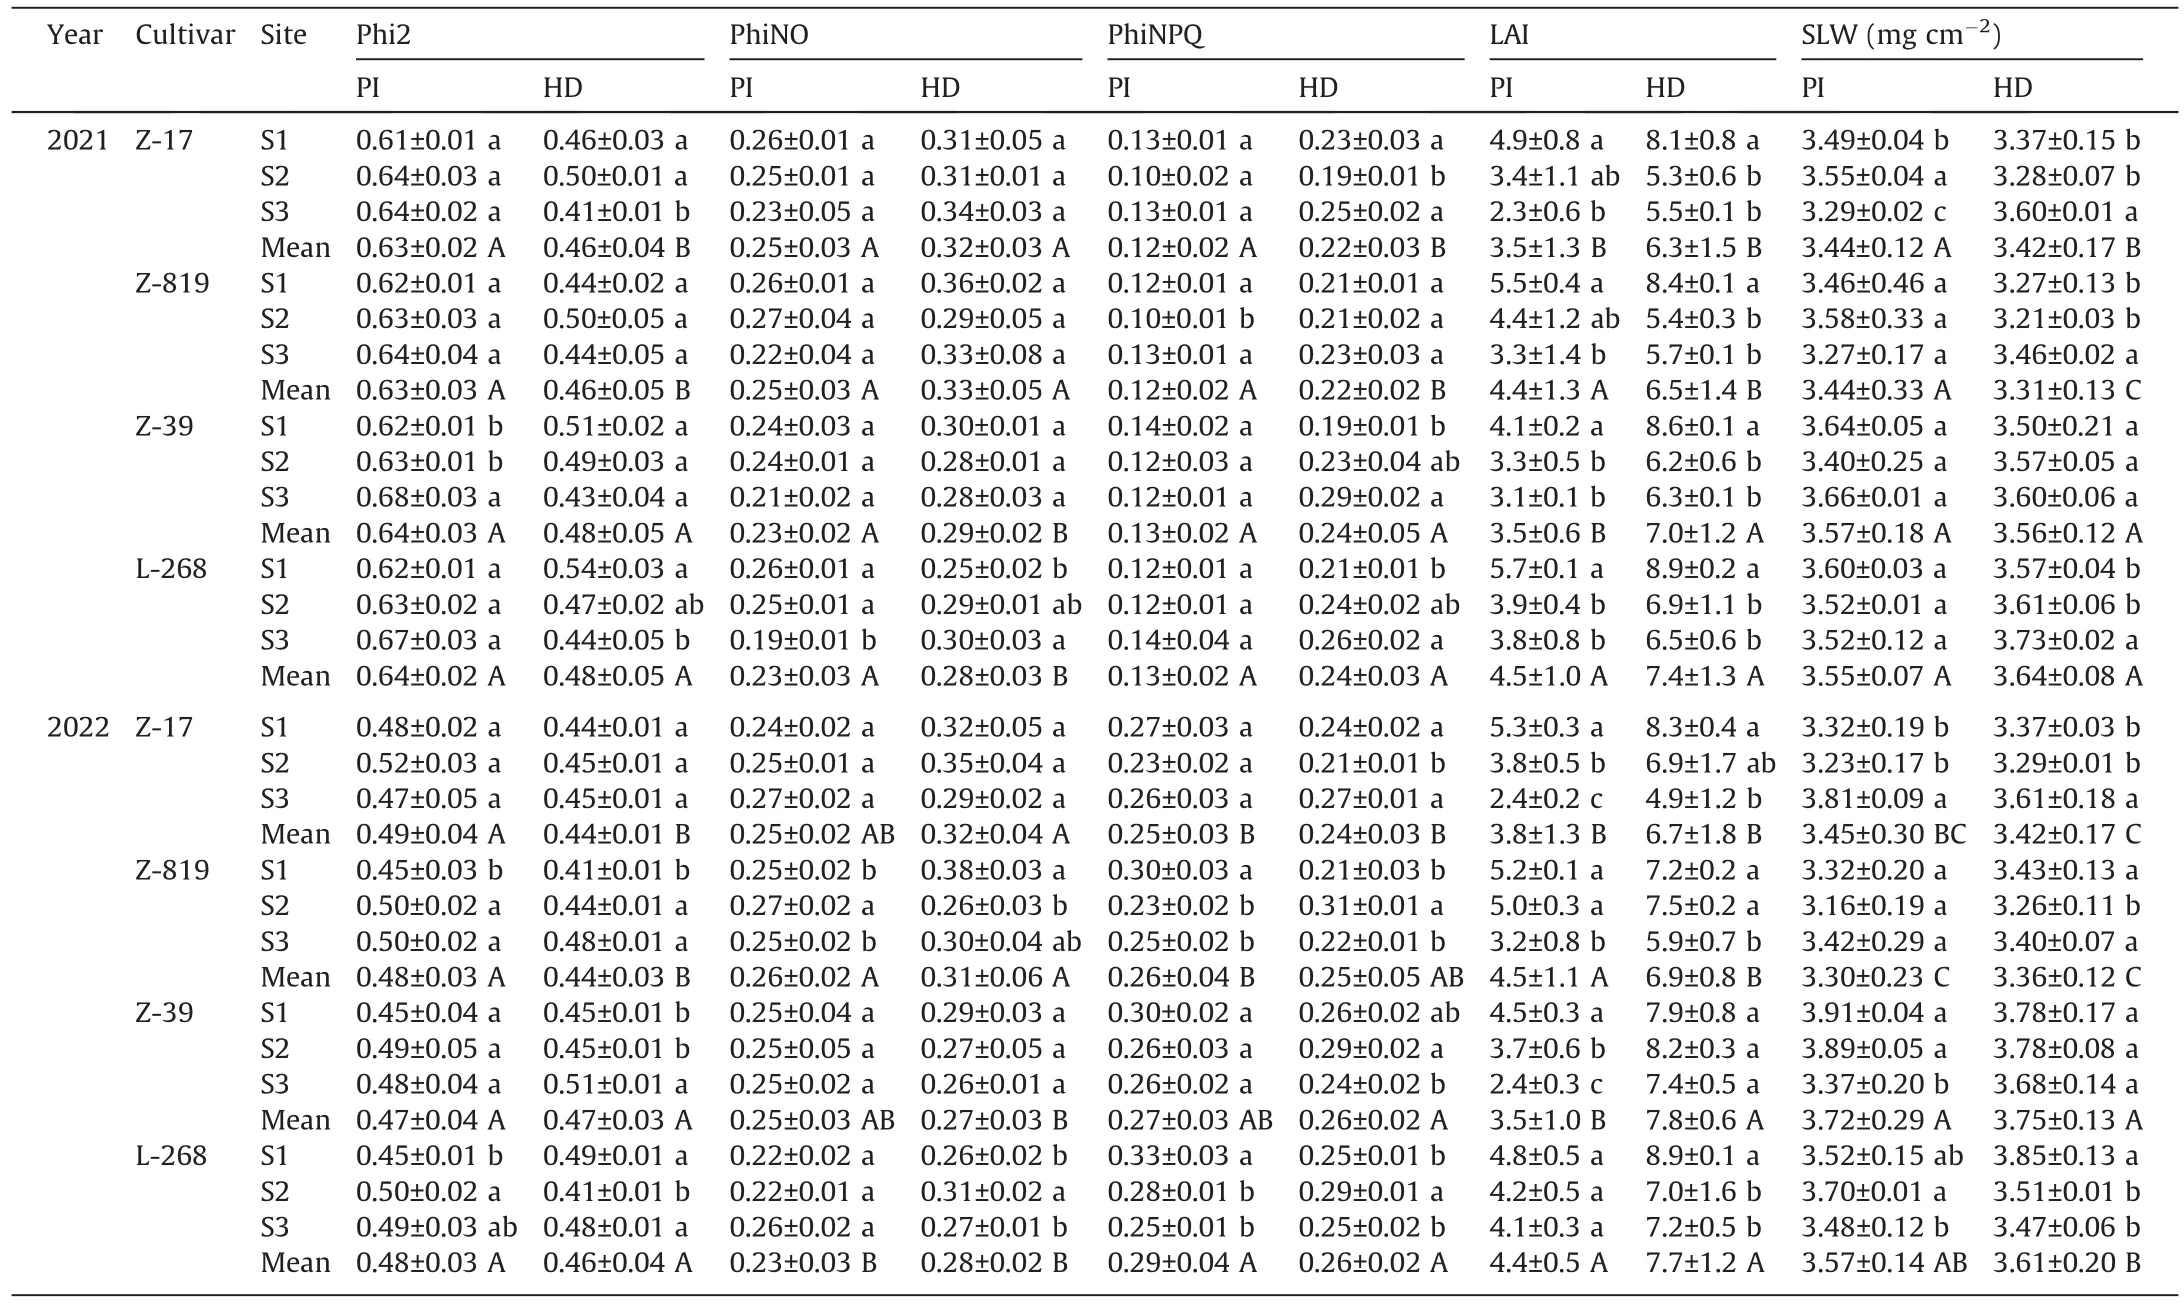
Table 5 Leaf photosynthetic parameters,leaf area index(LAI),and specific leaf weight(SLW)at two growth stages of four short-growth duration rice cultivars grown at three sites in 2021 and 2022.
The mean LAIs of Z-819 and L-268 were significantly higher than those of Z-17 and Z-39 at panicle initiation stage in 2021 and 2022.The mean LAIs of Z-819 and Z-17 at heading stage were significantly lower than L-268 by respectively 15%and 12%in 2021 and lower than Z-39 by 15%and 13%in 2022.There was no significant difference in SLW among the four cultivars at panicle initiation stage in 2021.The mean SLW of Z-819 and Z-17 at heading stage was significantly lower than L-268 by respectively 6% and 9% in 2021 and lower than Z-39 by 9% and 10% in 2022.
4.Discussion
4.1.Relationships between grain yield stability and the stability of yield components
In the present study,the yield stability of short-growth duration rice was associated with grain weight, in view of the positive correlation between the CV of yield and the CV of grain weight.However, studies have shown that rice yield stability was determined mainly by seed setting rate and/or spikelets per m2[27,28].The discrepancies between this study and previous studies are possibly due to the differing cultivars.The rice in our study was hard to obtain more spikelets owing to the short vegetative growth stage.The seed setting rate of long-growth duration rice cultivars are always decreased by low temperature, but short-growth duration rice cultivars can avoid suffering cold damage in the double ricecropping system [29].Grain weight may be the factor most strongly affecting yield in short-growth duration rice.These findings indicate that grain weight is crucial to the high yield and yield stability of short-growth duration rice.The lower CV of yield in Z-39 and L-268 than in Z-819 and Z-17 could be explained by their lower CV of grain weight in 2021 and 2022.
4.2.Relationships between grain weight stability and source–sink characteristics
Grain weight formation is a complex process that involves the allocation of assimilates after flowering [30].In the present study,the high grain weight of stable-yielding short-growth duration rice could be attributed partly to their high TNSC.This outcome indicates that stable-yielding short-growth duration rice has adequate assimilates stored in straw,and can transport the assimilate to spikelets to confer high grain weight stability during the grain filling stage under diverse environmental conditions.Assimilate allocation is affected by rice source–sink characteristics [31].Chen et al.[32]have shown that an increase in the source-sink relationship through sucrose and trehalose metabolism resulted in more dry matter and NSC transported to rice grain.Consistently, Ren et al.[33]observed the same phenomenon in maize hybrids.Thus,grain weight stability is likely strongly correlated with source–sink characteristics.This inference is supported by the finding in this study of positive correlations between the CV of grain weight and the CV of source capacity per spikelet and FSL.The lower CV of grain weight in Z-39 and L-268 than in Z-819 and Z-17 could be explained by their lower CV of source capacity per spikelet and FSL in both years.The results suggest that L-268 and Z-39 are more environmentally adaptable than Z-819 and Z-17.Specifically,these cultivars seem to be less sensitive to climatic changes, and could maintain high photosynthetic rates under diverse environmental conditions,resulting in high assimilate production,thereby achieving a stable source capacity per spikelet.
The source capacity per spikelet comprises NSCpreand BPpost,with approximately 30% and 70% of the assimilate in spikelets derived from the former and the latter, respectively [34].This study showed little difference in BPpostamong four cultivars in 2021 and 2022.Accordingly, we attribute the higher mean source capacity per spikelet of Z-39 and L-268 than Z-17 and Z-819 mainly to the higher mean NSCprein Z-39 and L-268 than in Z-17 and Z-819 in both years.This finding suggests that NSCprestrongly influences grain weight stability,as recognized by Fu et al.[35]and Wakabayashi et al.[36].
NSC reserves are the excess assimilates stored in straw during the vegetative growth stage [37].Assimilate production relies on canopy photosynthesis, which is closely associated with leaf photosynthesis capacity and LAI [38].The higher mean NSCpreof Z-39 and L-268 compared to Z-819 and Z-17 was partly explained by their higher leaf photosynthesis capacity (higher mean Phi2)at heading stage in both years.The higher mean LAI of Z-39 and L-268 at heading stage than that of Z-819 and Z-17 could partly explain the difference in mean NSCprein both years.Rice leaf photosynthesis capacity could be influenced by rice leaf traits [39,40].The differences in mean Phi2 and PhiNO were due mainly to the higher mean SLW of L-268 and Z-39 than that of Z-819 and Z-17 at heading stage in 2021 and 2022.These results suggest that L-268 and Z-39 have greater canopy photosynthesis before heading than Z-819 and Z-17.
It was reported that NSC reserves were critical for short-growth duration rice cultivars [37].NSCpreconferred grain weight and yield stability in the present study.It is desirable to identify farming practices that will increase NSCpre, thereby promoting the stability of grain weight and yield in short-growth duration rice under machine-transplanted large-scale farming.
5.Conclusions
Source capacity per spikelet was the critical factor limiting grain weight and yield stability in short-growth duration rice.High NSCprecaused by great leaf traits before heading increased source capacity per spikelet and its stability.Increasing NSCprein shortgrowth duration rice may increase grain weight and yield stability.
CRediT authorship contribution statement
Xing Li:Investigation,Writing–original draft.Ruichun Zhang:Investigation.Ge Chen:Investigation.Jiaxin Xie:Investigation.Zhengwu Xiao:Investigation.Fangbo Cao:Investigation.Izhar Ali:Writing – review & editing.Anas Iqbal:Writing – review &editing.Abdul Wahab:Writing – review & editing.Min Huang:Conceptualization, Funding acquisition.Jiana Chen:Conceptualization, Funding acquisition, Writing – review & editing.
Declaration of competing interest
The authors declare that they have no known competing financial interests or personal relationships that could have appeared to influence the work reported in this paper.
Acknowledgments
This work was supported by the National Natural Science Foundation of China(32001470),the Scientific Research Fund of Hunan Provincial Education Department (21B0184), and The Science and Technology Innovation Program of Hunan province(2021RC3088).
- The Crop Journal的其它文章
- OsSPL10 controls trichome development by interacting with OsWOX3B at both transcription and protein levels in rice (Oryza sativa L.)
- Ectopic expression of OsNF-YA8, an endosperm-specific nuclear factor Y transcription-factor gene, causes vegetative and reproductive development defects in rice
- Mechanisms of autophagy function and regulation in plant growth,development, and response to abiotic stress
- ZmDRR206 functions in maintaining cell wall integrity during maize seedling growth and defense response to external stresses
- The plasmodesmata-associated β-1,3-glucanase gene GhPdBG regulates fiber development in cotton
- The MabHLH11 transcription factor interacting with MaMYB4 acts additively in increasing plant scopolin biosynthesis