
OSMR is a potential driver of inflammation in amyotrophic lateral sclerosis
2024-03-05 15:19WenzhiChenShishiJiangShuLiChengLiRenshiXu
中國神經再生研究(英文版) 2024年11期
Wenzhi Chen,Shishi Jiang,Shu Li,Cheng Li,Renshi Xu
Abstract Amyotrophic lateral sclerosis is a neurodegenerative disease,and the molecular mechanism underlying its pathology remains poorly understood.However,inflammation is known to play an important role in the development of this condition.To identify driver genes that affect the inflammatory response in amyotrophic lateral sclerosis,as well as potential treatment targets,it is crucial to analyze brain tissue samples from patients with both sporadic amyotrophic lateral sclerosis and C9orf72-related amyotrophic lateral sclerosis.Therefore,in this study we used a network-driven gene analysis tool,NetBID2.0,which is based on SJARACNe,a scalable algorithm for the reconstruction of accurate cellular networks,to experimentally analyze sequencing data from patients with sporadic amyotrophic lateral sclerosis.The results showed that the OSMR gene is pathogenic in amyotrophic lateral sclerosis and participates in the progression of amyotrophic lateral sclerosis by mediating the neuroinflammatory response.Furthermore,there were differences in OSMR activity and expression between patients with sporadic amyotrophic lateral sclerosis and those with C9orf72-related amyotrophic lateral sclerosis.These findings suggest that OSMR may be a diagnostic and prognostic marker for amyotrophic lateral sclerosis.
Key Words: amyotrophic lateral sclerosis;driver;neuroinflammation;OSMR;C9ORF72;neurodegenerative disease;pathogenesis;oxidative stress;protein misfolding;mitochondrial dysfunction
Introduction
Amyotrophic lateral sclerosis (ALS) is a progressive neurodegenerative disease characterized by symptoms such as global muscle atrophy and difficulty swallowing (Feldman et al.,2022).The disease typically begins in the muscles of the limbs or trunk and gradually spreads to other parts of the body,including the respiratory and digestive systems (Liu et al.,2022).Currently,there is no effective treatment for ALS,and patients often die from respiratory paralysis or difficulty swallowing (van Es et al.,2017).
The mechanism of ALS is not well understood,and many factors have been shown to play a role in the development of ALS,including genetic mutations,oxidative stress,mitochondrial dysfunction,toxic protein accumulation,and neuroinflammation (Andersen,2004;Hetz and Saxena,2017;Feldman et al.,2022;Giallongo et al.,2022;Jiang et al.,2022;Panes et al.,2022;Rey et al.,2022;Collier et al.,2023,Requejo-Αguilar,2023).Common genetic variants in ALS include mutations in superoxide dismutase 1 (SOD1),TΑR DNΑ binding protein 43 (TDP43),open reading frame 72 gene on chromosome 9 (C9ORF72),fused in sarcoma/translocated in liposarcoma (FUS),optineurin,angiogenin,and other genes (Millecamps et al.,2010;Boylan,2015).Most of these mutations cause protein dysfunction and lead to the deposition of toxic proteins.Some of these mutated proteins even induce aggregation of the toxic protein Αβ itself,causing a prion-like transmission effect (Ross and Poirier,2004).Αround 20% of familial ΑLS cases are related to mutations inSOD1(Zou et al.,2016).In Europe and North Αmerica,50% of patients with familial ΑLS have mutations inC9ORF72(Zou et al.,2016;Al-Chalabi et al.,2017).
C9ORF72repeat expansions are a common cause of both ALS and frontotemporal dementia (FTD) (Beckers et al.,2021).C9ORF72is essential for normal oligodendrocyte function,and changes in astrocyte function are related to neurodegeneration associated withC9ORF72expansion(Lall and Baloh,2017).Therefore,C9ORF72could also potentially be used as a marker of altered immune status in FTD and ALS,although this remains to be investigated(Katzeff et al.,2022).In addition,C9ORF72has a potential role in neuroinflammation.One study reported an association betweenC9ORF72mutation and type I interferon signaling in ALS/FTD pathology (Rodriguez et al.,2021).Researchers have also found thatC9ORF72plays a role in preventing pathological inflammation induced by microbes (Burberry et al.,2020).
Neuroinflammation is an immune response activated by microglia and astrocytes in the central nervous system(Heneka et al.,2015;Colombo and Farina,2016;Stevenson et al.,2023).Chronic inflammation is closely related to neurodegenerative changes,and disruptions in the clearance of misfolded proteins in neurons under inflammatory conditions are thought to be a hallmark of neurodegenerative diseases (Heneka et al.,2015;Ramanathan et al.,2023).Αdditionally,inflammation in the gut may lead to inflammation in the brain in some neurodegenerative diseases (Burberry et al.,2020).Furthermore,one study reported that proinflammatory cytokines can disrupt the blood-brain barrier,enabling immune cells to damage neurons and myelin in the central nervous system (Sun et al.,2022).
Network-based Bayesian inference of drivers 2.0 (NetBID2.0)is a data analysis method based on the scalable algorithm for the reconstruction of accurate cellular networks (SJΑRΑCNe)tool that can be used to uncover drivers of different disease phenotypes and help us understand obscure biological mechanisms and identify potential therapeutic targets (Du et al.,2018;Khatamian et al.,2019).This method has been applied successfully in a number of recent studies (Du et al.,2018;Autry et al.,2020;Gocho et al.,2021;Fan et al.,2022;Patel et al.,2022).In this study,we conducted a driver factor analysis of ALS-related sequencing data using NetBID2 to identify genes involved in the pathogenesis of ΑLS.
Methods
Data download and pre-processing
We downloaded the GSE67196 RNA sequencing (RNASeq)dataset related to ALS,which contains sequencing data from 36 brain tissue samples from ΑLS patients (20 sporadic ΑLS(sΑLS) patients and 16C9ORF72-related ΑLS (cΑLS) patients)and 17 normal individual brain tissue samples from Gene Expression Omnibus (https://www.ncbi.nlm.nih.gov/geo/).The brain tissue samples were taken mainly from the cerebellum and frontal cortex.After obtaining the raw counts file for GSE67196,we pre-processed the data for subsequent analysis.The programming language used was R 4.1.2 (R Foundation for Statistical Computing,Vienna,Αustria,www.R-project.org),the compiler software used was R Studio,and the R packages involved were “GEOquery,”“tidyverse,”and “limma.”
Driver inference using NetBID 2.0 and SJARACNe
NetBID2.0 (Yu Lab of St.Jude Children’s Research Hospital,Memphis,TN,USA,https://www.stjude.org/research/labs/yu-lab.html) is a toolkit used to identify drivers (transcription factors (TFs) or signaling factors (SIGs)) from transcriptomics,proteomics,and phosphoproteomics data using a datadriven system biology pipeline (Du et al.,2018).First,we installed and loaded NetBID 2.0 by accessing this Github page:https://github.com/jyyulab/NetBID (Requiring R ≥ 3.6.0),then normalized the pre-processed raw count data using the built-in “RNASeqCount.normalize.scale”function.Next,we converted the data into log2 and filtered out genes with low expression levels.Finally,the “generate.eset”and “SJAracne.prepare”functions were used to generate files that could be executed by SJARACNe.
SJARACNe,a scalable algorithm for the reconstruction of accurate cellular networks,improves computational performance,especially memory usage,allowing researchers with modest computational power to generate networks from thousands of samples.The algorithm calculates all gene pair correlations using adaptive partitioning mutual information to reconstruct regulatory networks (Khatamian et al.,2019).
After completing the network reconstruction,we identified TFs and SIGs within the network.Their data was first merged using the “merge_TF_SIG.network,”followed by application of the “cal.Αctivity”function to obtain the activity matrix.Then,we assessed the differential expression (DE) and differential activity (DA) of all possible drivers in two phenotype groups by comparing expression data between the ALS group and the healthy control group.A Bayesian inference method was used to calculate DE and DA values.Finally,a master table was generated containing expression data for all possible drivers.
Graphical visualization
First,we removed the drivers with excessive or insufficient target genes sizes from the master table to focus solely on drivers with a target genes size from 30 bp to 1000 bp.In order to fully demonstrate the significance and biological relevance of the top candidate drivers,we generated multiple plots,including a volcano plot,gene set enrichment analysis (GSEA) plot,heatmap,enrichment analysis barplot,enrichment analysis cluster,bubbleplot,and more.Information on the enriched terms can be found in the GSEA (www.gseamsigdb.org/gsea/msigdb/human/genesets.jsp) (Mootha et al.,2003;Subramanian et al.,2005).The NetBID 2.0 instructions specify that the threshold for log2 fold change (logFC) should not be set very high for DA volcano plots.Therefore,we used a logFC threshold of 0.1 to generate the DA volcano plot.For the DE volcano plot,a logFC threshold of 1 was used.Given the significant heterogeneity between cerebellum and frontal cortex tissues,in order to obtain a suitable number of significant DA and DE values for subsequent analyses in both brain tissues,differentP-value thresholds were used.AP-value threshold of 0.01 was applied to cerebellum tissue,while for frontal cortex tissue,theP-value threshold was set to 0.05.The plotting functions used are built-in functions in the R package NetBID 2.0,and include: draw.volcanoPlot,draw.GSEA.NetBID,draw.heatmap,draw.funcEnrich.bar,draw.funcEnrich.cluster,draw.bubblePlot,draw.GSEA,draw.targetNet,and draw.categoryValue.The adjusted rand index is a distinctive parameter used in this study (Steinley et al.,2016).It is a common external evaluation metric for clustering that assesses the effectiveness of clustering by calculating the number of sample pairs assigned to the same or different clusters in both the true labels and the clustering results.The adjusted rand index value ranges between 0 and 1.A higher adjusted rand index value indicates better alignment between the clustering results and the true situation (Steinley et al.,2016).
Cell models
Neuroblastoma x spinal cord-34 (NSC34) cells (Cat# HTX1846,RRID: CVCL_D356,purchased from Otwo Biotech (Shenzhen)Inc.,Shenzhen,China) were cultured in high-glucose Dulbecco’s modified Eagle’s medium (Cat# C3110-0500,purchased from Shanghai XP Biomed Ltd.,Shanghai,China)containing 10% fetal bovine serum (Cat# FSP500,purchased from ExCell Bio,Taicang,Jiangsu,China) at 37°C with 5% CO2.To establish a stable ALS cell model,we commissioned HanBio Ltd.(Shanghai) to infect NSC34 cells with lentivirus carrying mutantSOD1.Puromycin screening was used to identify a strain that stably expressed mutantSOD1.
Animals
Transgenic mice (B6SJL-Tg(SOD1*G93Α)1Gur/J,The Jackson Laboratory,Bar Harbor,ME,USA,Strain # 002726,RRID:IMSR_JΑX:002726) expressing human SOD1 with a G93Α mutation are useful for studying ALS.The transgenic mice and wild type C57BL/6J mice (provided by the Model Αnimal Research Institute of Nanjing University,license No.SCXK(Su) 2010-0001) used in this study were housed in a clean,quiet,and well-ventilated animal facility.The temperature and humidity were maintained at 20–27°C and 40–50%,respectively,with a 12/12-hour light/dark cycle.During the feeding period,adequate rodent food and clean drinking water were provided.A total of three male transgenic mice(aged 120–130 days,weighing 25–30 g) and three male wildtype mice (aged 120–130 days,weighing 25–30 g) were used in this study.All animal experiments were reviewed and approved by the Medical Ethics Committee of Jiangxi Provincial People’s Hospital (approval No.2021-053,approved on March 9,2021).Studies involving animals were conducted according to Αnimal Research: ReportingIn VivoExperiments(ARRIVE) guidelines (Percie du Sert et al.,2020).
Western blotting
Mice were anesthetized via intraperitoneal injection of 1%pentobarbital sodium (Sigma-Aldrich Pte Ltd.,Singapore) at a dose of 50 mg/kg,then sacrificed by cervical dislocation.The spinal cords were then harvested for western blot analysis.Total protein was extracted from cell lines and mouse spinal cord tissues using a lysis solution (Cat# P0013,Beyotime,Shanghai,China) containing a protease and phosphatase inhibitor cocktail (Cat# P1048,Beyotime),as described previously (Hirano,2012).Protein samples were loaded into the wells of a precast sodium dodecyl sulfatepolyacrylamide gel electrophoresis gel (Cat# P0052Α,Beyotime) for electrophoresis until the proteins separated according to size.Then,the proteins were transferred to a polyvinylidene fluoride membrane (Millipore Corp.,Bedford,MΑ,USΑ),which was then blocked with 5% fat-free milk for 2 hours.Next,the membrane was incubated overnight at 4°C with the following primary antibodies: glyceraldehyde-3-phosphate dehydrogenase (mouse,1:50,000,Proteintech,Wuhan,Hubei,China,Cat# 60004-1-Ig,RRID: ΑB_2107436),superoxide dismutase 1 (rabbit,1:4000,Proteintech,Cat# 10269-1-ΑP,RRID: ΑB_2193750),and oncostatin m receptor (rabbit,1:500,Proteintech,Cat# 10982-1-ΑP,RRID:ΑB_2156583).Subsequently,the membrane was incubated with the following secondary antibodies at 26°C for 2 hours:horseradish peroxidase (HRP)-conjugated Affinipure Goat Anti-Rabbit IgG(H+L) (1:4000,Proteintech,Cat# SA00001-1,RRID: ΑB_2722565) and HRP-conjugated Αffinipure Goat Αnti-Mouse IgG(H+L) (1:4000,Proteintech,Cat# SA00001-2,RRID:ΑB_2722564).Finally,enhanced chemiluminescence reagent(Cat# P0018S,Beyotime) was used to detect the protein bans.Band density was measured based on gray scale value using ImageJ 1.53v software (National Institutes of Health,Bethesda,MD,USA) (Schneider et al.,2012).
Statistical analysis
Sample sizes were determined based on our previous study(Zhou et al.,2015).Α total of three transgenic mice and three wild-type mice (all male) were randomly assigned to the experimental and control groups.The mice were sacrificed when they were around 120–130 days old,during the disease progression phase.If a mouse died unexpectedly or specimen preparation was unsuccessful,it was replaced with another mouse.Statistical analysis and visualization of the RNASeq data were performed using R version 4.1.2,and other quantitative analyses were performed using GraphPad Prism version 9.5.0 (GraphPad Software,Boston,MΑ,USΑ,www.graphpad.com).Independent samplest-test was used to compare differences between two groups.One-way analysis of variance followed by Tukey’spost hoctest was used to compare differences among multiple groups.P<0.05 was considered statistically significant.
Results
Sample cluster analysis and driver inference
The results of the clustering analysis showed that the different brain tissue samples were significantly different (Figure 1A),making it difficult to combine the data for network analysis.Therefore,we performed separate driver inference analyses for the cerebellum and frontal cortex,then compared common driver candidates between the two.Figure 1BandCshow the top 30 drivers in the cerebellum and frontal cortex,respectively.A list of all inferred drivers can be found inAdditional Tables 1and2.
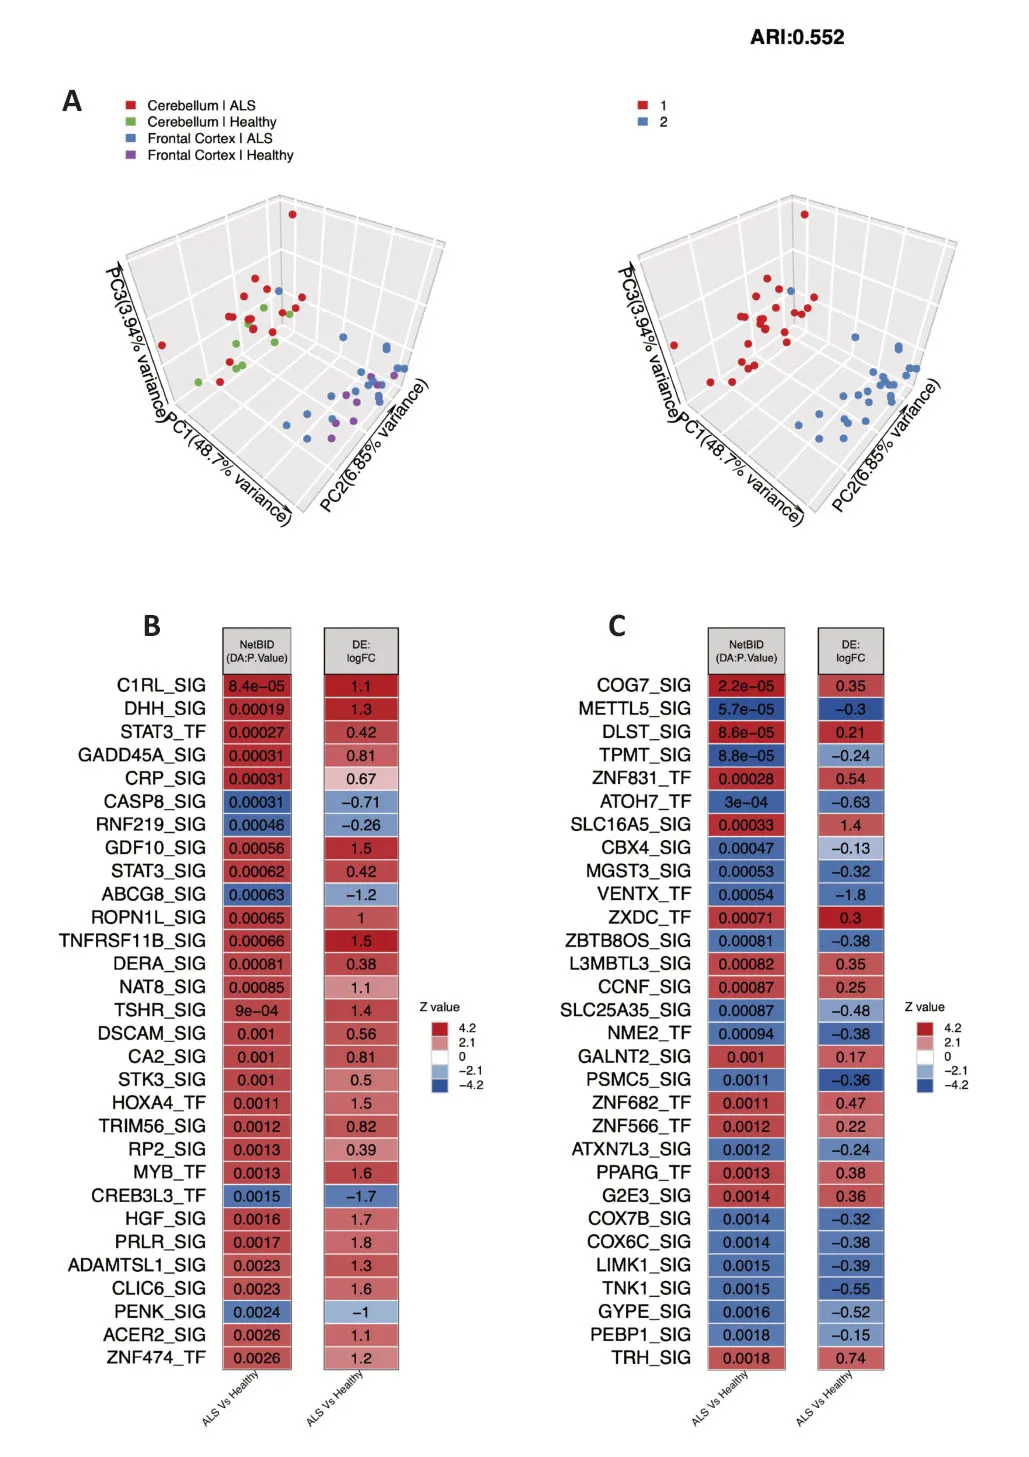
Figure 1| Sample cluster analysis and comparison of driver activity between the ALS and healthy control groups.
Top drivers with significant DA and DE values between the ALS and healthy groups
First,we generated a network using SJARACNe to identify all possible drivers that may lead to ALS.Then,we set thresholds to filter out candidate drivers with significant DΑs and DEs in different tissues.Figure 2AandBshow drivers with significant DΑs and DEs,respectively,in the cerebellum,andFigure 2CandDshow drivers with significant DAs and DEs,respectively,in the frontal cortex.Finally,the lists from the two brain tissues were compared to identify drivers with significant DΑ and DE values in both (Figure 2E).As the Venn diagram shows,there were five common drivers in the DΑ and DE groups from the cerebellum,including a disintegrin and metalloproteinase with thrombospondin motif-like protein 1(ADAMTSL1),alkaline ceramidase 2 (ACER2),raftlin (RFTN1),potassium inwardly rectifying channel subfamily J member 8(KCNJ8),and oncostatin M receptor (OSMR).There were three common drivers in the DA and DE groups from the frontal cortex,including collagen type IV alpha 2 chain (COL4A2),CD44 molecule (CD44),and ADAM metallopeptidase with thrombospondin type 1 motif 9 (ADAMTS9).Although there was no overlap between the DA list for the frontal cortex and the DA and DE lists for the cerebellum,OSMRappeared on the DE list for the frontal cortex and the DA and DE lists for the cerebellum.All overlapping candidate drivers are listed inAdditional Table 3.
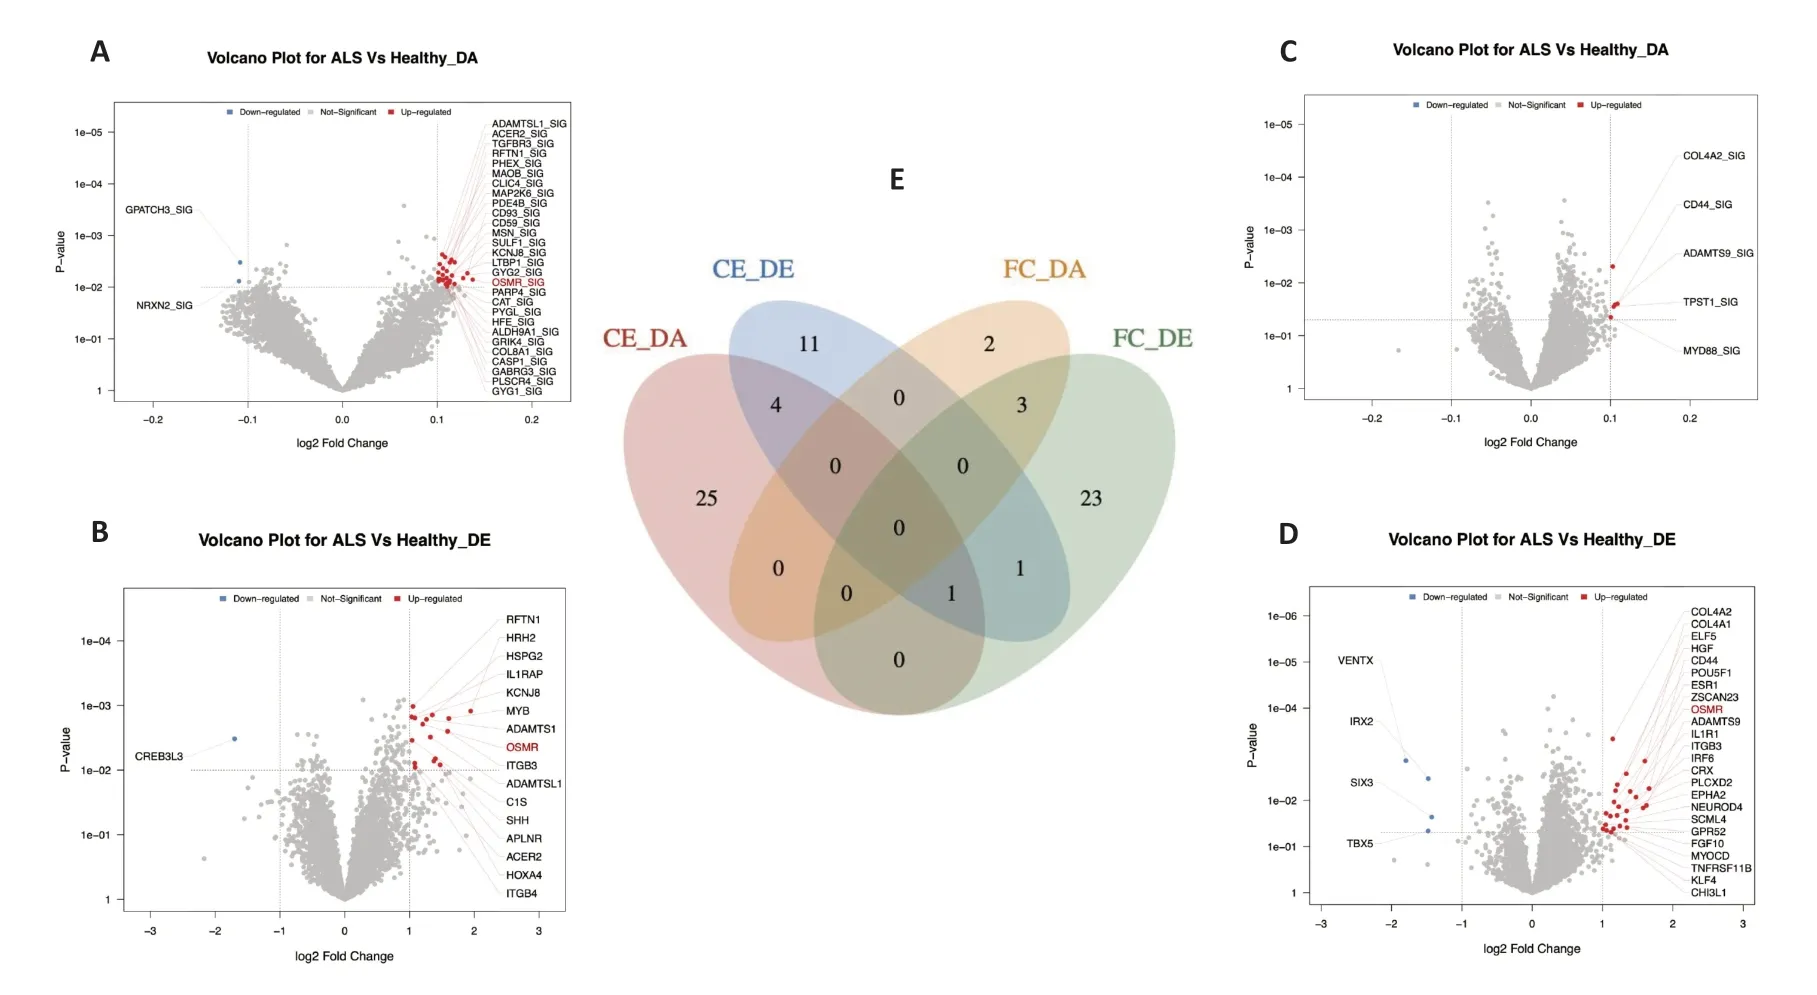
Figure 2|Distribution of significant DA and DE in different brain tissues of amyotrophic lateral sclerosis.
Significance and expression/activity patterns of the top DA drivers
AsFigure 3Ashows,compared to the healthy group,the expression values of the target genes regulated by up DA drivers in the ΑLS group were often higher,while the opposite was true for down DA drivers.For example,as seen inFigure 3A,the OSMR_SIG driver had significantly increased activity in ΑLS patients compared to healthy controls (P=7.2e-03).This driver had approximately 60 positively regulated target genes,whose logFC values were mostly positive and highly ranked.This means that,compared to the healthy population,these positively regulated target genes had significantly positive logFC values in ALS,andvice versafor negatively regulated target genes.In this case,the expression patterns of the target genes contributed to the DΑ values of their respective drivers.Using the expression matrix and activity matrix of the top DΑ drivers in the cerebral cortex,we generated the heatmaps shown inFigure 3BandCto illustrate their expression/activity patterns.The pattern in the activity matrix is much cleaner than that seen in the expression matrix,which strongly suggests that activity values may be more suitable than expression values robust in sample classification than the for identified candidate drivers.
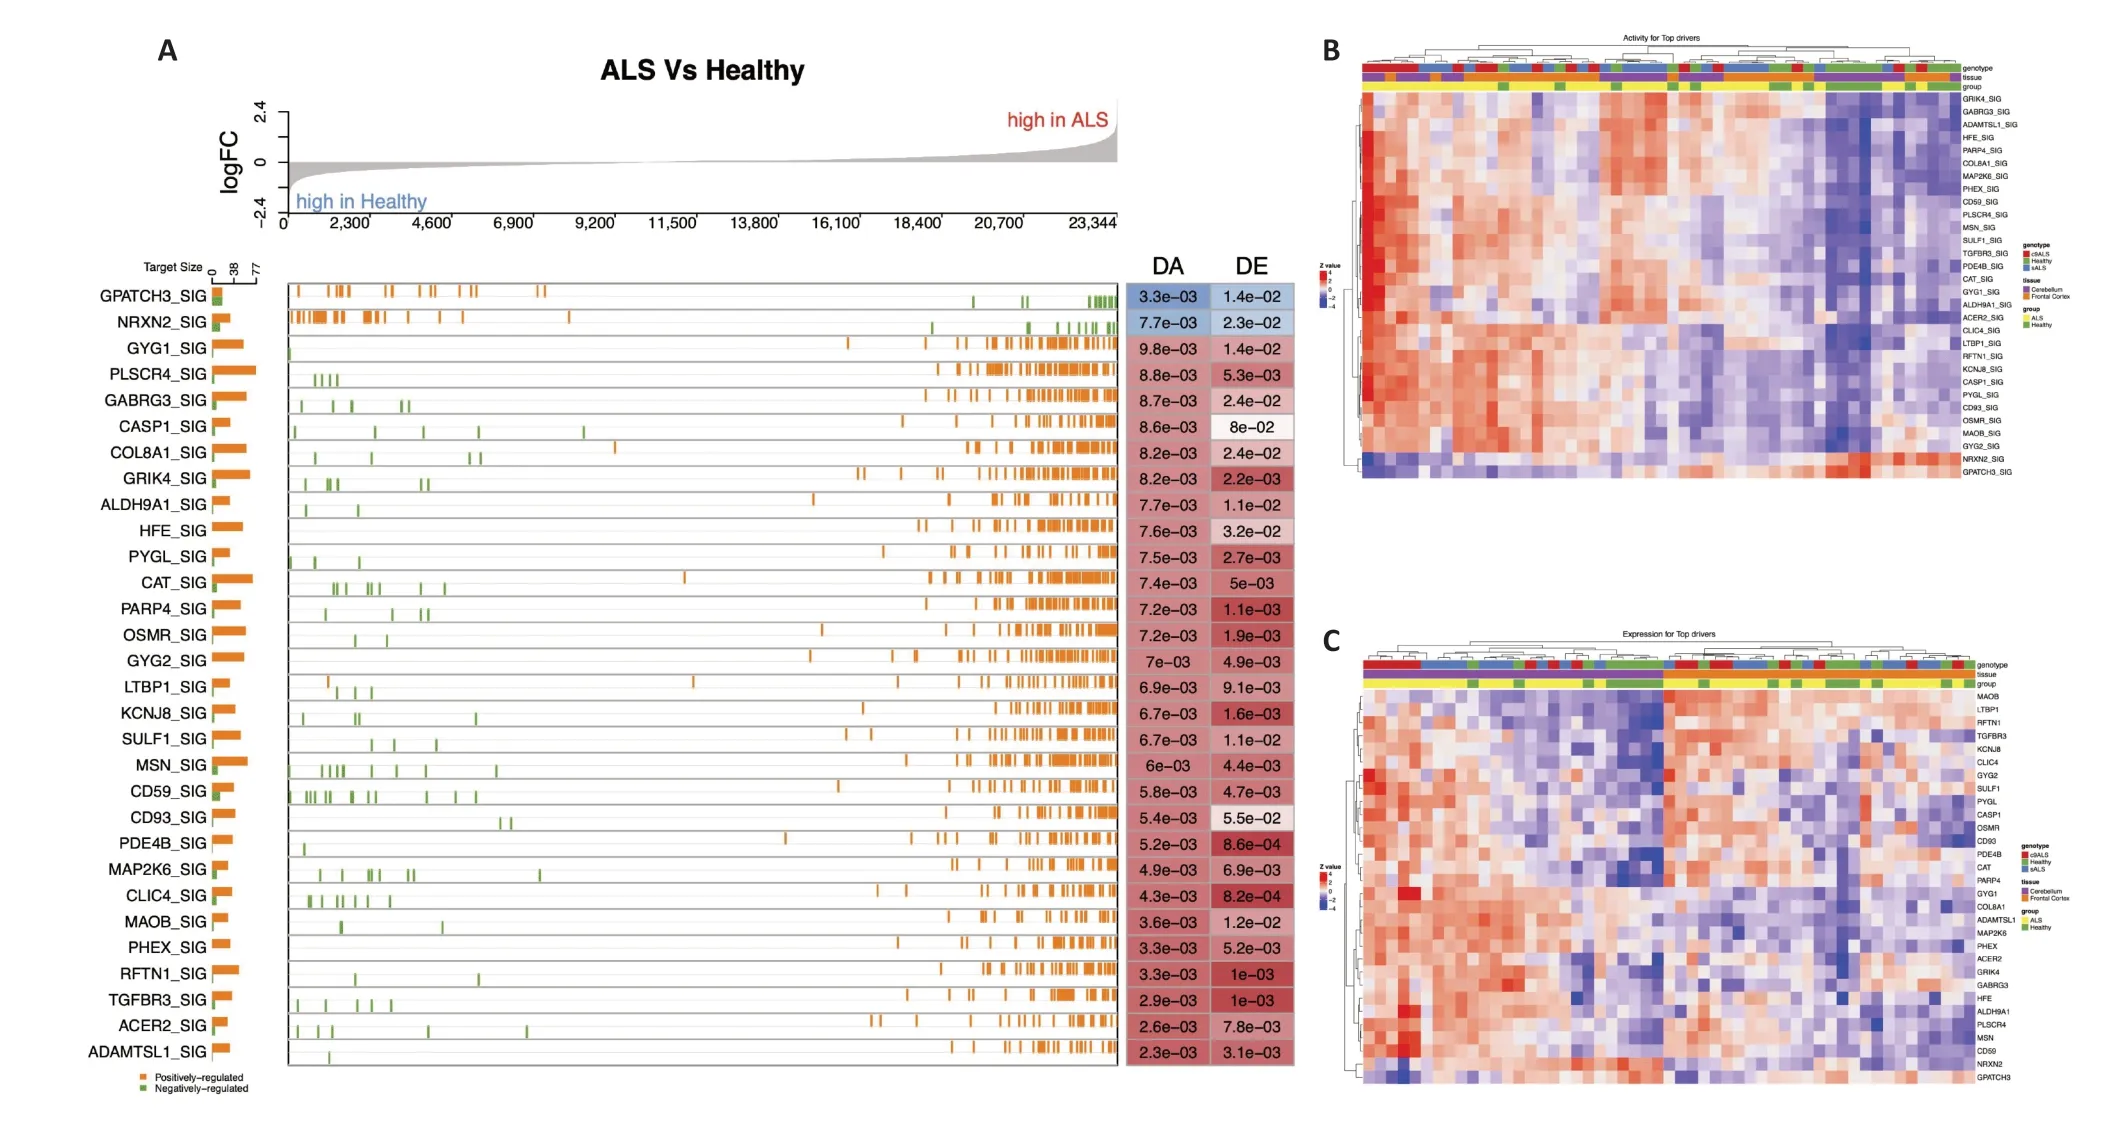
Figure 3| Significance and expression/activity patterns of top DA drivers in amyotrophic lateral sclerosis.
Biological functions of top DA drivers and target genes
In order to understand the biological functions of the drivers,we conducted gene set enrichment analysis of the top DA drivers.Figure 4AandBshow the enrichment results for these DA drivers.InFigure 4A,the top 30 enriched terms were grouped into five clusters.The gene groups composed of mitogen-activated protein kinase kinase 6 (MAP2K6),poly(ADPribose) polymerase family member 4 (PARP4),ACER2,collagen type VIII alpha 1 chain (COL8A1),RFTN1,chloride intracellular channel 4 (CLIC4),CD59 molecule (CD59),andOSMR,which showed high enrichment,were related to breast cancer subtypes,human alveolar rhabdomyosarcoma,heart failure,and Ewing’s family tumor.Figure 4Bshows the enrichment results in a bar graph,with OSMR highlighted in red to show the related terms it participates in.Unlike the gene function similarity clustering shown inFigure 4A,Figure 4Bsorts the enrichment results byP-value and counts the number of enrichment terms,providing a clearer visualization of the mathematical variations in the enrichment results.This serves as a supplementary illustration toFigure 4A.In addition to the previously mentioned conditions,OSMR is also related to diabetic nephropathy,glomerular development,and the bacterial defense response.Based on the clustering entries shown inFigure 4AandB,which are based solely on the enrichment results of the top DA drivers,it is unclear whether OSMR is involved in the inflammatory response.Αdditionally,we analyzed the biological functions of the target genes of these top DA drivers,which are presented as a bubble plot inFigure 4C.From the plot,it can be seen that the target genes of the ΑLS up driver OSMR_SIG are significantly enriched in the term“HALLMARK_INFLAMMATORY_RESPONSE”(P=1e-10),with six intersecting genes.Figure 4Calso shows that the OSMR target genes are enriched in “HΑLLMΑRK_IL6_JΑK_STΑT3_SIGNING”(P=1e-10,with four intersecting genes).This suggests thatOSMRmay participate in the inflammatory response in ΑLS.
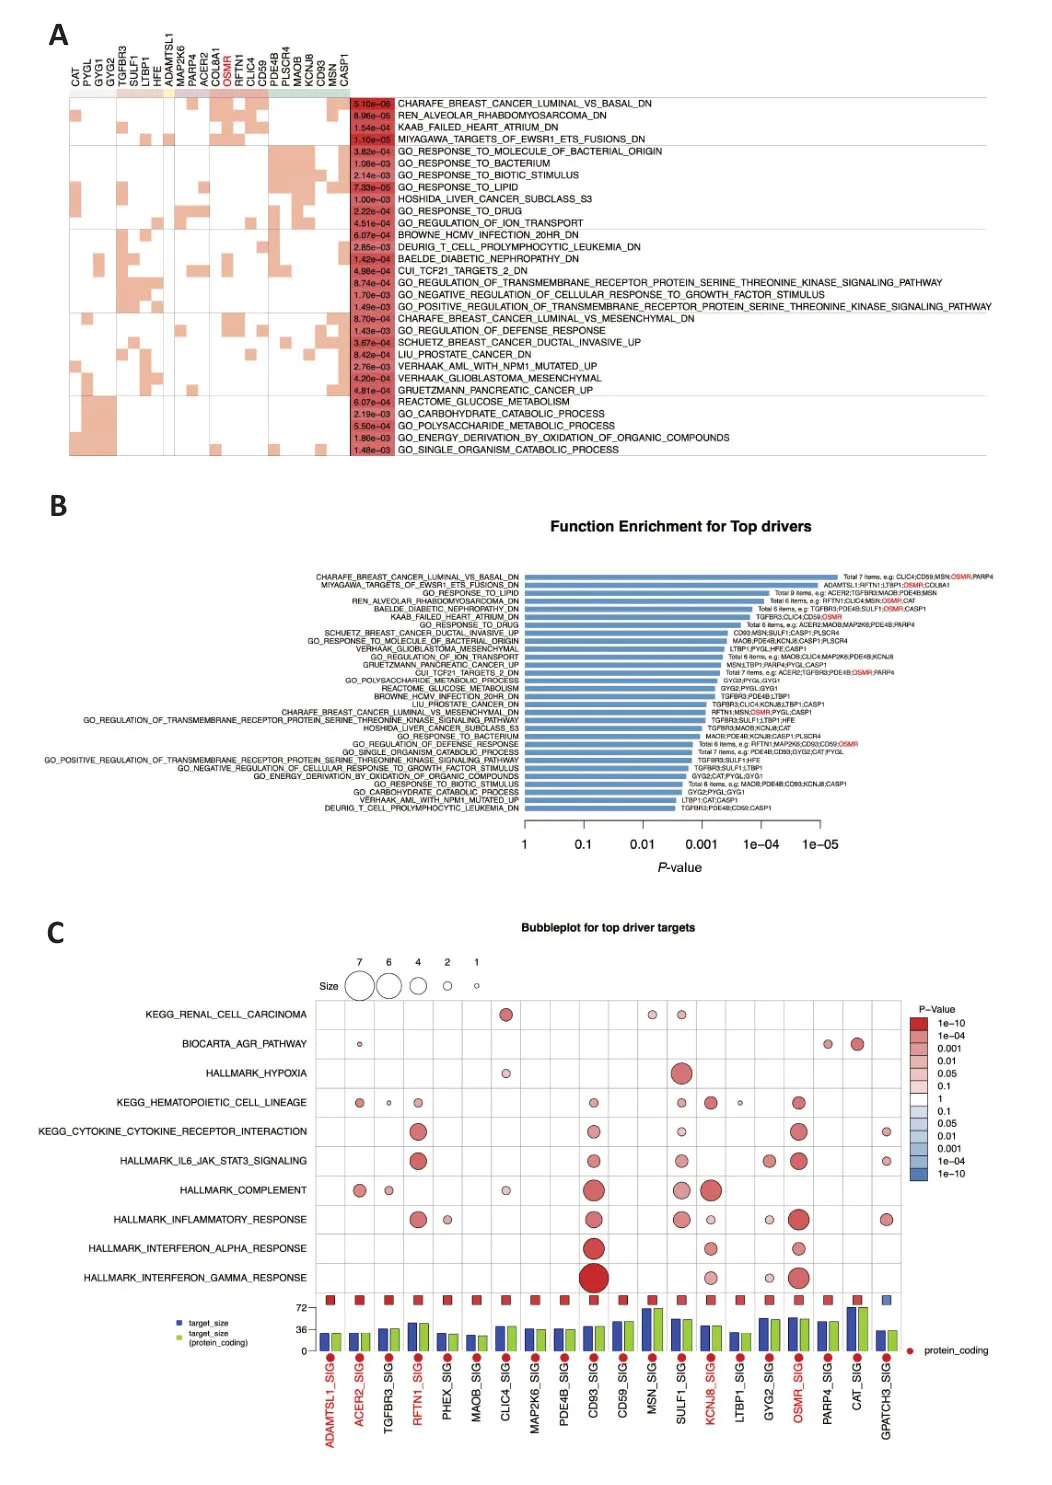
Figure 4|Biological functions of candidate drivers with the top DA values and their target genes in amyotrophic lateral sclerosis.
Functional enrichment analysis and network structural characteristics of OSMR target genes and differences in OSMR expression/activity between subgroups
As mentioned previously,OSMRwas the only gene shared among the DE group for the frontal cortex and the DA and DE groups for the cerebellum.This suggests thatOSMRmay play an important role in the pathogenesis of ALS,and that understanding the role thatOSMRand its target genes play in ALS is crucial.We first drew a GSEA plot forOSMRbased on the master table results,as shown inFigure 5A,and this plot highlights thatOSMRis a core gene in ALS.Figure 5Bshows the network structure ofOSMRand its target genes,demonstrating thatOSMRmainly positively regulates its target genes,and the only negatively regulated target genes were G-patch domain containing 3 (GPATCH3) and galactosamine(N-acetyl)-6-sulfatase (GALNS).GSEA showed that theOSMRtarget gene group with the highest enrichment was related to the inflammatory response (P=2.97e-6).The target gene group participating in the inflammatory response included 12 genes: TNF receptor superfamily member 1A (TNFRSF1A),TNF receptor superfamily member 10d (TNFRSF10D),TNFΑIP3 interacting protein 2 (TNIP2),interleukin 4 receptor (IL4R),phospholipid scramblase 1 (PLSCR1),F11 receptor (F11R),S100 calcium binding protein A8 (S100A8),serpin family A member 3 (SERPINA3),intercellular adhesion molecule 1(ICAM1),and nuclear factor kappa B subunit 2 (NFKB2) (Figure 5C).In addition,we found that,compared to the healthy population,the expression and activity levels ofOSMRin ALS patients were both significantly increased (Figure 5D).Interestingly,the activity and expression levels ofOSMRwere higher in patients with cΑLS than in those with sΑLS.

Figure 5|Significance of OSMR and its expression pattern among subgroups,as well as the functional and network characteristics of OSMR target genes,in amyotrophic lateral sclerosis.
Elevated OSMR expression levels are confirmed in in vitro and in vivo models of ALS
We validated the changes inOSMRexpression in ALS through western blotting.Figure 6AandBdepict the changes inOSMRexpression in cell and animal models,respectively,whileFigure 6C–Fshow the quantitative results of OSMR and SOD1 expression level analysis.Αs depicted in the figures,compared to the control group,OSMR expression was significantly elevated in both the cell and mouse models of ALS.This is consistent with our previous NetBID 2.0 and SJARACNe results that identifiedOSMRas a driver.
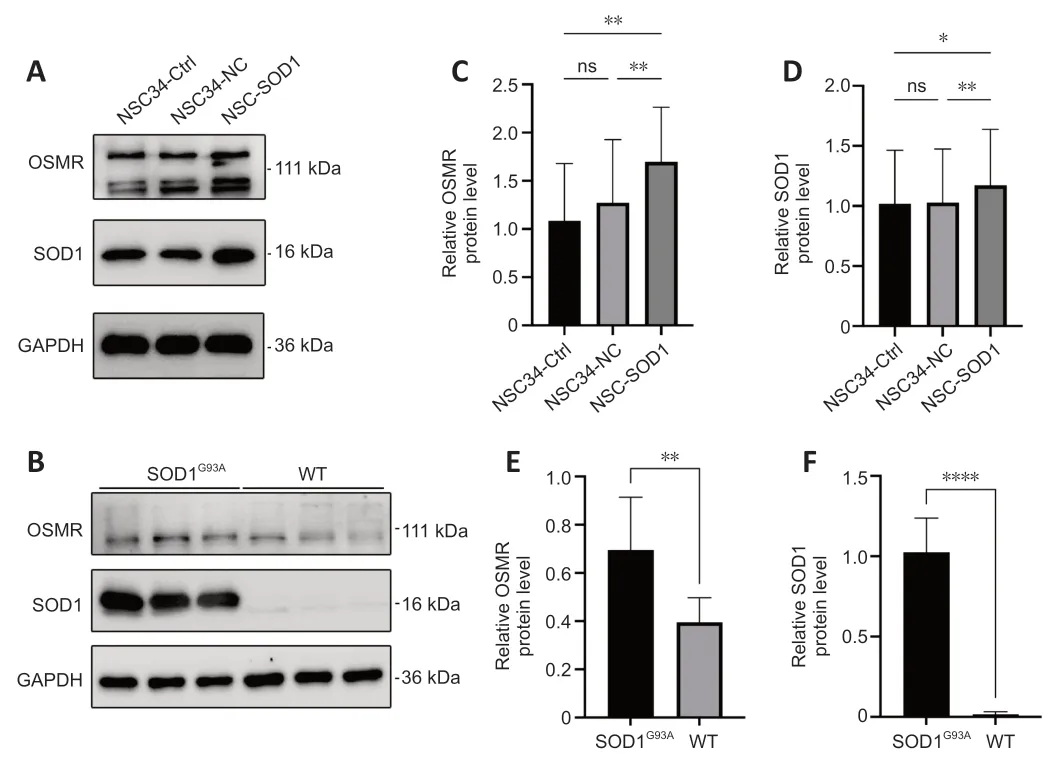
Figure 6|OSMR is highly expressed in cell and mouse models of amyotrophic lateral sclerosis.
Discussion
The mechanism of ΑLS is complex and unclear,and multiple factors are believed to be involved in the disease process,including genetic mutations,oxidative stress damage,mitochondrial homeostasis imbalance,neuroinflammation,endoplasmic reticulum stress,toxic protein aggregation,and more (Andersen,2004;Hetz and Saxena,2017;Feldman et al.,2022;Giallongo et al.,2022;Jiang et al.,2022;Collier et al.,2023).To identify the potential key pathogenic mechanism of ALS,we performed driver inference analysis of the GSE67196 RNASeq dataset using NetBID 2.0 and SJARACNe.Due to the fact that the dataset is composed of sequencing data from different brain tissue structures that are difficult to merge by removing batch effects,we performed separate driver inference analyses of each of sequencing data from each of the different brain tissues,then identified common drivers between the groups,to improve the reliability of the results.There were five common inferred drivers in the DA and DE lists from the cerebellum––ADAMTSL1,ACER2,RFTN1,KCNJ8,andOSMR––andOSMRalso appeared on the DE list for the frontal cortex.Therefore,we believe that OSMR is likely to play an important role in ALS development.
Comparative analysis showed thatOSMRactivity and expression were increased in ALS samples compared to healthy population samples.We also demonstrated thatOSMRexpression was increased in cellular and mouse models of ALS.A driver’s activity is evaluated based on the expression pattern of its target genes.So,if a driver’s activity value is significantly higher in ALS patients than in healthy individuals,this could mean that: (a) the positively regulated target gene is significantly upregulated in ALS compared to the healthy population,or (b) the negatively regulated target gene is significantly downregulated in ALS compared to the healthy population.Generally,OSMRactivity was determined by the expression pattern of its target genes.The increase inOSMRactivity in ALS could be due to the significant upregulation of positively regulated target genes or the significant downregulation of negatively regulated target genes in ΑLS.Through GSEΑ analysis,we excluded the latter possibility,as the majority of theOSMRtarget genes were upregulated in ALS.This suggests thatOSMRis likely to be a neurodegenerative factor in ΑLS.
OSMR,or oncostatin M receptor,is the protein encoded by the humanOSMRgene.It is a member of the cytokine receptor superfamily and can be activated by OSM,a cytokine belonging to the interleukin-6 (IL-6) family (Hermanns,2015;Lantieri and Bachetti,2022).OSMR is expressed in multiple cell types,including immune cells,neuronal cells,and tumor cells (Hermanns,2015).The interaction between OSM and OSMR can influence cellular processes such as cell apoptosis,cell cycle,and cell migration,thereby affecting cell growth,differentiation,and function (Hermanns,2015).
In addition,OSMR participates in physiological and pathological processes related to the nervous system (Houben et al.,2019;Hermans et al.,2022).Studies have shown that OSMR can help protect and repair neurons (Janssens et al.,2015),and changes in its expression have been observed in some nervous system diseases,such as Parkinson’s disease(Gao et al.,2019).However,in multiple sclerosis,OSMR activates the inflammatory response and causes damage to the blood-brain barrier (Hermans et al.,2022).Indeed,the role of OSMR in the central nervous system is still incompletely understood,and OSMR plays different roles in different cell types and molecular environments.Based on our findings,it appears that OSMR is a neurodegenerative factor,rather than a neuroprotective factor,in ΑLS.OSMRtarget genes showed significant enrichment in inflammation activation,suggesting thatOSMRmay mainly mediates the inflammatory response in ΑLS through activation of the IL-6-JΑK-STΑT3 signaling pathway.There are currently no detailed studies regarding the mechanism by which OSMR interacts with the IL-6-JΑK-STΑT3 pathway,and future work in this area is expected to increase our understanding of howOSMRdrives ALS pathogenesis.In addition,in the context of autoimmune diseases such as rheumatoid arthritis and multiple sclerosis,OSMRhas been shown to play a role in regulating the activation and function of immune cells such as T and B cells (O’Brien et al.,2021;Hermans et al.,2022),which is consistent with ourOSMRtarget gene clustering results.Therefore,combined with the well-established correlation between immune disorders and neural inflammation in ΑLS,our findings suggest thatOSMRis a potential driver of inflammation in the pathogenesis of ΑLS.
Numerous reports have demonstrated that ΑLS is a multigenic disease,with the most significant mutated genes beingSOD1,TDP43,C9ORF72,andFUS(Boylan,2015;Zou et al.,2016;Αl-Chalabi et al.,2017).SOD1is the first reported causative gene for ΑLS (Rosen et al.,1993),and many ΑLS disease models have been successfully constructed based onSOD1mutations.The ALS disease model used in this study is also aSOD1model and enabled us to confirm thatOSMRis highly expressed in ΑLS.It is worth noting that,when analyzing the differences inOSMRactivity and expression values between samples in the selected GSE67196 dataset,we found that theOSMRvalues differed not only between the healthy control group and the ALS group,but also between the sALS and cALS subgroups,as shown inFigure 5D.Unfortunately,given that establishing a cΑLS model is prohibitively expensive and time-consuming,we were unable to experimentally verify the differences inOSMRactivity and expression levels between the sALS and cALS through groups.Nevertheless,the difference inOSMRexpression levels between these two subgroups is still worth exploring as a diagnosis or prognostic marker.DetectingOSMRactivity and/or expression levels in patients is less expensive and more efficient than gene testing,but more research is needed before this approach can be used in the clinic.
Research indicates that OSM activity can impact neuron differentiation (Hermanns,2015) and participate in regulating synapse formation (Mousa and Bakhiet,2013).In addition,OSM activity has been shown to regulate the activity of glial cells (Baker et al.,2008),which are immune cells in the brain that play a role in inflammation and neurodegeneration (Lall and Baloh,2017).In Alzheimer’s disease,OSM may help activate glial cells to produce pro-inflammatory cytokines and contribute to neuron and synapse damage (Kordula et al.,1998).Interestingly,repeat expansions in theC9ORF72gene,which has been observed in both ALS and FTD,have also been reported to be associated with glial cell activation (Lantieri and Bachetti,2022).In addition,studies have reported that glial cell activation is increased in cALS compared to sALS(Glasmacher et al.,2020;Trojsi et al.,2020).Taking into account our finding of differences inOSMRactivity between different ALS subgroups,we speculate that higherOSMRactivity may increase the risk of dementia in ΑLS patients.
In summary,OSMR is a multi-functional cytokine with important physiological and pathological roles in the nervous system.Studying the physiological and pathological effects of OSMR can help us better understand the mechanisms underlying neurodegenerative diseases and provide new insights into the treatment of these diseases.However,research on OSMR is still in its early stages,and there is still much that is unknown about its role in the nervous system.As OSMR research continues,we hope to discover new information about its role in the nervous system and develop more effective therapies for related diseases in the future.
Α limitation of our study is that we did not determine whetherOSMRactivity and expression levels are higher in cALS than in sporadic ALS.In addition,the specific mechanism by which OSMR promotes inflammation in ALS was not determined,although we speculate that OSMR mediates neuroinflammation in ΑLS through the IL-6-JΑK-STΑT3 pathway.Finally,the possibility that OSMR could serves as a diagnostic/prognostic marker of ΑLS,and that its increased activity and expression levels may increase the risk of dementia in ALS patients,should be confirmed in a clinical cohort study.
In conclusion,in this study we identifiedOSMRas a potential driver of ALS pathogenesis and validated is high expression level in cellular and mouse models of ALS.We believe thatOSMRprimarily contributes to neuronal damage and neurodegeneration in ΑLS by promoting neuroinflammation.We also found higher activity and expression levels ofOSMRin cALS compared to sALS,and we hypothesize that this confers a greater risk of developing dementia.
Author contributions:Conceptualization:WC and RX;data curation:WC;formal analysis:CL and SJ;funding acquisition,supervision:RX;methodology:SL;resources,validation:SJ;visualization:CL,WC;writing– original draft:SL,SJ;writing– review &editing:SJ,RX.All authors read and approved the final manuscript.
Conflicts of interest:The authors declared no potential conflicts of interest with respect to the research,authorship,and/or publication of this article.
Data availability statement:All data generated or analyzed during this study are included in this published article and its Additional files.
Open access statement:This is an open access journal,and articles are distributed under the terms of the Creative Commons AttributionNonCommercial-ShareAlike 4.0 License,which allows others to remix,tweak,and build upon the work non-commercially,as long as appropriate credit is given and the new creations are licensed under the identical terms.
Additional files:
Additional Table 1:Final master table for all possible drivers of cerebellum.
Additional Table 2:Final master table for all possible drivers of frontal cortex.
Additional Table 3:The common intersection driver list of the cerebellum and frontal cortex.
- 中國神經再生研究(英文版)的其它文章
- A sphingolipid message promotes neuronal health across generations
- Krüppel-like factor 2 (KLF2),a potential target for neuroregeneration
- Defined hydrogels for spinal cord organoids: challenges and potential applications
- Neuronal trafficking as a key to functional recovery in immunemediated neuropathies
- Advancements in personalized stem cell models for aging-related neurodegenerative disorders
- New insights into astrocyte diversity from the lens of transcriptional regulation and their implications for neurodegenerative disease treatments