
Heat transfer and temperature evolution in underground mininginduced overburden fracture and ground fissures:Optimal time window of UAV infrared monitoring
2024-02-17 05:41YixinZhaoKangningZhangBoSunChunweiLingJihongGuo
礦業科學技術學報 2024年1期
Yixin Zhao *,Kangning Zhang ,Bo Sun ,Chunwei Ling ,Jihong Guo
a Beijing Key Laboratory for Precise Mining of Intergrown Energy and Resources,China University of Mining and Technology-Beijing,Beijing 100083,China
b School of Energy & Mining Engineering,China University of Mining and Technology-Beijing,Beijing 100083,China
c State Key Laboratory of Coal Resources and Safe Mining,China University of Mining and Technology-Beijing,Beijing 100083,China
Keywords:Heat transfer Overburden fracture Ground fissures Infrared thermal imaging Unmanned aerial vehicle (UAV) COMSOL simulation
ABSTRACT Heat transfer and temperature evolution in overburden fracture and ground fissures are one of the essential topics for the identification of ground fissures via unmanned aerial vehicle(UAV)infrared imager.In this study,discrete element software UDEC was employed to investigate the overburden fracture field under different mining conditions.Multiphysics software COMSOL were employed to investigate heat transfer and temperature evolution of overburden fracture and ground fissures under the influence of mining condition,fissure depth,fissure width,and month alternation.The UAV infrared field measurements also provided a calibration for numerical simulation.The results showed that for ground fissures connected to underground goaf (Fissure I),the temperature difference increased with larger mining height and shallow buried depth.In addition,Fissure I located in the boundary of the goaf have a greater temperature difference and is easier to be identified than fissures located above the mining goaf.For ground fissures having no connection to underground goaf (Fissure II),the heat transfer is affected by the internal resistance of the overlying strata fracture when the depth of Fissure II is greater than 10 m,the temperature of Fissure II gradually equals to the ground temperature as the fissures’ depth increases,and the fissures are difficult to be identified.The identification effect is most obvious for fissures larger than 16 cm under the same depth.In spring and summer,UAV infrared identification of mining fissures should be carried out during nighttime.This study provides the basis for the optimal time and season for the UAV infrared identification of different types of mining ground fissures.
1.Introduction
China is one of the major coal-producing countries in the world which has a great amount of good quality coal.According to statistics,coal production reached 3.85 billion tons in 2018 [1].In China’s western mining area,Shaanxi,Xinjiang,and Inner Mongolia accounted for 63% of the total coal production,and this area has become the dominant coal-producing region [2].The Shendong coalfield is located in Shenmu City,Shaanxi Province,which belongs to the arid and semi-arid area.The environment in this area is extremely fragile[3].In addition,this area is generally characterized by a shallow burial depth,large thickness,thin bedrock,and thick loose layers.Most of the mines have superior coal endowment conditions and good mining conditions,which adopt high-intensity top-coal caving mining and large mining height technology [4].High-intensity mining leads to serious damage to these arid and semiarid areas,especially mining ground fissures[5–7],which further contributes to land desertification and vegetation degradation [8,9],while mining ground fissures connected to goaf lead to coal combustion [10,11].Therefore,timely,fast,and accurate identification of mining ground fissures is the foundation for the treatment of ground fissures.
Currently,there are many monitoring methods,mainly including level instruments,total station instruments,and real-time kinematic global navigation satellite systems (RTK-GNSS) [12,13].Although the above techniques have high accuracy,the measurement process and data processing are extremely time-consuming and complicated [14].With the development of new technology and interdisciplinary approaches,interferometric synthetic aperture radar (InSAR) and advanced InSAR technology,such as differential InSAR (D-InSAR),permanent scatterer InSAR (PS-InSAR),small baseline subset (SBAS) has been introduced to monitor ground subsidence and different displacement on both sides of ground fissure and analyze their evolution [15–17].However,mining-induced large subsidence generally led to the failure of phase unwrapping.The application of 3D laser scanning technology has also been reported in relevant references [18],However,the scanning range is limited by the terrain of the objects.
Although previous researches have investigated the ground fissures evolution,most of them were used to monitor previous identified ground fissures.Thus,there is an emerging requirement to propose a fast,high-resolution,and cost-effective method to identify,characterize,and quantify ground fissures in coal mining area.
UAV remote sensing technology has been widely used because of its characteristics of fast processing,high resolution,and a large amount of data acquired in real-time.At present,application of visible light remote sensing for monitoring ground fissures in the mining ground has been reported.However,the visible light remote sensing is easily affected by clouds,surface vegetation cover,and cannot achieve all-day observation.The objects with temperature higher than 0 K can emit infrared radiation,which can pass the vegetation gap,clouds and be captured by infrared imaging [19].
The application of thermal imaging onboard satellite platform for monitoring the ground temperature and fissures have been known and reported.For instance,coal fire monitoring[20–22],fissure and defect detection [23–25].UAV infrared remote sensing technology has also been widely used for artificial delamination detection on a concrete bridge deck specimen [26–28].Moreover,Afshani et al.[29] detected defects in the concrete lining of a tunnel by infrared thermography.Tavuk?uog?lu et al.[30] monitored structural cracks on the inner surface of an ancient building by using an infrared camera.Baronˇet al.[31] monitored open cracks in deep-seated rockslides and unstable cliffs by using a drone and infrared thermography.
Unlike the fracture distributed on concrete surface of tunnel,and natural rock,mining ground fissures are mainly influenced by geological conditions (thick coal seams,overburden thickness,and strata geology) and coal mining features (mining height and layout of working face).However,the heat transfer of air flow in these ground fissures will lead to temperature evolution,especially under the influence of continuous mine ventilation.Moreover,periodic atmospheric temperature change will lead to pressure fluctuation in both ground and underground goafs,and will further change the flow pathway [32–34].
The temperature evolution and difference induced by heat transfer of air flow provide a basis for the infrared monitoring.However,the proposed infrared technology still needs a great substantial field measurement in different conditions.The numerical simulation is an effective way to simulate various conditions.At present,the commercial software COMSOL Multiphysics has been widely employed for investigating the heat transfer in fractured rock mass and underground spaces.For instance,Chen et al.[35,36] studied the heat transfer and seepage characteristics of large fractured surrounding rocks in deep underground spaces.Cao et al.[37] discussed the temperature and pressure fields for multistage fractured horizontal wells during the single-phase oil production process.Sirdesai et al.[38] predicted the thermogeomechanical response of the strata during underground coal gasification,and studied the mechanical response and heat conduction of the host rock around the gasification chamber.Moreover,the UDEC and COMSOL numerical simulation were employed to study the gas migration into mining-induced fracture network in the goaf [39].However,the combination of UAV infrared and UDEC/COMSOL simulation to study heat transfer and ground fissures temperature evolution under different conditions have not been reported.
Therefore,field measurement and numerical simulation were carried out to investigate the heat transfer and temperature evolution,and the optimal time window for UAV infrared identification of ground fissures.The rapid identification of ground fissures provides the fundamental and crucial base for timely treatments and is of great significance to ensuring safety of underground mining.
The paper is structured as follows:Section 2 describes the engineering background.Section 3 details the methodology including the manual measurement and UAV field survey,procedure of UDEC and COMSOL simulation.Section 4 presents the main results.Section 5 presents the discussion,the field measurement and numerical simulation were comparatively discussed,and the optimal time window was analyzed.Besides,the shortcomings and prospects were presented.Section 6 summarizes the main conclusions.
2.Investigation site background
This study is based on the 12401 working face of Shangwan colliery in Shendong mining area,which is located in the eastern part of Ordos city,Inner Mongolia Autonomous Region.The 12401 large mining height working face of Shangwan colliery is the first mining face of 1–2 coal seam in the fourth-panel area.The coal seam thickness varies from 7.56 to 10.79 m,the average thickness is 8.8 m,and with a dip angle of 1°–5°.The average length of 12401 working face in Shangwan colliery is 5254.28 m,and the width is 300 m.The mining speed is 13.46–20.58 m/d and the cover depth is 201.9 m.The 12401 working face is adjacent to the 12402 comprehensive mining face on the east,12412 mining face on the west,which has not been dug yet,and the Bulianta colliery on the north.
The generalized borehole histogram of 12401 working face is shown in Fig.1a.It can be seen that the 34.44 m thick coarse sandstone is the key strata based on the key strata theory [40],which control the overburden rock strata movement,and periodic fracture may lead to the development of ground fissures.

Fig.1.Geological conditions and layout of ROI of the study area.
As shown in Fig.1b,the region of interest(ROI)was arranged on the ground surface,which is directly above the central position of the 12401 working face,where the advancing distance is 238 m.The size and shape of the ROI is a 5.9 m × 6 m rectangular area(Fig.1c).Within the ROI,a mining ground fissure (Fissure I) of approximately 3 m long with several discontinuous and short,small fissures (Fissure II) were developed.
3.Methodology
3.1. Field measurements of ground features temperature
3.1.1.Fieldmeasurementmethod
Various types of equipment were used in this study,such as a Trimble GEO 7X RTK-GNSS receiver,which was used to locate the 12401 working face and ROI.The thermo-hydrograph and an anemograph were used to observe the humidity and temperature of the air and ground fissures in ROI.A DJI M600 Pro unmanned aerial vehicle(UAV)was used as the platform to install an infrared camera and visible camera.A FLIR Tau2 640R infrared imager and a Zenmuse Z3 visible light camera were used to collect the infrared images and visible images in ROI.
As shown in the flow chart of field measurement (Fig.2),the field measurements can be divided into manual measurement and UAV aerial photography.UAV aerial photography were conducted from 09:00 to 07:00 on the next day with an even interval of 2 h,which was performed 12 times intermittently.The UAV flight height is 15 m.First,for focal length,to obtain the highest image quality,place the infrared camera horizontally toward a marker with a constant temperature and adjust the infrared camera focus.Then,the IR camera was installed on the UAV and steadily elevated to a flight height of 15 m.Finally,the ROI zone was moved to the center of the IR image to obtain infrared images of ROI.To acquire high-quality and reliable dataset,the UAV aerial photography should avoid bad weather even rainy days.
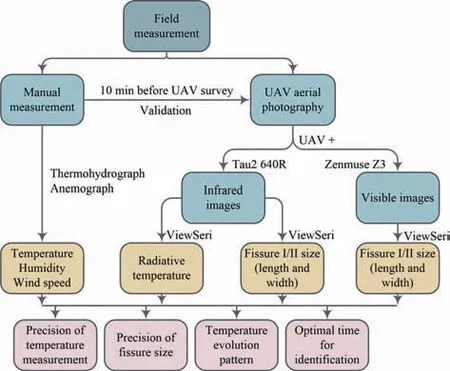
Fig.2.Flow chart of field measurement.
The manual measurements were chronologically organized 10 min before each aerial observation.The temperature and relative humidity of air,sand,and ground fissures were measured by a thermohydrograph,the wind speed was measured using an anemograph.The manual measurement data is also a benchmark for the UAV infrared data.Moreover,the whole procedure of the UAV aerial photography was conducted by the experts,and interference factors were excluded.
3.1.2.Temperatureextractionfromtheinfraredimages
A total of 12 groups of UAV IR images were captured at different times,and 12 images from each group were chosen.All 12 images were identical in resolution,orientation,and without dithering.The length reference in the ROI region’s corner can be used to calculate the IR image pixels.Target infrared radiative temperature information was extracted from image sequences acquired at 12 different monitoring moments by using the professional software ViewSeri Version 2.3.1.To reduce error,for each radiative image 30 sample pixels were selected separately from different positions.Each pixel point in the image contains the temperature of the actual observed target.A pixel value-based approach is used to extract the radiative temperature of plants,sand,and fissures.For sand and vegetation,50 and 20 pixels were chosen to analyze the temperature evolution trend.Due to the various sizes of fissures,it is necessary to statistically total the temperatures of all the pixel points that correspond to the fissures,and the temperature of Fissure I is obtained by calculating the average value.The collected data are examined for errors,and coefficients of variation to determine the dependability of the data.The fracture width may be calculated using the pixel values.
3.1.3.Validationoffieldmeasurementdata
The data obtained from the field measurement mainly included the temperature of sand,plants,and Fissure I,which provided the reference for evaluating the accuracy of the radiative temperature.The width of the Fissure I provided the reference for evaluating the error of the fissure width.The average temperature and width of Fissure I were calculated based on the method mentioned in 3.1.2.
The errors between manually measured temperatures and the infrared temperature of sand under the influence of different wind speeds are illustrated in Table 1.It can be seen that the error between the image temperature and the manually measured temperature shows an increasing trend with the increase in wind speed.The error is smaller under windless conditions,between 05:00 and 07:00,with absolute errors of 0.14 and 0.04 °C.At this time,infrared image accuracy is the highest.However,under low wind conditions (wind speed <2.5 m/s),such as 01:00,the absolute error is less than 4 °C,the relative error is less than 10%,and at this time infrared accuracy is up to (1±0.1) °C.Moreover,under high wind conditions,the absolute error and relative error are larger when the wind speed is 4 m/s at 17:00,at this time the infrared image accuracy is poor.
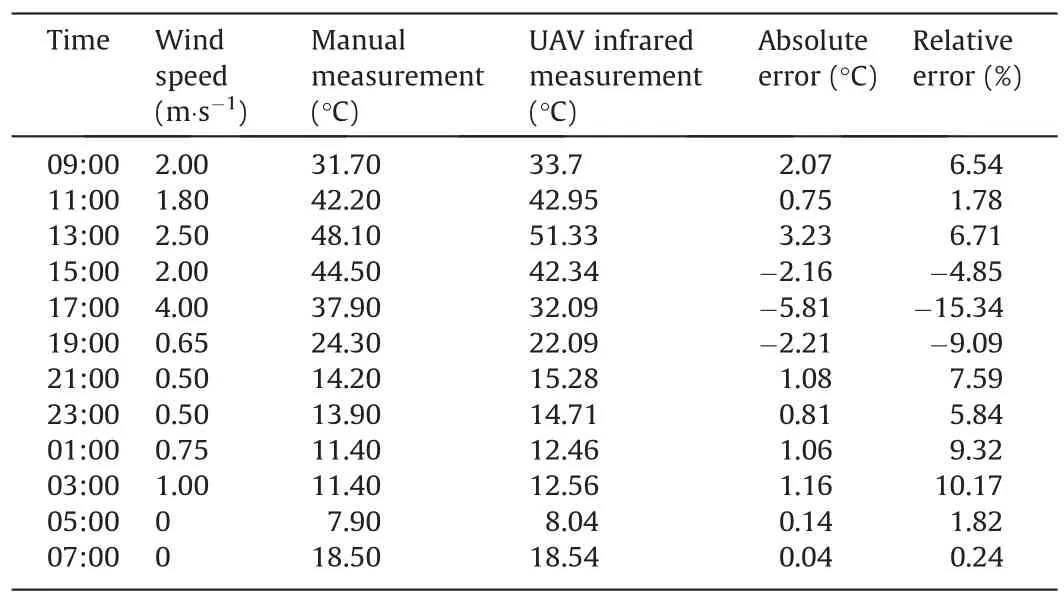
Table 1 The errors between manually measured temperatures and infrared measured temperature of sand under the influence of different wind speeds.
The errors in the width of Fissure I between manual measurement and UAV infrared measurement are illustrated in Table 2.The length of Fissure I extracted from infrared images at night is larger than that of daytime,and the difference and error are relatively small,and the error is the largest when day and night are alternating,so it is appropriate for UAV infrared measurement to be carried out during daytime or nighttime.UAV aerial survey was generally conducted under low wind speed conditions,and the observation accuracy met the requirements.From the error of length for different fissure types (Fissure I and Fissure II),UAV infrared observation can identify Fissure II with a temperature difference large than 5.2°C at 03:00,and 5.8°C at 05:00,respectively.

Table 2 The errors of length of Fissure I/II between manual measurement and UAV infrared measurement and temperature difference.
3.2. Discrete element modelling of the overburden fracture field
To provide references for the temperature simulation of mining ground fissures,a two-dimensional discrete element method(DEM) model was developed to obtain the characteristics of the overburden fracture field and ground fissures development along the strike direction.The overburden fracture and ground fissures at the boundary of the inclined direction are consistent with the boundary of the open-cut,the static ground fissures are generally distributed at the boundary of the strike direction,which have large fissure width and height difference.Therefore,the strike direction of working face was the main research content.
As shown in Fig.3a,the model size is 500 m×205 m,the mining height is 8.8 m,and the mining depth is approximately 180 m,with a loose layer thickness of 7 m.The model contains a total of 10431 blocks,divided into 173688 units.Moreover,the upper boundary of the model (y=205) was set as a free boundary,constraining the displacement in the horizontal direction at the left and right boundaries(x=0,500),and constraining the displacement in both the horizontal and vertical directions at the lower boundary (y=0).The gravitational accelerationg(-10 m/s2) was applied to the model.The Mohr-Coulomb model was chosen for the model.The Coulomb slip model was chosen for the contacts between rock blocks.In addition,the lithology and physical-mechanical parameters of each stratum are listed in Table 3.The joint properties of each rock layer are shown in Table 4.The block size and joints spacing and density were set based on the mechanical parameters.The small block size and joints spacing and density were generally assigned for the broken and weak rock layer.The material properties,including rock blocks and discontinuous joints,have been calibrated and estimated based on field measurements and previous empirical databases [41,42].
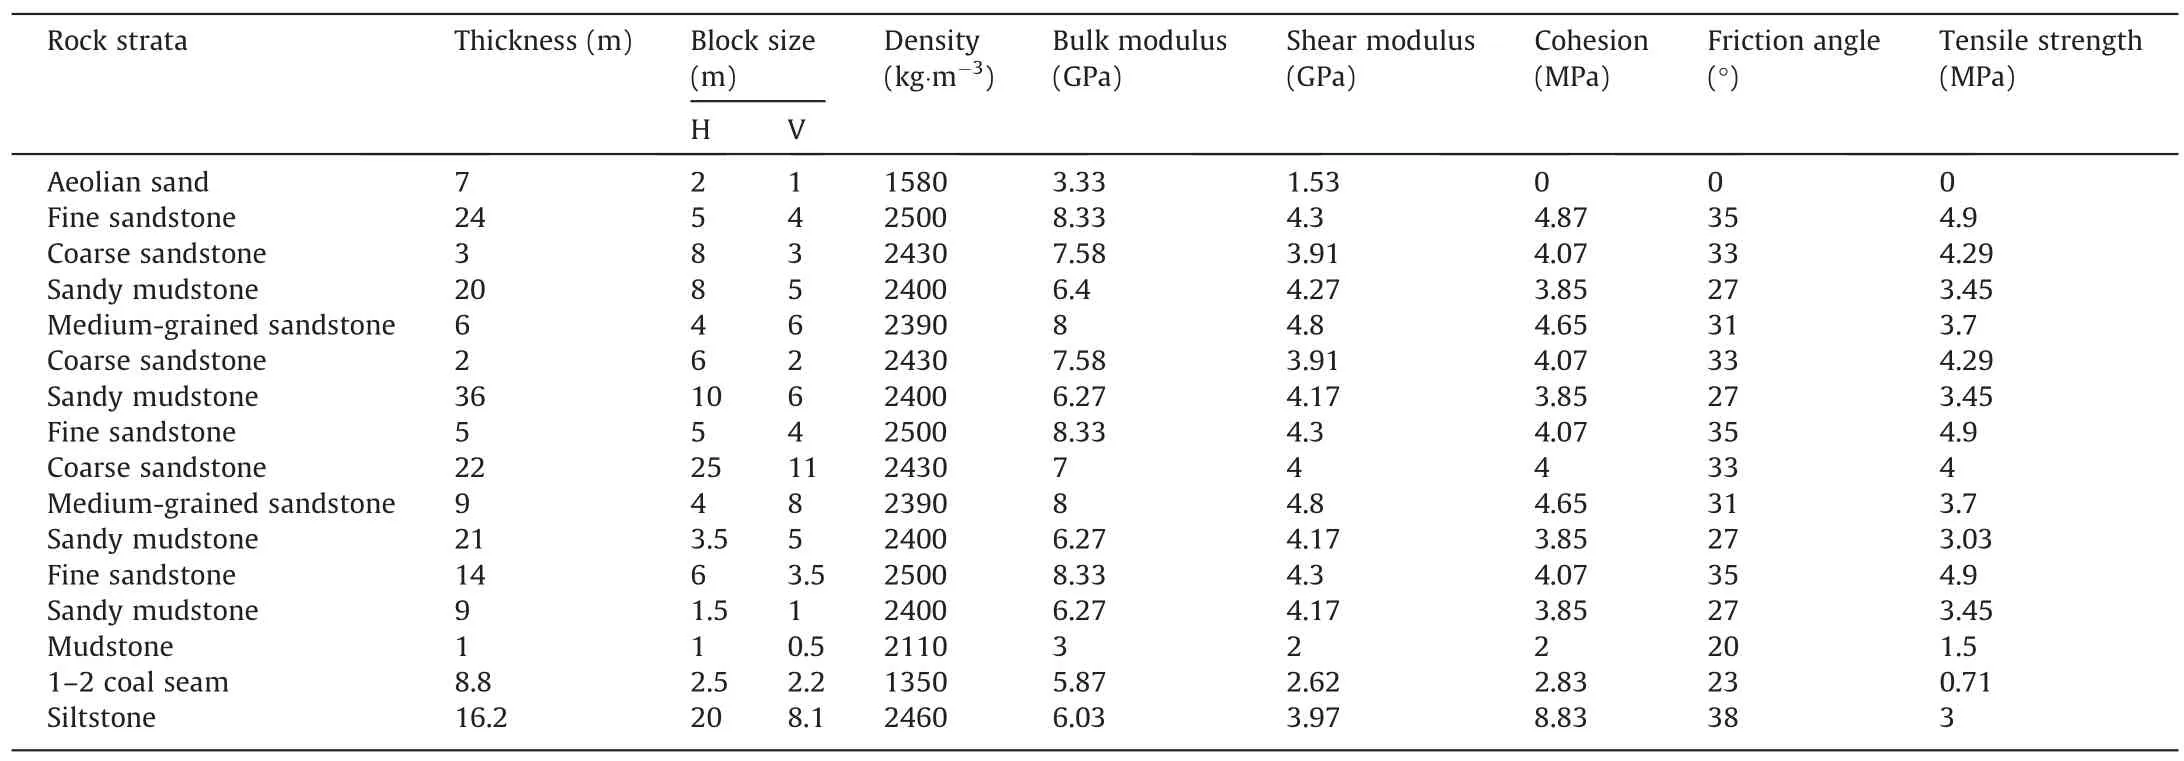
Table 3 Physical and mechanical properties of rock layers.

Table 4 Joint properties of rock layers.

Fig.3.UDEC simulation of 12401 working face.
The coal seam was continuously advanced for 300 m at a rate of 15 m/d in this DEM model.The roof of the working face was supported using the support command of UDEC software with a width of 4.5 m.A coal pillar of 100 m was left on each side of the model to eliminate the boundary effect.Similarly,the development of ground fissures and overburden fractures are simulated under different coal seam thicknesses and overburden thicknesses.The specific comparison scheme is listed in Table 5.
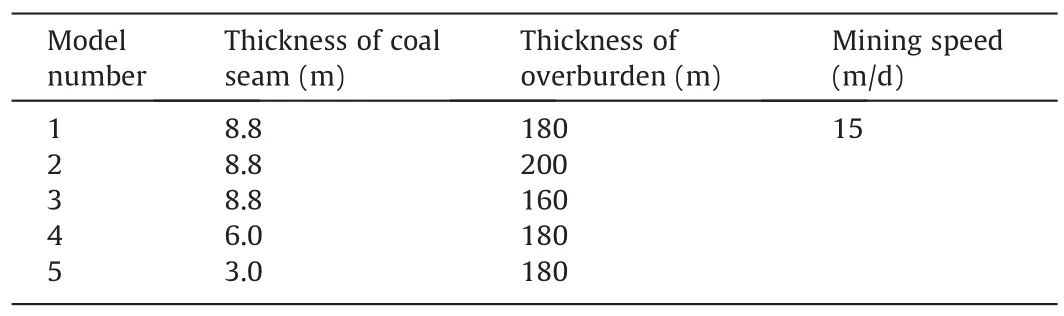
Table 5 UDEC modeling of different mining conditions.
3.3.Finite element modeling of ground and underground fracture fields
In this study,based on whether the fissures have a connection to a goaf or an underground aquifer,the ground fissures can be divided into 2 common types,specially,Fissure I (connection with a goaf or an underground aquifer) and Fissure II (no connection with a goaf or an underground aquifer).Ground fissures undergo an ‘‘opening-closure” development cycle,and fast mining can shorten evolution cycle [43,44].Therefore,different fissure width and depth were set to study the temperature evolution.TFIandTFIIindicate the temperatures of Fissure I and Fissure II,respectively.ΔTFI-Gis the temperature difference between Fissure I and theground surface.ΔTFII-Gis the temperature difference between Fissure II and the ground surface.TheTFIis systematically analyzed with consideration of mining conditions,the location of Fissure I from the working face(LFI),and width of Fissure I (WFI).TFIIis systematically analyzed with consideration of different fissure depths(DFII) and widths of Fissure II (WFII).In addition,the impact of month alternation throughout the year onTFIandTFIIwas thoroughly studied.
There are 2 typical atmospheric temperature conditions conducted in COMSOL numerical simulation: daytime (high ground temperature,and high atmospheric temperature) and nighttime(low ground temperature,and low atmospheric temperature),respectively.According to the field measurements in July,the ground and atmospheric temperatures are 50 and 25 °C during daytime,and 8 and 10 °C during nighttime,respectively.
The COMSOL numerical simulation in this paper can be divided into three aspects: (1) The variation of theTFIand ΔTFI-Gof different mining conditions,LFI,andWFIduring daytime and nighttime.(2)The variation ofTFIIand ΔTFII-Gof the differentWFIIandDFIIduring daytime and nighttime.(3) The variation ofTFI,TFII,ΔTFI-G,and ΔTFII-Gunder the average daytime and nighttime temperature of different months in a year.
3.3.1.ModelingofFissureI
According to the UDEC simulation results,the goaf can be divided into six areas,as shown in Fig.3b and c.Area I depicts the rock layers located between the main roof and the key stratum at the cutting hole.Area II shows the rock layers initially located between the main roof stratum and the key stratum in the recompaction zone.Area III exhibits the rock layers between the mainroof stratum and the key stratum in the fracture circle at the coal wall.Area IV is the broken stone after the immediate roof collapse at the cutting hole.Area V depicts the broken stone after the immediate roof collapse at the recompaction zone.Area VI is the broken stone after the immediate roof collapse at the coal wall.The goaf is defined as a porous medium,and the expansion coefficientKecand porosityKpoof each area are estimated as follows:
whereV' is the volume of the rock area after breakage,andVthe volume of the rock area before breakage.For the two-dimensional model,the area of the rock before breakageS' and the area after breakageSare used instead ofV' andV,respectively.TheS' andScan be obtained by the area measurement function of AutoCAD(Autodesk Computer Aided Design) for the enclosed area.
The above 6 areas of five models with different mining heights and different overburden thicknesses were measured and counted before and after mining using AutoCAD.First,the calibration boundary of same scale of UDEC models were depicted in Auto-CAD.Second,the picture of UDEC simulation results were imported to AutoCAD,the boundary of pictures was adjusted to overlap the calibration boundary step by step.Third,the overburden fracture area can be depicted,the values ofS' andScan be obtained by the area measurement function of AutoCAD for the enclosed area.Then,the expansion coefficients and porosity of each area were calculated.The goaf permeability can be calculated by Kozeny-Carman equation when the goaf was regarded as porous media.Thus,the permeability of each area can be estimated by as follows[45]:
whereDis the particle size of the broken rock.The particle size of the goaf should be considered under the influence of overburden movement and breakage [46],and the approximate value of the average size of the block was set within each area,and the value is taken as 6 m in Areas I,II,and III in fractured zone,and 1 m in Areas IV,V,and VI in caved zone.
The basic parameters of the loose layer,bedrock,coal seam,and air within the COMSOL model are listed in Table 6.The parameters of areaS,S',rock mass particle sizeD,density ρ,thermal conductivityKt,specific heat capacityCpof broken rock masses,and fragmentation expansion coefficientKec,porosityKpo,and permeabilityKpebefore and after excavation in each partition of the goaf under different mining conditions are listed in Table 7.

Table 6 Basic parameters of loose layer,bedrock,coal seam,and air in COMSOL model.

Table 7 Basic parameters of each area of goaf under different mining conditions.
The application of COMSOL simulation for studying temperature evolution in fracture by simplifying the fissures as a rectangle area in the 2D plane has been known and reported[47].Besides,for high-intensity mining in western coal field,the ground fissures are generally formed with the periodical failure of overlying strata,and the ground fissures are generally connected with the ground.Therefore,a total of six vertical mining fractures were added at different locations above the model (LFI=25,75,125,175,225,and 275 m),with the fracture’s upper end reaching the ground and the lower end connected to the mining goaf.The COMSOL simulation model and model cell division are shown in Fig.4.The above model was simplified to simulate the effect of differentLFIandWFIon theTFI.The specific variable settings are listed in Table 8.

Table 8 The simulation parameter setting under different LFI and WFI when the overburden thickness is 160 m and the mining height is 8.8 m.

Fig.4.Schematic diagrams of COMSOL model.
The conjugate heat transfer-laminar flow interface of COMSOL was chosen to simulate the gas flow and heat transfer in the atmosphere and fissures.The solution domain is the atmosphere and the fissures,with the gas inlet at the atmospheric boundary and the outlet at the connection between the overburden fracture and the goaf.The Darcy’s Law interface was added to solve the gasseepage field in the goaf.Its solution domain is the six mining areas of goaf.The inlet 1 is the laminar flow outlet,and the second inlet is set at the working face.Meanwhile,solid heat transfer and porous media heat transfer modules were added to the COMSOL model.The model temperature boundary and initial conditions were set and solved.
3.3.2.ModellingofFissureII
The effects ofWFIIandDFIIon the evolution ofTFIIwere analyzed by numerical simulation during daytime and nighttime.For Fissure II,gas flow within the fissure is influenced by both its self-weight and the temperature difference in the fissure.In this case,the fissure model needs to be re-modeled.The model was divided into an atmospheric part above the ground surface and a solid part below the ground surface (Fig.5a).The width of the model is 2×DFII.The thickness of the atmosphere isDFII.The thickness of the solid part of the model is 2×DFIIso that the distance of the fissure from the model boundary is equal to its own length to reduce the boundary effect.When theDFIIreaches 4 m,the thickness of the solid part exceeds the thickness of the loose layer (7 m) and the model is extended to Fig.5b.The different schemes ofWFIIandDFIIin the simulation model are listed in Table 9.
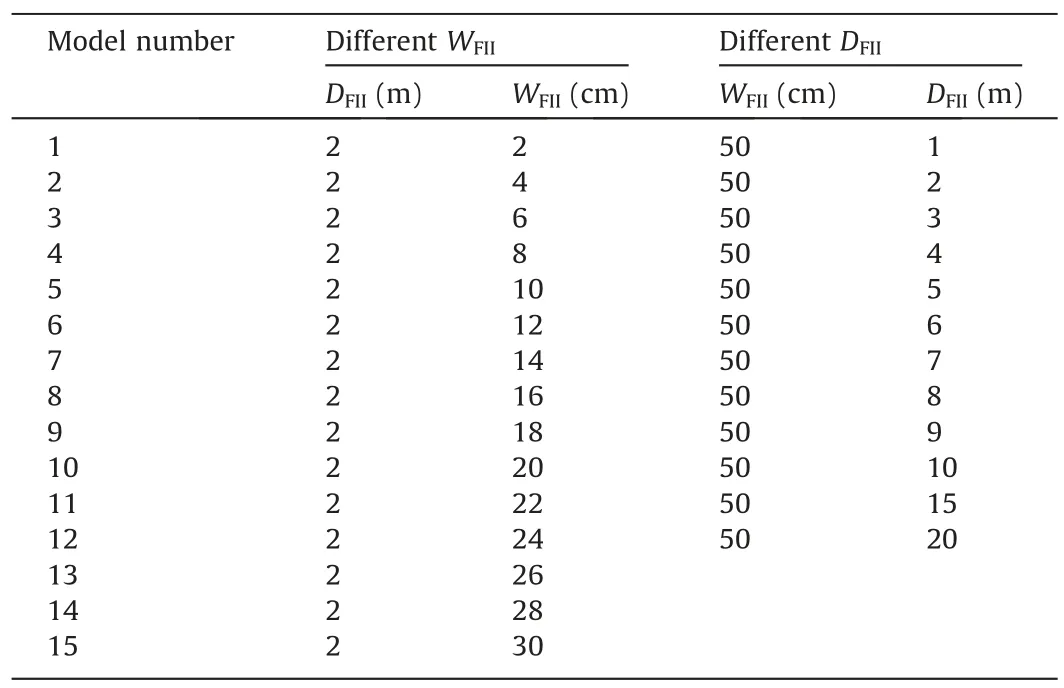
Table 9 The TFII simulation parameters setting under different WFII and DFII.
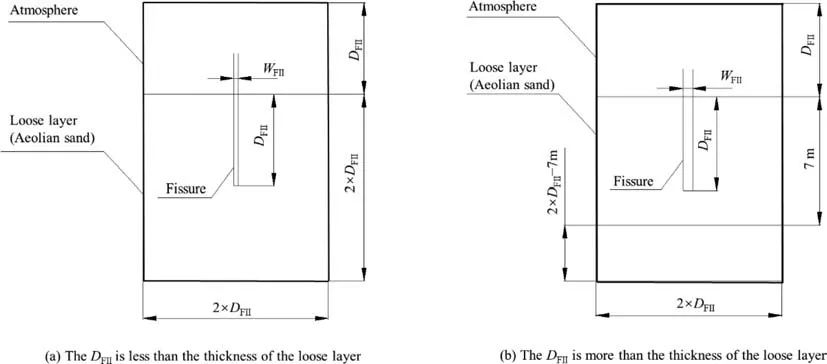
Fig.5.Schematic diagram of COMSOL model of Fissure II.
3.3.3.Modellingofdifferentmonths
To study the evolution ofTFIandTFII,and the temperature difference in different months,numerical models were established according to Figs.4 and 5.Based on the meteorological data of Ordos from 1971 to 2000,the average maximum and minimum temperatures of each month in the Ordos area were collected.The temperature difference reached the maximum in June and July and a minimum in January and December[48,49].According to the measured data,the temperature difference was 21.4°C during daytime and -2.4 °C during nighttime.Therefore,the average maximum ground temperature and minimum ground temperature of each month in Ordos were set according to Table 10.

Table 10 Maximum,minimum air temperature and ground temperature of Ordos in different months.
4.Results
4.1. Variation patterns of the ground feature temperature in ROI
4.1.1.Diurnalvariationpatternsofthegroundfeaturetemperaturein ROI
The average radiative temperatures of ground features (Fissure I,plants,and sand) at different times are shown in Fig.6a.From 09:00 to 13:00,the average radiative temperature of Fissure I,plants and sand increased rapidly (Fig.6a).The highest temperatures were reached at 13:00,from the lowest to the highest as follows: sand increased from 33.77 to 51.33 °C,Fissure I increased from 27.72 to 45.12 °C,and plants increased from 21.81 to 28.24 °C.
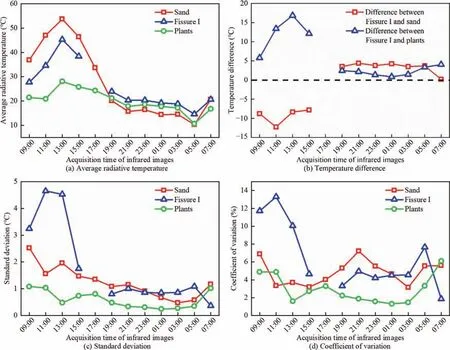
Fig.6.Radiative temperatures and statistical characteristics of sand,Fissure I,and plants [34] .
From 13:00 to 19:00,the radiative temperature of the fissures,plants and sand decreased rapidly.By 19:00,the radiative temperatures of the fissures,sand and plants reached their lowest value of 23.86,22.09,and 21.26 °C,respectively.However,ground fissures can’t be identified from the ground features in infrared images at 15:00,therefore the temperature can’t be extracted from the images at this time.The radiative temperature of Fissure I was higher than that of plants and lower than that of sand during the period from 09:00 to 19:00.
After 19:00,the temperature of the fissures,sand and plants continued to decrease,but the rate of decline dropped significantly.By 03:00,Fissure I,plants,and sand radiative temperatures decreased to 18.64,17.23,and 12.56 °C,respectively.From 03:00 to 05:00,the temperature significantly decreased,with decreases of 4.35,6.34,and 4.51 °C.From 05:00 to 07:00,the temperature increased and entered a new temperature cycle (Fig.6a).
The radiative temperature difference between Fissure I and the plants and sand was calculated,as shown in Fig.6b.The temperature difference between Fissure I and the sand and plants was positive and negative between 07:00 and 19:00,respectively.The maximum temperature difference between Fissure I and sand arrived at -12.52°C at 11:00,and the maximum temperature difference between Fissure I and plants arrived at 17.32 °C at 13:00.
The temperature difference between Fissure I and plants and sand was always positive between 19:00 and 07:00,and the magnitude of the temperature difference change was relatively small compared with that between 07:00 and 19:00.The temperature difference between Fissure I and the plants varied between 1 and 4 °C,and the temperature difference between Fissure I and sand was relatively large,varying between 1.5 and 6.5 °C.From 21:00 to 05:00,the average value of temperature difference between Fissure I and sand was 5.83°C.The temperature difference curve was approximately horizontal,and its magnitude was relatively stable.The relatively stable temperature difference can provide an ideal temperature conditions for the UAV infrared identification of the extracted fissures.
The standard deviation and coefficient of variation patterns of radiative temperature samples between Fissure I and the plants and sand in a daily cycle were significantly different (Fig.6c and d).The standard deviation and coefficient of variation of Fissure I were 3.24,4.61,4.52 °C and 11.68%,13.33%,and 10.02% for the three moments from 09:00 to 13:00,respectively.The standard deviation and coefficient of variation of the plants were 1.09,1.05,0.49 °C,and 5.02%,4.95%,1.73%,respectively.Meanwhile,the standard deviation and coefficient of variation of sand were 1.15,1.34,1.64 °C,and 3.4%,3.12%,and 3.2%,respectively.The above data show that the fluctuation of radiative temperature of Fissure I from 09:00 to 13:00 is significantly greater than that ofthe plants and sand.In contrast,during the period from 17:00 to 07:00,these two indicators of Fissure I were not significantly different from plants and sand,with standard deviations below 1 °C at most moments and coefficients of variation below 5%.
4.1.2.SpatialvariationpatternsoftheradiativeTFIandTFIIinROI
The large-sample standard deviation and coefficient of variation of the radiative temperature of Fissure I during the period from 09:00 to 15:00 indicate that there is a correlation between the magnitude of radiative temperature and extraction location(Fig.6c and d).Therefore,Li,WiandTiwere calculated and collated for different locations of Fissure I and Fissure II within the corresponding infrared images,and the results are shown in Fig.7.
From 09:00 to 15:00,the radiative temperature of Fissure I varies more significantly with the fissure width for differentLi,and the temperature variations can reach 8.31,11.37,7.49,and 4.71 °C(Fig.7a–d).At 09:00,11:00 and 15:00,the radiative temperatures of Fissure I and the fissurewshow a more prominent but opposite variation pattern.According to Table 11,the correlation coefficients between the radiative temperature and width of Fissure I at 09:00,11:00,and 15:00 are-0.732,-0.665,and-0.712,respectively,showing a strong negative correlation between them.The correlation coefficients between the radiometric temperature and the width of Fissure I from 19:00 to 05:00 were also different but insignificant,with temperature variations ranging from 2.19 to 3.51 °C.The correlation coefficients between the radiative temperature and the width of Fissure I from 19:00 to 05:00 were smaller,with a mean value of 0.319,indicating that the correlation is weak (Fig.7e–j).

Table 11 The correlation coefficient between radiative temperature and width of Fissure I and Fissure II at different times.
The radiative temperature of Fissure II showed a positive correlation trend with the fissure width at 03:00 and 05:00 for differentLi,which the fissure radiative temperature was higher at the location with a larger width(Fig.7k and l).The width correlation coefficients ofTFIIwere 0.741 and 0.708,which showed a strong positive correlation.
4.1.3.IdentificationofgroundfissuresintheinfraredimagesoftheROI
The infrared images in different time periods are shown in Fig.8.In the infrared images,the bright white area represents the high-temperature area,and the dark colour represents the low-temperature area.The image boundary is set with a reference range of white ash area of 45 cm×45 cm,and the boundary of the ROI presents a low-temperature area due to delineation by lime.In a daily cycle,the ground fissures could be clearly identified in the infrared images except at 17:00 and 07:00,the fissure temperature is close to that of the sand during this time.Between 03:00 and 05:00,the discernible fissures are the longest.
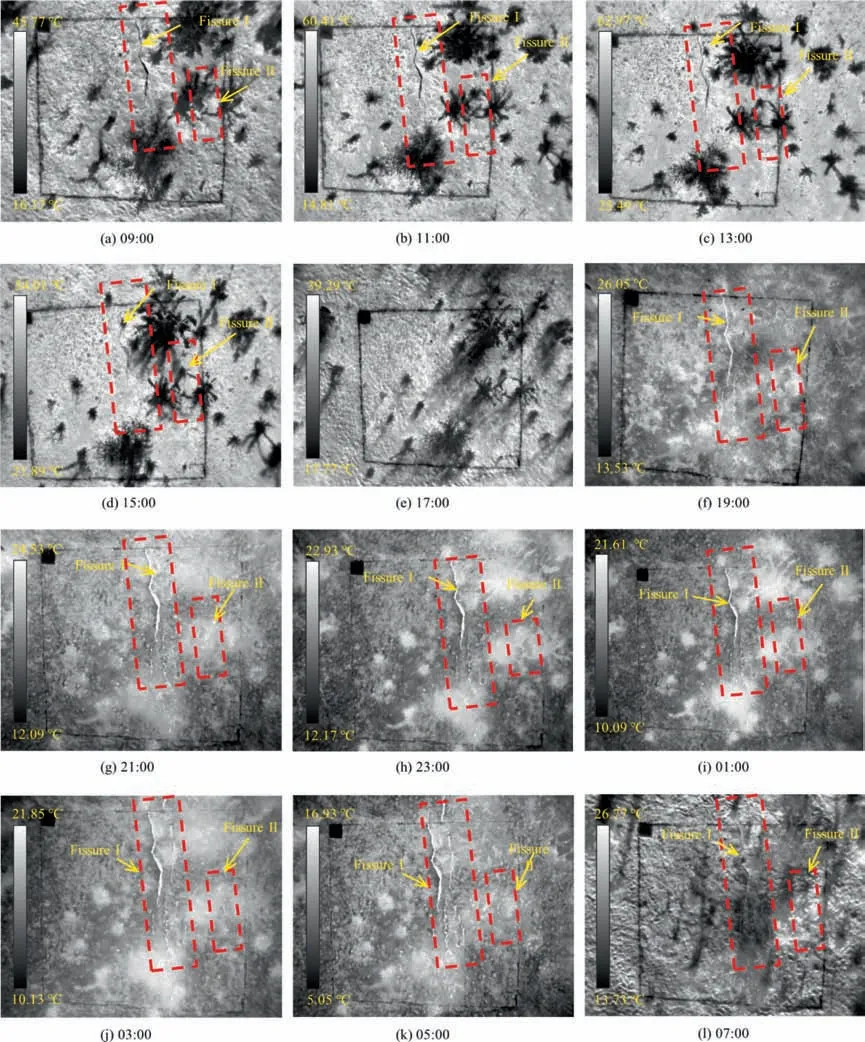
Fig.8.Infrared images of the ROI at different times.
4.2. Development of the overburden fracture field under different mining conditions
The distributions of the mining fracture fields after each model reaches full subsidence are shown in Fig.9.After the rock layer above the working face is broken,and a ring-shaped fracture circle is produced in the overburden due to the support effect of the coal seam behind the cutting hole and the coal wall of the working face.Within the fracture circle,the broken expansion coefficient of the rock is large.Delamination fractures and cavities are formed between rock layers caused by splitting,and vertical fractures are produced by the broken rotary between rock blocks.In the middle of the goaf,the broken rock blocks are constantly compacted by the gravity of the overburden and become the recompaction area,with a smaller broken expansion coefficient and fewer fractures.
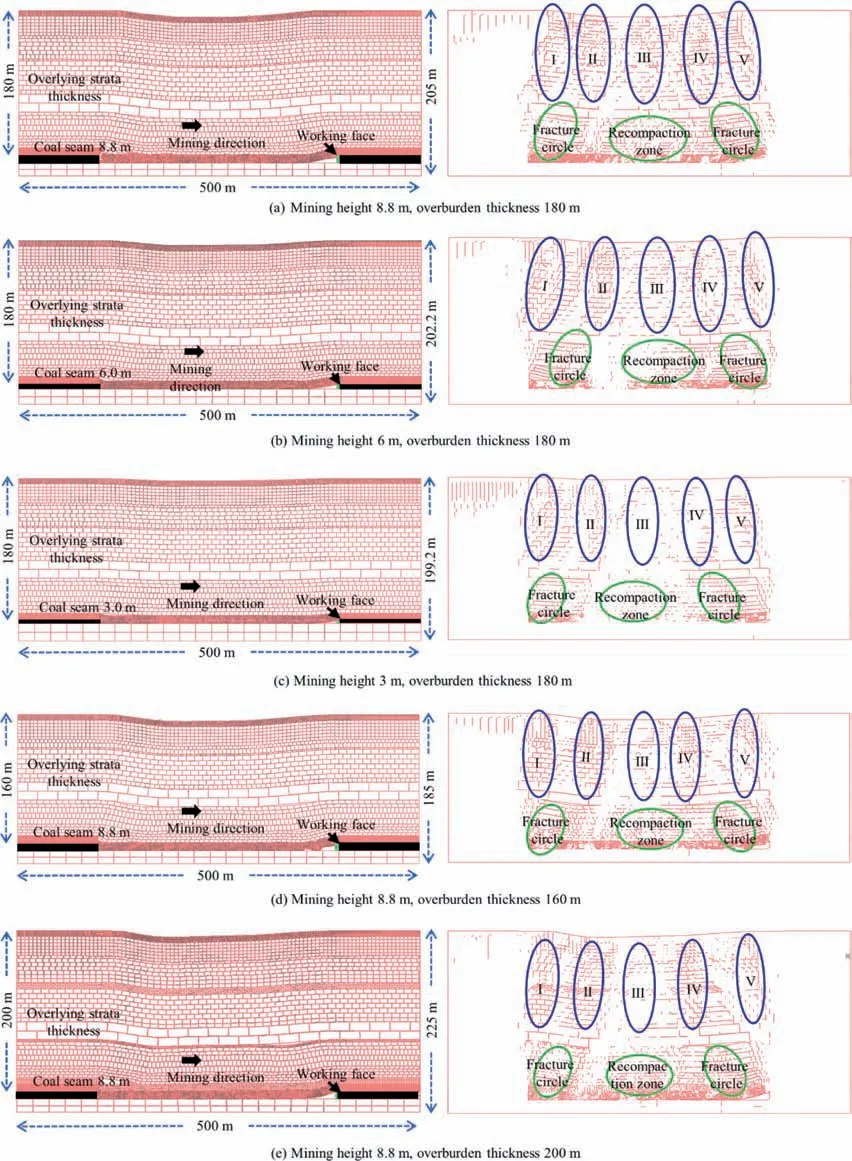
Fig.9.Fracture field distribution under full subsidence.
According to the development location,the mining ground fissures can be divided into five zones(Fig.9a–e),namely,the fissure development area at the cutting hole (Zone I),the fissure area in front of the cutting hole (Zone II),the fissure closure area in the middle (Zone III),the fissure area behind the working face (Zone IV) and the fissure development area ahead of the working face(Zone V).The ground fissures in Zones I,II,IV,and V have both delamination fractures and vertical fractures,which are more deeply developed and easily form Fissure I.After certain period of natural settlement in Zone III,the vertical fractures appear to be closed,and the horizontal delamination fractures tend to reduced.In summary,an overlying stratum with a large mining height and a shallow depth coal seam is susceptible to the formation of a penetration type fracture field and Fissure I.Additionally,with decreasing mining height and the increasing overburden thickness,the surface damage is reduced and prone to form Fissure II.
4.3. Effect of mining conditions and WFI on TFI evolution and heat transfer
4.3.1.EvolutionofTFIunderdifferentminingconditions
When the mining height is 8.8 m,overburden thickness is 200 m,the fissure surface atLFI=25 m shows a low or a hightemperature zone relative to the surface temperature,and the colour distribution from the left side to the right side of the fissure is‘‘bright-dark-bright” or ‘‘dark-bright-dark” during daytime and nighttime,respectively.The fissure surface and ground surface on both sides of the fissure show the same colour atLFI=75 m,LFI=125 m,LFI=175 m,LFI=225 m,andLFI=275 m during daytime and nighttime,indicating that there is almost no temperature difference between the fissure and ground (Fig.10a).
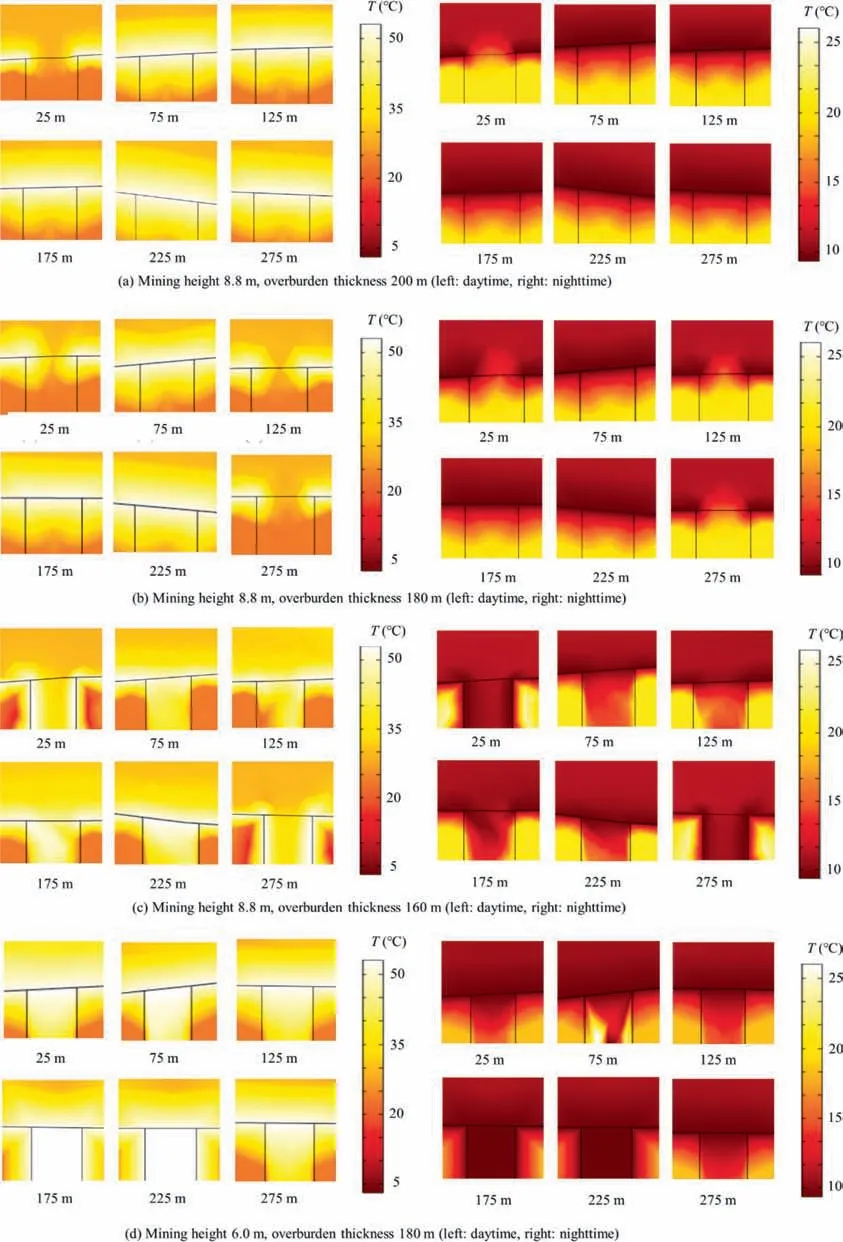
Fig.10.The TFI under different locations and mining conditions.
With overburden thickness decreasing to 180 m,the colour difference between the fissure and ground atLFI=25 m,LFI=125 m,andLFI=275 m is significant,indicating a large temperature difference.The temperature at the centre of the fissure surface is lower and the colour is darker during daytime.The fissure surface temperature is higher and the brightness is higher during nighttime.In addition,fissures at the cutting holeLFI=275 m have a larger range of areas with lower or higher surface temperatures than those atLFI=125 m andLFI=25 m.When the fissures are atLFI=75 m,LFI=175 m,andLFI=225 m,the fissure surfaces are almost the same colour as the ground surface,indicating that there is almost no temperature difference between them (Fig.10b).
Fig.10c shows the temperature distribution clouds of the fissures at a 160 m thick overburden and an 8.8 m mining height.The colour difference between the fissures and ground is significant atLFI=25 m andLFI=275 m during daytime and nighttime,and the colour at the centre of the fissures is close to the atmospheric colour.
When the overburden thickness is 180 m and the mining height is 6 and 3 m,the fissure surface shows the same colour as the ground surface during both daytime and nighttime.These results indicate that there is no significant temperature difference between it and the ground surface (Fig.10d and e).
TheTFIat six different locations were calculated during daytime and nighttime(Fig.11).The mining height is 8.8 m during daytime(Fig.11a),when the overburden thickness is 200 m,andLFI=25 m,ΔTFI-Gis-14.2°C,and there is almost no temperature difference at the remaining locations.When the overburden thickness is 180 m,ΔTFI-Gis -9.87,11.06,and 14.22 °C atLFI=25 m,LFI=125 m,andLFI=275 m,respectively.When the overburden thickness is 160 m,ΔTFI-Gis smaller atLFI=75 m,LFI=175 m,andLFI=225 m.When the overburden thickness is 160 m,ΔTFI-Gis smaller at 75 and 225 m,ΔTFI-Gis -3.24 and -4.02 °C atLFI=125 m andLFI=175 m,and ΔTFI-Gis -12.4 and -12.08 °C atLFI=25 m andLFI=275 m,respectively.

Fig.11.Variation of TFI at different LFI under different mining conditions.
When the mining height is 8.8 m,theTFIduring nighttime at different locations are shown in Fig.11b.When the overburden thickness is 200 m,the ΔTFI-GatLFI=25 m is 4.24°C,and the ΔTFI-Gat the remaining locations is small.When the overburden thickness is 180 m,ΔTFI-Gdoes not vary significantly with locations atLFI=25 m,LFI=125 m,andLFI=275 m,and is 2.23,2.9,and 3.63°C,respectively.The ΔTFI-Gis smaller atLFI=75 m,LFI=175 m,andLFI=225 m.When the overburden thickness is 160 m,the ΔTFI-Gvalues atLFI=25 m andLFI=275 m are 1.18 and 1.13°C,respectively.The ΔTFI-Gvalues atLFI=75 m andLFI=225 m are less than 0.5 °C,respectively.The ΔTFI-Gvalues atLFI=125 m andLFI=175 m are between 0.6 and 1°C.
When the overburden thickness is 180 m,theTFIat different locations is similar to the temperature of the ground surface when the mining height is 6 and 3 m under two different atmospheric conditions,and there is almost no temperature difference(Fig.11c and d).When the mining height reaches 8.8 m,the fissure surface temperature is lower than the ground temperature during daytime and higher than the ground temperature during nighttime.
4.3.2.EvolutionofTFIunderdifferentWFI
Fig.12 shows the cloud map of the surface temperature distribution of different fissure widths.WhenWFI≤60 cm during daytime,Fissure I and the ground temperature distribution on both sides show a whole continuous white high-temperature band,and there is no colour difference or temperature difference between the ground fissure and the surface on both sides.WhenWFIexceeds 60 cm,the low-temperature range appears on the surface of the fissure,and the range of the low-temperature region expands asWFIkeep increasing.Judging from the colour,the low-temperature range on the fissure surface is similar to the atmospheric temperature.Moreover,there is a similar temperature distribution pattern during nighttime.
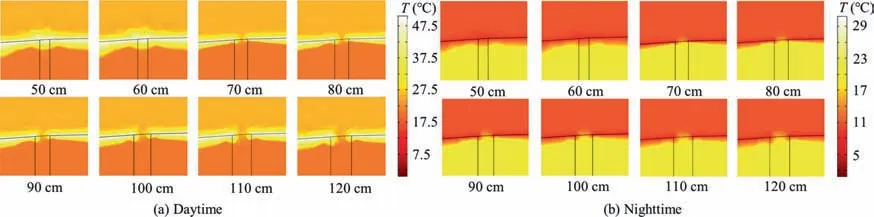
Fig.12.Cloud map of the distribution of TFI with different WFI.
From the left side to the right side of the fissure surface,several points were evenly selected to analyze theTFIdistribution law(Fig.13a and b).The average value of these data points was calculated as theTFI.The ΔTFI-Gvalues vary with the fissure width,as shown in Fig.13c.

Fig.13.Variation of TFI and ΔTFI-G under different WFI.
During daytime,the temperature curve at each position within the fissure surface is approximately a horizontal straight line atWFI=50 cm andWFI=60 cm,and its temperature value is approximately equal to a surface temperature of 50 °C.WhenWFIexceeds 60 cm,the temperature within the fissure surface is low at the centre and high on both sides.The temperature at the central position is close to the atmospheric temperature of 25 °C,and ΔTFI-Gis the largest,close to -25 °C.The ΔTFI-GwithWFIabove 70 cm do not vary significantly,the average value is approximately -15 °C.
During nighttime,theTFIofWFI=50 cm andWFI=60 cm at each position is approximately a horizontal straight line,and its temperature value is approximately equal to a surface temperature of 8°C.WhenWFIexceeds 60 cm,theTFIis high at the centre and lower at the sides.The temperature at the centre is significantly higher than that of the ground surface,and ΔTFI-Gcan reach 4 to 6 °C.In addition,the ΔTFI-Gvalue with a width of 70 cm and above does not vary significantly with increasing fissure width,and the average value is approximately 3.89 °C.
4.4. Effect of DFII and WFII on evolution of TFII
4.4.1.EvolutionofTFIIunderdifferentDFII
TheTFIIdistribution clouds ofDFII=50 cm,andDFII=3,8,and 10 m are shown in Fig.14a and b.The colour at the central fissure surface significantly differs from the colour on both sides of the ground surface atDFII=3 m.During daytime,the temperature distribution on the fissure surface is low at the centre and high on both sides.This distribution presents an opposite situation under lowtemperature conditions,with a brighter colour and higher temperature in the centre and darker colour and relatively lower temperatures on both sides.WhenDFII=8 m,the range of fissures affected by the ground surface temperature on both sides is significantly enlarged compared to that ofDFII=3 m,and the colour within the surface of fissures is closer to the surface colour.WhenDFII=10 m,the range of surface temperature influence completely covers the fissure,and the fissure surface temperature is same as the ground temperature.

Fig.14.Cloud map distribution of TFII under different DFII and WFII.
The fissure surface temperature atDFII=1 to 20 m was extracted,and ΔTFII-Gwas calculated.The variation in ΔTFII-Gwith the change inDFIIcan be divided into three stages both during daytime and nighttime (Fig.15a and b).When 0<DFII<5 m,the ΔTFII-Gis large,and ΔTFII-G<-10°C during daytime,and ΔTFII-G>2°C during nighttime.When 5<DFII<10 m,theTFIIand ΔTFII-Gdo not change much,approximately 44 and -6 °C during daytime,and approximately 9.5 and 1.5 °C during nighttime.WhenDFII>10 m,the maximum values of ΔTFII-Gunder the two different conditions are -0.31 and 0.21 °C,respectively.
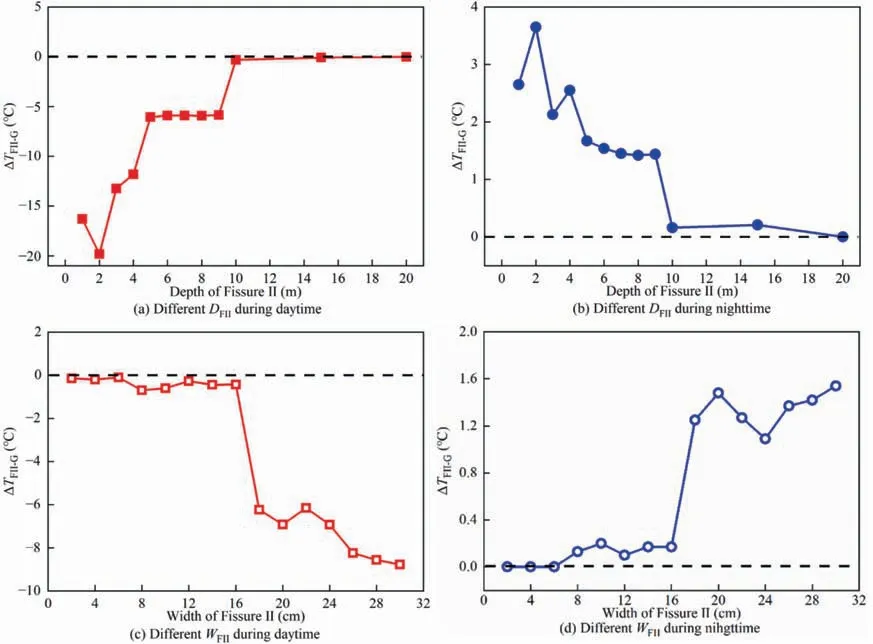
Fig.15.Variation law of the ΔTFII-G.
4.4.2.EvolutionofTFIIunderdifferentWFII
TheTFIIdistribution clouds forDFII=2 m andWFII=10,20,and 30 cm are shown in Fig.14c and d.During the daytime,the colour difference between the centre of the fissure surface and the ground surface on both sides of Fissure II is not obvious atWFII=10 cm.The fissure surface is connected with the ground surface as a continuous high-or low-temperature zone.WhenWFII=20 cm,a lowtemperature zone exists in the shape of an hourglass on the fissure surface.The colour within the low-temperature zone is red and divided by yellow-white into both sides.
During nighttime,the middle position of the fissure surface is higher in temperature and has an hourglass shape with small upper and large lower parts,which are divided by black on both sides.WhenWFII=30 cm,the range of the low-temperature hourglass increases,and the waist widens during daytime.The fissure surface shows a trapezoidal high-temperature area during nighttime,and the range increases significantly atWFII=20 cm.
The temperature of the fissure surface atWFII=2 to 30 cm was extracted to calculate the ΔTFII-G.The results are shown in Fig.15c and d.WhenDFII=2 m,theTFIIand ΔTFII-Gvalues varied withWFII,it can be divided into three stages:WFII<18 cm,WFII=18 cm andWFII>18 cm.WhenWFII<18 cm,theTFIIwas above 49 and below 8.2 °C during daytime and nighttime,respectively.WhenWFII=18 cm,theTFIIduring daytime decreased rapidly relative to that atWFII=16 cm,and the ΔTFII-Gdecreased from -0.43 to -6.2 4 °C.The ΔTFII-Gincreased from 0.17 to 1.25 °C during nighttime.WhenWFII>18 cm,ΔTFII-Ggenerally increased continuously with the increasing ofWFII.WhenWFII=30 cm,ΔTFII-Gis -8.78 and 1.54 °C for the two temperature conditions.
4.5. Effect of month alternation on temperature evolution
The evolution ofTFI,TFII,ΔTFI-G,and ΔTFII-Gduring daytime in different months are shown in Fig.16a and b.TheTFIandTFIIvary sinusoidally from January to December,with the highest temperatures reaching 37.77 and 42.12 °C in July,respectively.From October to March,theTFIis higher thanTFII,the temperature difference is positive,and the ΔTFI-Gis larger than ΔTFII-G.From April to October,theTFIis lower thanTFII,the temperature difference is negative during this period.The absolute value of ΔTFI-Gis larger than ΔTFII-G.In July,the absolute values of temperature difference are the largest,specifically,13.73 and 9.38°C for Fissure I and Fissure II.

Fig.16.Variation of the TFI,TFII,ΔTFI-G,and ΔTFII-G in different months.
The evolution ofTFI,TFII,ΔTFI-G,and ΔTFII-Gduring nighttime in different months are shown in Fig.16c and d.The fissure temperature in different months has a sinusoidal character,and theTFIwas always higher than that of theTFII,with maximum values in July at 14.91 and 13.17°C,respectively.The temperature difference is always positive.In July,the temperature difference reached a minimum at 2.91 and 1.17 °C for Fissure I and Fissure II,respectively.Moreover,the ΔTFI-Gis always about twice higher than ΔTFII-G.However,the ΔTFI-Gand ΔTFII-Gin March to October is significantly larger than that from October to March.
5.Discussion
5.1. Comparative discussion on field measurement and numerical simulation
Underground coal mining eventually lead to fracture of overburden and ground subsidence,thereby causing ground fissures[50].The cold gas in fissure is heated by ground during daytime,generates volume expansion,and moves upwards,keeping the temperature at the fissure surface lower than that of the ground surface.However,the warm gas temperature inside the fissure is higher than the fissure surface temperature and generates the uplift force during nighttime.The heat is transferred upwards from the inside and generates a high-temperature area at the middle of the fissure surface.This phenomenon was also termed as ‘‘breath”effect on daily time scales [51,52].The numerical results on temperature evolution trend are consistent with the field measurement.
The air flow in overburden fracture field are generally effected by the length (overburden thickness) and width of fracture (WFI)for Fissure I.With fluid flow in a straight pipe,the resistance loss is proportional to the primary square of the velocity and the pipe length and inversely proportional to the quadratic of the pipe diameter.Therefore,the relative resistance to fracture airflow increased with the increasing of fissure depth and decreasing of fissures width.Field measurement and simulation showed that the evolution ofTFIis positively correlated with increasing of overburden thickness and decreasing ofWFIduring daytime,and negatively correlated with increasing of overburden thickness and decreasing ofWFIduring nighttime.
TheTFIIis controlled by inside fissure temperature for Fissure II.TheTFIIshows a positive trend with the increase ofDFIIduring daytime and a negative trend during nighttime.The main reason is the friction loss generated by the fissure wall with the increase ofDFII,the momentum generated by the pressure difference and temperature difference is not enough to make the gas inside the fissure uplift to the surface.On the contrary,theTFIIshows a negative trend with the increase ofWFIIduring daytime and a positive trend during nighttime.Moreover,the simulation results indicate that the fissure temperature will be stable with the increase of fissure width and depth,when theDFIIreaches 10 m,andWFIIreaches 16 cm.
5.2. Analysis of optimal time window of UAV infrared field measurement
Permanent fractures are regularly formed at the boundary of the ground above the working face and connected to goaf.The ΔTFI-Gvalues atLFI=25 m andLFI=275 m are significant under the continuous heat transfer of Fissure I between the ground and the goaf.The ΔTFI-Gis smaller above the working face(LFI=75 m andLFI=225 m).However,TheTFIinside the central closure zone,which is betweenLFI=75 m andLFI=225 m,is related to the thickness of the overlying rock layer.It indicated that the UAV infrared field measurement can effectively identify the boundary Fissure I of the working face.It also can be found that ground fissures induced by high-intensity mining can be effectively identified.Fissure II can be more obviously identified by infrared imager during nighttime.
All ground fissures can be identified all year round during nighttime.Besides,the ΔTFI-Gis the smallest during daytime in March and November.This indicates that during these two periods,the identification of Fissure I using UAV infrared survey should be avoided during the daytime.
5.3. Shortcomings and prospect
In this study,the UAV infrared monitoring and numerical simulation increased our understanding of the temperature evolution of ground features and identification of ground fissures.However,this study still has some shortcomings.In field measurement,it is difficult to accurately measure the overburden fracture field.Thus,it is still necessary to combine the UDEC simulation to obtain reliable results,and the observation of strata movement needs to be conducted.Furthermore,the simplified overburden fracture field and ground fissures in COMSOL models need further consideration of the dynamic evolution with mining advancement.Moreover,ground features temperature is controlled by thermal conductivity,which can vary with moisture,inner structure,sunshine intensity,among other factors.Therefore,in future work,more UAV infrared field measurement needs to be conducted on large area of the mining subsidence area to certify the results.
6.Conclusions
In this study,taking the Shangwan colliery as the engineering background,field measurements and numerical simulations were carried out to study the heat transfer and temperature evolution of overburden fracture and ground fissures.In addition,to find the optimal time and season to identify mining ground fissures by a UAV-based infrared imager,the temperature difference was also investigated.The main conclusions are described as follows:
(1) Diurnal variation of ground feature temperature has a sinusoidal character,and the radiativeTFIis lower than that of ground during daytime and higher than that of ground during nighttime.The UAV and infrared imager can effectively identify the ground fissures from the infrared images.
(2) For Fissure I,air flow resistance in overburden fracture field are generally effected by the length (overburden thickness)and width of fracture(WFI).The evolution ofTFIis positively correlated with increasing of overburden thickness and decreasing ofWFIduring daytime,and negatively correlated with increasing of overburden thickness and decreasing ofWFIduring nighttime.It was also found that the ΔTFI-Gnear the cutting hole and working face (Zone I and Zone V) are obvious,and the ground fissures can be identified.The ΔTFI-Gin the central closure area (Zone III) is small and almost 0°C.
(3) TheTFIIshows a positive correlation with the increase ofDFIIduring daytime and a negative correlation during nighttime.TheTFIIshows a negative correlation with the increase ofWFIIduring daytime and a positive correlation during nighttime.The simulation results indicated that the ΔTFII-Gis close to 0 °C both at daytime and nighttime beforeWFII<16 cm,and increases sharply afterWFII>16 cm.
(4) From January to December,bothTFIandTFIIhas a sinusoidal character.The ΔTFI-Gwas higher than ΔTFII-Gat all times.The ΔTFI-Gand ΔTFII-Greached minimum values in April and October during daytime.UAV infrared identification of fissures should be carried out during nighttime in April and October.
Acknowledgements
This work was supported by the National Natural Science Foundation of China (Nos.52225402 and U1910206).
- 礦業科學技術學報的其它文章
- Preliminary research and scheme design of deep underground in situ geo-information detection experiment for Geology in Time
- Numerical and experimental investigation on hydraulic-electric rock fragmentation of heterogeneous granite
- Classifying rockburst with confidence: A novel conformal prediction approach
- Drilling-based measuring method for the c-φ parameter of rock and its field application
- Pore-pressure and stress-coupled creep behavior in deep coal: Insights from real-time NMR analysis
- Experimental investigation of the inhibition of deep-sea mining sediment plumes by polyaluminum chloride